 Duplex
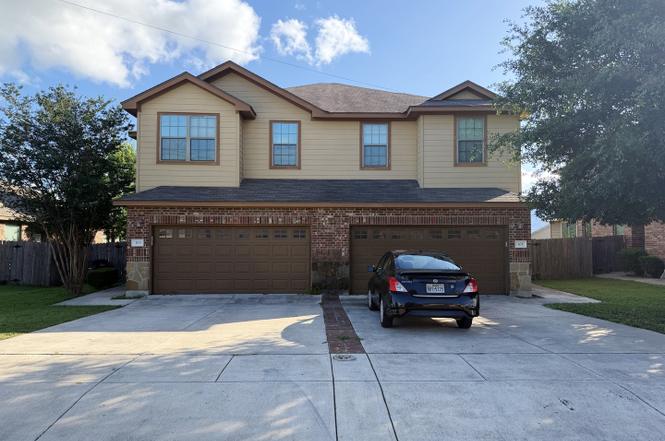
303 & 305 Rosalie · New Braunfels, TX
Flood risk 1/10 · Minimal
- FEMA flood zone
- X (unshaded)
- Chance of flooding over 30 yrs
- 0.0%
- Est. flood insurance / yr
- $507 – $1,088
Fire risk 4/10 · Minor
- Est. fire insurance / yr
- $1,222 – $2,270
Heat risk 8/10 · Major
- Hot days now (above 108°F)
- 7 days/yr
- Hot days in 30 yrs
- 22 days/yr
Wind risk 8/10 · Major
- Chance of severe wind over 30 yrs
- 80.0%
Air-quality risk 1/10 · Minimal
- Unhealthy air days now
- 0 days/yr
- Unhealthy air days in 30 yrs
- 0 days/yr
Risk factors via First Street. Map © Google.
Why this score? — see what drove the D+ grade
The composite is a weighted blend of 9 inputs, each scored 0–100. Each bar is that input's sub-score; the figure is the points it added to the 100-point composite (weight × sub-score).
- ARV discount +15.0/15.0
- Cash flow +12.4/30.0
- Schools +5.2/10.0
- Livability +4.2/5.0
- DSCR +3.7/10.0
- 1% rule +3.5/10.0
- Condition / age +2.5/5.0
- Rent growth +2.0/5.0
- Appreciation +0.0/10.0
$379,000
🖨 Deal sheet (PDF) 📄 Offer letter ✓ Due diligence
Multi-family units
County records classify this as Multi-Family (5+ Unit). Listing-text estimate: 2 units. estimate disagrees with records
5+ unit building — per-unit beds/baths from public records are typically unavailable; the breakdown below (if shown) is an estimate from the listing text.
Listing remarks
Investment opportunity in the heart of New Braunfels! This well-maintained duplex at 303 & 305 Rosalie offers two spacious units, each side featuring 3 bedrooms, 2.5 bathrooms, approximately 1,341 square feet, fenced backyards, and an attached 2-car garage. Located on a quiet cul-de-sac street, the property provides an attractive setting for long-term tenants while offering convenient access to shopping, dining, schools, and major commuter routes. Both units are currently occupied with leases in place through June 2027, providing immediate rental income. The property generates a combined monthly rental income of $2,720, making it an excellent addition to an investor's portfolio. With
Key facts
- Strong rental demand
- Fenced backyards
- 8,712 sq ft lot
Tags
Property features AI
Finance
- Other: Zoning: R2; Builder: Value Builders
- Financial info: Gross annual income: $32,640; Net operating income: $29,376; Annual operating expense: $3,264 (includes management); Unit 1 rent: $1,425; Unit 2 rent: $1,295; Vacancy rate: 5%; For sale (not a short sale)
- HOA & community: Subdivision: OELKERS ACRES / OELKERS ACRES 2
Exterior
- Parking: Attached parking serving each unit; Unit 1: 4 parking spaces; Unit 2: 4 parking spaces
- Utilities: Separate electric meters; Separate water meters; City water and sewer service; Electricity supplied by NBU; Water supplied by NBU; Sewer supplied by NBU; Garbage service by NBU
- Home design: 2 total units (multifamily); Pre-owned construction; Approximate age: 13 years
- Construction: Slab foundation; Composition roof
- Exterior features: Brick, stone/rock, siding and cement fiber exterior; 4-sided masonry exterior; Covered patio; Patio slab
Interior
- Kitchen: Oven/Stove; Dishwasher; Garbage disposal
- Bedrooms: Unit 1: 3 bedrooms (occupied); Unit 2: 3 bedrooms (occupied)
- Flooring: Carpeting; Ceramic tile
- Bathrooms: Unit 1: 2 full baths, 1 half bath; Unit 2: 2 full baths, 1 half bath
- Heating & cooling: Central heating; Electric heat; One central air conditioning unit
- Interior features: Window coverings; Covered patio; Patio slab
- Laundry & utility: Washer connection; Dryer connection
Neighborhood map
What this means for you Summary
Snapshot
- This is a 2 × 3.0-bed/2.5-bath units multifamily listed at $379k.
Deal economics
- At list price, monthly cash flow is $-61 ($-734/yr) — negative. Per door: $-31/mo.
- To cash-flow at today's rent, offer at most $370k (2.3% below list).
- To meet the 1% rule (rent ≥ 1% of price), the offer needs to be $324k (14.6% below list).
- Recommended offer: $324k (14.6% below list) — sets the bar for 1% rule.
- Cap rate 6.1% vs local median 3.3% in New Braunfels — top-decile yield for the area; either an underpriced asset or a hidden risk that comps aren't pricing in. Stress-test before assuming the spread holds.
Location & tenants
- Location reads 83/100 on livability (#9 in TX, #925 nationally) — a professional / high-income tenant draw. Strengths: amenities A+, housing A+, health & safety A+; Watch: commute F.
- Comal ISD (rural): math 57% / reading 59% proficiency, ranked #58 of 826 in TX (top 7%) — acceptable for families but not a draw, mixed tenant base, ~2y average lease.
- Zoned schools: Freiheit El (math 37% / reading 43%, grade F, #1,514 of 4,322 statewide, top 36%, 910 students, 55% FRL); Canyon Middle (math 48% / reading 44%, grade D+, #462 of 1,662 statewide, top 28%, 1,175 students, 47% FRL); Canyon H S (math 59% / reading 65%, grade B-, #237 of 1,632 statewide, top 16%, 2,348 students, 35% FRL).
- Market conditions: Rents soft (-2.0%/yr); 1931 active listings in the ZIP; 4 comparable units currently listed for rent nearby; rentals lingering (median 46d on market — plan ~5-8 weeks vacancy on turnover, expect pricing pressure); 75% of comp listings sitting > 30 days — soft ceiling on asking rent; solid renter incomes; 3,420 units permitted in Comal County in 2024 (1,164 in 5+ unit buildings).
- At $3,238/mo this rent would consume 47% of the median local household income ($83k/yr) (locally 2912% of renters already pay >50% of income on rent) — very limited rent-growth headroom before tenants either downsize or default.
Forward outlook
- Local home prices are declining (-3.0%/yr); year-one equity from $3k of loan paydown is wiped out by about $11k of value loss. Plan a longer hold.
- Comal County population projected at +70% by 2050 — long-run rental-demand tailwind backs the buy-and-hold thesis.
Negotiation context
- Only 11 days on market — expect competitive offers; lowballing is unlikely to land.
- 3 sale attempts since 3y ago with the ask held roughly flat each time — persistent listings suggest the price (not the market) is what's stuck; bring a comps-based counter.
Risks & watch-outs
- Climate carrying-cost: severe wind risk, 80% chance of damaging wind over 30y; extreme-heat days projected 7→22/yr by 2055 (HVAC capex compounding) — expect insurance premiums to compound above CPI over the hold.
Questions for the listing agent
- What do current leases actually rent for vs. the listed asking? Can we see a recent rent roll and the last 12 months of T-12 income?
- Can we see the unit-by-unit rent roll, current vacancy, and any below-market leases? What's the average tenancy length?
- What capital expenditures (roof, boiler, parking lot, exteriors) have been made in the last 5 years, and what's planned in the next 2?
- Is there a deadline driving the sale (1031 exchange, divorce, estate, relocation)? That informs how much negotiation room exists.
- Schools are B-rated — typically a magnet for longer-tenancy family renters. What's the average tenant stay here, and is there a school-zone premium baked into asking?
- The area grade is low — what's the realistic commute time and amenity access for the typical tenant pool here? Any planned neighborhood developments (good or bad) we should know about?
- What's the average days-on-market for RENTAL listings here right now (not sales)? A rising rental-DOM trend means longer vacancies and softer asking-rent achievability than the comps imply.
- What's the recent tenant-quality profile in this submarket — average credit score on applications, eviction rate, late-payment / NSF rate, and stable-employment percentage? A property-management company in the area should have these aggregated.
- How much new apartment / multifamily construction is in the pipeline within 1–3 miles? Heavy new supply (>2% of stock underway) typically softens rents 12–24 months out; light construction supports rent growth.
Investment metrics
- 1% rule
- 0.85% ✗
- Cap rate
- 6.10%
- Cash-on-cash
- -0.69%
- DSCR
- 0.97
- GRM
- 9.8
CMA / ARV
- ARV (on-the-fly)
- $486,304
- Comps found
- 4
Show comp detail 4 sales within ~0.75 mi
| Address | Dist | Beds/Ba | Sqft | Sold | Price | $/sf | Match |
|---|---|---|---|---|---|---|---|
| 241 Anne Louise | 0.13mi | 6/4.0 | 2,424 (-9%) | 2mo | $440,000 | $182 | 73 |
| 307-309 Rosalie Dr | 0.02mi | 6/4.5 | 2,460 (-8%) | 15mo | $407,500 | $166 | 71 |
| 260-262 Rosalie Dr | 0.07mi | 6/4.0 | 2,350 (-12%) | 2mo | $409,000 | $174 | 70 |
| 256 Rosalie Dr | 0.09mi | 6/4.0 | 2,350 (-12%) | 21mo | $430,000 | $183 | 54 |
Match score weights: distance 35% · size 25% · config 20% · recency 20%. Top-matched comps best support the ARV.
Projected returns pro-forma
-3.0% appreciation · 0.0% rent growth · sell at horizon
- IRR
- -20.8%
- Equity multiple
- 0.30×
- Total profit
- $-74,750
- Equity at exit
- $56,510
- IRR
- -23.1%
- Equity multiple
- -0.00×
- Total profit
- $-106,581
- Equity at exit
- $32,769
Cash invested: $106,120 (down + closing). Projections, not guarantees.
Landlord ↔ Tenant lean methodology
- Overall (STATE)
- 87 Strongly Landlord-Friendly
- State Texas
- 87 Strongly Landlord-Friendly · R+5
- County
- — inherits STATE
- City
- — inherits STATE
ZIP-level market 78130
- Rents YoY
- -2.0%
- Active inventory
- 1931
- Price-to-rent
- 19.5×
Monthly cashflow live
- Estimated rent
- $3,238 high interval (Pro) →
- Mortgage (P&I)
- −$1,988
- Tax est. 1.5%
- −$474 /mo · $5,685/yr
- Insurance
- −$158
- HOA
- −$0
- Vacancy / Maint / Mgmt
- −$680
- Net cashflow
- $-61
Break-even live
Sensitivity live
| Price | -10% $201 | -5% $70 | +0% $-61 | +5% $-192 | +10% $-323 |
|---|---|---|---|---|---|
| Rent | -10% $-317 | -5% $-189 | +0% $-61 | +5% $67 | +10% $195 |
| Rate | -1.0pp $130 | -0.5pp $35 | base $-61 | +0.5pp $-159 | +1.0pp $-259 |
2-unit breakdown (identical units grouped — click to expand)
| Units | Beds | Baths | Est. rent |
|---|---|---|---|
| 2× units | 3.0 | 2.5 | $3,238 |
| #1 | 3.0 | 2.5 | $1,619 |
| #2 | 3.0 | 2.5 | $1,619 |
| Total (2 units) | $3,238 | ||
UW: 25.0% down · 7.5% · 30yr · 1.5% tax · 5.0% vac · 8.0% maint · 8.0% mgmt
Financing live
Cash to close
- Down payment
- $94,750
- Closing costs
- $11,370
- Reserves months
- —
- Total cash needed
- —
Loan-product check · same deal, 3 products live
Conventional
25% down · 7.5% · 30yr
- Down + closing
- —
- Monthly P&I
- —
- Monthly cashflow
- —
- DSCR
- —
- Eligible?
- —
Personal DTI + credit; lowest rate.
DSCR
20% down · 8.5% · 30yr
- Down + closing
- —
- Monthly P&I
- —
- Monthly cashflow
- —
- DSCR
- —
- Eligible?
- —
No personal income docs; deal must DSCR.
Hard money
10% down · 12.0% · 12mo
- Down + closing
- —
- Monthly P&I
- —
- Monthly cashflow
- —
- DSCR
- —
- Eligible?
- —
Short-term bridge; refi at stabilization.
Rent comps 4 comps
| Address | Beds | Baths | Sqft | Rent | $/sqft | DOM | Units | Dist |
|---|---|---|---|---|---|---|---|---|
| 722 Jennifer Way New Braunfels, TX | 5.0 | 2.5 | 1892 | $1,995 | $1.05 | 46d | 1 | 0.88mi |
| 1253 Ella Xing New Braunfels, TX | 5.0 | 3.5 | 2831 | $2,300 | $0.81 | 0d | 1 | 1.32mi |
| 731 Myrtle Path New Braunfels, TX | 5.0 | 3.0 | 2593 | $2,600 | $1.00 | 46d | 1 | 1.33mi |
| 2072 Oxbow Cir New Braunfels, TX | 5.0 | 3.5 | 3283 | $2,500 | $0.76 | 46d | 1 | 1.36mi |
Listing history 7 events
-
2026-06-21statusdays on market $379,000 Active 11 DOM
-
2026-06-18days on market $379,000 New 8 DOM
-
2026-06-17days on market $379,000 New 7 DOM
-
2026-06-16days on market $379,000 New 6 DOM
-
2026-06-15days on market $379,000 New 5 DOM
-
2026-06-13remarks 695-char remark
-
2026-06-13$379,000 New 3 DOM
ⓘ Source: listings_history table (triggers on properties + properties_extension) + one-shot
backfill from property_details.listing_events for pre-trigger history.
Climate risk First Street
- Flood 1/10 Low FEMA zone X (unshaded) · 0% chance over 30 yrs
- Wildfire 4/10 Moderate
- Heat 8/10 Severe 7 d/yr ≥108°F today · 22 d/yr by 30 yrs out
- Wind 8/10 Severe 80% chance of damaging wind over 30 yrs
- Air quality 1/10 Low 0 unhealthy d/yr today · 0 by 30 yrs out
Nearby sold comps map
Loading sold comps map…
Walkable amenities ~0.75 mi
Loading nearby amenities…
Taxation est. · year 1
- Rental income
- $38,856
- − Mortgage interest
- −$21,230
- − Property taxes
- −$5,685
- − Insurance
- −$1,895
- − Repairs & maintenance
- −$3,108
- − Management
- −$3,108
- − Depreciation
- −$11,025
- Taxable loss
- −$7,196
- Est. tax savings @ 24.0%
- +$1,727
- After-tax cash flow
- $993/yr
For passive investors: Depreciation is non-cash, so a rental often shows a tax loss while cash-flowing — sheltering income. Rental losses are passive: they offset passive income freely, and up to $25,000/yr can offset ordinary (W-2) income if you actively participate and your MAGI is under $100k (phasing out to $0 by $150k); unused losses carry forward. On sale, claimed depreciation is recaptured at up to 25%, and gains may owe capital-gains tax (a 1031 exchange can defer both). Figures are a year-1 estimate at your 24.0% rate — not tax advice; consult a CPA.
Schools (NCES district)
- District
- Comal ISD
- NCES district ID
- 4814730
- Math proficiency
- 57% ▼ -9.00%
- Reading proficiency
- 59% ▼ -2.00%
- Median HH income
- $74,792
- Composite
- 51.79/100
- National rank
- #1671
- State rank
- #58 of 826 in TX
Livability — New Braunfels
- Score
- 83/100
- State rank
- #9
- US rank
- #925
Category grades
Schools grade is shown separately in the Schools card above.
Census & demographics
- Census place
- New Braunfels, TX
- County
- Comal County · 206,262 people
- City population
- 144,962
- Metro
- San Antonio-New Braunfels, TX
- Population (ZIP)
- 104,009
- Household income
- $83,064
- Rent vs Own
- Severe rent burden
- 2912.0
Population outlook (Comal County) Hauer SSP2
- Today (2025)
- 175,637 people
- By 2030
- 199,911 · +13.8%
- By 2040
- 249,436 · +42.0%
- By 2050
- 299,430 · +70.5%
- By 2075
- 423,857 · +141.3%
- By 2100
- 512,048 · +191.5%
Race, ethnicity, and origin ACS 2023
- Neighborhood character
- Majority White (58%)
- Race & ethnicity
- White 58% Hispanic / Latino 37% Two or more races 19% Black 2%
- Hispanic origin (detail)
- Mexican 32%
- Common ancestry
- Romanian 2% Lithuanian 2% Slovak 2%
- Foreign-born
- 7% · Canada
- Languages at home
- 78% English-only · Spanish 20% German/W. Germanic 1%
Political lean MEDSL · Comal
- 2024 margin
- Solid R (+45.5) · D 26.8% · R 72.2%
- 2008→2024 swing
- +1.9pp toward D · 2008: -47.4pp · 2024: -45.5pp
- All cycles
- 2024: R+45.5 2020: R+42.7 2016: R+50.1 2012: R+54.1 2008: R+47.4
Not yet ingested
- Civics
- —
Market trends
- HPI YoY
- ▼ -190.61%
- Current HPI
- 173.7128
- Rent YoY
- ▼ -1.97%
- Metro
- San Antonio-New Braunfels, TX
- State GDP YoY
- ▲ 3.95%
- F500 in state
- 110
Industry mix (Fortune 500 HQ in TX)
| Industry | F500 HQs | Revenue |
|---|---|---|
| Energy | 16 | $1,198B |
|
||
| Technology | 5 | $198B |
|
||
| Engineering / Construction | 4 | $72B |
|
||
| Energy Services | 3 | $60B |
|
||
| Utilities | 3 | $41B |
|
||
| Healthcare | 2 | $330B |
|
||
Price history
+23223.1% since first listed6 events — show timeline
- 2026-06-10 Listed $379,000 LERA
- 2026-04-21 Rental Removed $1,425 SABOR
- 2026-03-03 Listed for Rent $1,425 SABOR
- 2023-12-20 Rental Removed $1,595 CTXMLS
- 2023-12-01 Price Changed $1,595 CTXMLS
- 2023-10-27 Listed for Rent $1,625 CTXMLS
Cash-flow waterfall
monthlySold comps — $/sqft
last 12 mo · ≤1 miLoading sold comps…