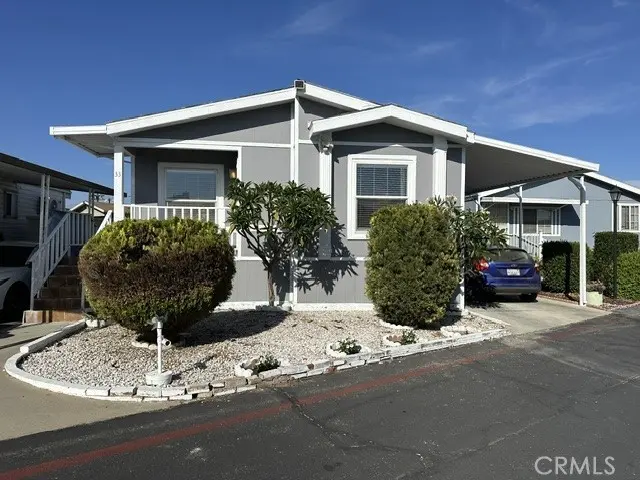
1765 Puente #33 · Baldwin Park, CA
Flood risk 7/10 · Major
- FEMA flood zone
- X (unshaded)
- Chance of flooding over 30 yrs
- 0.99%
- Est. flood insurance / yr
- $507 – $1,088
Fire risk 1/10 · Minimal
- Est. fire insurance / yr
- $659 – $1,223
Heat risk 6/10 · Moderate
- Hot days now (above 101°F)
- 7 days/yr
- Hot days in 30 yrs
- 20 days/yr
Wind risk 1/10 · Minimal
- Chance of severe wind over 30 yrs
- —
Air-quality risk 7/10 · Major
- Unhealthy air days now
- 12 days/yr
- Unhealthy air days in 30 yrs
- 14 days/yr
Risk factors via First Street. Map © Google.
Why this score? — see what drove the C+ grade
The composite is a weighted blend of 9 inputs, each scored 0–100. Each bar is that input's sub-score; the figure is the points it added to the 100-point composite (weight × sub-score).
- Cash flow +30.0/30.0
- 1% rule +10.0/10.0
- DSCR +10.0/10.0
- Livability +3.3/5.0
- Rent growth +2.5/5.0
- Schools +2.5/10.0
- Condition / age +2.5/5.0
- ARV discount +0.0/15.0
- Appreciation +0.0/10.0
$215,000
🖨 Deal sheet 📄 Offer letter ✓ Due diligence
Listing remarks MLS
Clean custom built 3 bedrooms and 2 full baths built in 2002. double wide unit. Central air and heat, front porch with open space living room, . Huge size kitchen and dining area. Has wood cabinets, laminate countertop . has it own laundry area. Bedroom with French doors with large oval tub . Has two car carport. The backyard has mature fruits trees. and added shed storage. Community amenities: Clubhouse, Pool, Billiard tables , community laundry, with pool area.
Key facts
- Long cement driveway
- Indoor laundry
- Community pool
Tags
Property features AI
Finance
- Other: Located within Fountain Blue Mobile Home Park; Directions: Exit Puente off the 10 freeway, head south and enter The Fountain Blue Mobile Home Park
- Financial info: Land lease: $1,400
- HOA & community: Part of an association with pool amenity; Community features: Urban
Exterior
- Parking: Located in the Fountain Blue mobile home park
- Utilities: Public sewer; Other water source
- Home design: Single-story mobile home; Model 7041; Mobile home remains on site
- Construction: Year built per assessor; Double body type (multi-section mobile)
- Exterior features: In-ground, fenced community pool (association); Located on a cul-de-sac; Level/flat lot
Interior
- Bathrooms: One full bathroom; One 3/4 bathroom
- Interior features: Entry on the main level
- Laundry & utility: Inside laundry in a dedicated room
Neighborhood map
What this means for you Summary
Snapshot
- This is a 3-bed/2.0-bath manufactured listed at $215k.
Deal economics
- At list price, monthly cash flow is $1k ($13k/yr) — positive.
- The deal already cash-flows at list — no discount required.
- Meets the 1% rule at list price ($3k rent vs $215k).
- Cap rate 12.9% vs local median 2.8% in Baldwin Park — top-decile yield for the area; either an underpriced asset or a hidden risk that comps aren't pricing in. Stress-test before assuming the spread holds.
Location & tenants
- Location reads 66/100 on livability (#357 in CA) — a middle-class / working-renter tenant base. Strengths: commute A+, employment B+; Watch: crime C-, schools D-, cost of living F.
- Baldwin Park Unified (suburban): math 20% / reading 37% proficiency, ranked #359 of 517 in CA (top 69%) — low school quality limits family demand, transient renter base, plan for 1-2y turnover; 74% free/reduced lunch — lower-income household profile, screen leases tightly.
- Market conditions: 53 active listings in the ZIP; 21 comparable units currently listed for rent nearby; rentals at typical pace (median 24d on market — plan ~3-4 weeks tenant-placement turnaround); solid renter incomes; 19,697 units permitted in Los Angeles County in 2024 (9,426 in 5+ unit buildings).
- At $3,378/mo this rent would consume 50% of the median local household income ($81k/yr) (locally 1946% of renters already pay >50% of income on rent) — very limited rent-growth headroom before tenants either downsize or default.
Forward outlook
- Local home prices are declining (-3.0%/yr); year-one equity from $1k of loan paydown is wiped out by about $6k of value loss. Plan a longer hold.
- Los Angeles County population projected at +9% by 2050 — modest demand growth; plan on rents tracking national, not racing it.
- At projected returns (-3.0% appreciation + 3.0% rent growth), your $60k cash investment doubles in ~6 years — after that, you're playing with house money.
Negotiation context
- Only 6 days on market — expect competitive offers; lowballing is unlikely to land.
- 5 sale attempts since 7y ago with the ask held roughly flat each time — persistent listings suggest the price (not the market) is what's stuck; bring a comps-based counter.
- Current owner paid $155k; 39% above their basis — modest negotiation headroom, anchor on the comps not their cost.
Risks & watch-outs
- Watch-outs: flood insurance adds $66/mo.
- Climate carrying-cost: major flood risk; extreme-heat days projected 7→20/yr by 2055 (HVAC capex compounding) — expect insurance premiums to compound above CPI over the hold.
Questions for the listing agent
- What's the actual annual flood-insurance premium (NFIP or private), and is the property in a SFHA with mandatory coverage?
- Is there a deadline driving the sale (1031 exchange, divorce, estate, relocation)? That informs how much negotiation room exists.
- Schools are D-rated, which usually means shorter tenancies and higher turnover. Who's the typical renter profile here, and what's been the actual vacancy rate?
- What's the average days-on-market for RENTAL listings here right now (not sales)? A rising rental-DOM trend means longer vacancies and softer asking-rent achievability than the comps imply.
- What's the recent tenant-quality profile in this submarket — average credit score on applications, eviction rate, late-payment / NSF rate, and stable-employment percentage? A property-management company in the area should have these aggregated.
- How much new for-sale + rental construction is in the pipeline within 1–3 miles? Heavy new supply typically softens prices + rents 12–24 months out; constrained supply supports both.
Investment metrics
- 1% rule
- 1.57% ✓
- Cap rate
- 12.89%
- Cash-on-cash
- 23.58%
- DSCR
- 2.05
- GRM
- 5.3
CMA / ARV
- ARV (on-the-fly)
- $156,240
- Comps found
- 2
Show comp detail 2 sales within ~0.75 mi
| Address | Dist | Beds/Ba | Sqft | Sold | Price | $/sf | Match |
|---|---|---|---|---|---|---|---|
| 1661 Puente Ave #88 | 0.12mi | 3/3.0 | 1,368 (+9%) | 21mo | $170,000 | $124 | 59 |
| 1661 Puente Ave #88 | 0.15mi | 3/3.0 | 1,368 (+9%) | 21mo | $170,000 | $124 | 57 |
Match score weights: distance 35% · size 25% · config 20% · recency 20%. Top-matched comps best support the ARV.
Projected returns pro-forma
-3.0% appreciation · 3.0% rent growth · sell at horizon
- IRR
- 15.1%
- Equity multiple
- 1.60×
- Total profit
- $36,352
- Equity at exit
- $32,057
- IRR
- 23.8%
- Equity multiple
- 3.05×
- Total profit
- $123,579
- Equity at exit
- $18,589
Cash invested: $60,200 (down + closing). Projections, not guarantees.
Landlord ↔ Tenant lean methodology
- Overall (STATE)
- 18 Strongly Tenant-Friendly
- State California
- 18 Strongly Tenant-Friendly · D+13
- County
- — inherits STATE
- City
- — inherits STATE
ZIP-level market 91706
- Active inventory
- 53
- Price-to-rent
- 5.3×
Monthly cashflow live
- Estimated rent
- $3,378 high interval (Pro) →
- Mortgage (P&I)
- −$1,127
- Tax est. 1.5%
- −$269 /mo · $3,225/yr
- Insurance
- −$90
- Flood insurance flood zone
- −$66 /mo · $798/yr
- HOA
- −$0
- Vacancy / Maint / Mgmt
- −$709
- Net cashflow
- $1,116
Break-even live
UW: 25.0% down · 7.5% · 30yr · 1.5% tax · 5.0% vac · 8.0% maint · 8.0% mgmt
Financing live
Cash to close
- Down payment
- $53,750
- Closing costs
- $6,450
- Reserves months
- —
- Total cash needed
- —
Loan-product check · same deal, 3 products live
Conventional
25% down · 7.5% · 30yr
- Down + closing
- —
- Monthly P&I
- —
- Monthly cashflow
- —
- DSCR
- —
- Eligible?
- —
Personal DTI + credit; lowest rate.
DSCR
20% down · 8.5% · 30yr
- Down + closing
- —
- Monthly P&I
- —
- Monthly cashflow
- —
- DSCR
- —
- Eligible?
- —
No personal income docs; deal must DSCR.
Hard money
10% down · 12.0% · 12mo
- Down + closing
- —
- Monthly P&I
- —
- Monthly cashflow
- —
- DSCR
- —
- Eligible?
- —
Short-term bridge; refi at stabilization.
Rent comps 21 comps
| Address | Beds | Baths | Sqft | Rent | $/sqft | DOM | Units | Dist |
|---|---|---|---|---|---|---|---|---|
| 3234 Vineland Ave Unit A Baldwin Park, CA | 3.0 | 2.0 | 1200 | $3,300 | $2.75 | 24d | 1 | 0.32mi |
| 1435 S Ardilla Ave West Covina, CA | 3.0 | 2.0 | 1507 | $3,500 | $2.32 | 24d | 1 | 0.33mi |
| 3245 Stichman Ave Baldwin Park, CA | 3.0 | 2.0 | 1304 | $3,250 | $2.49 | 43d | 1 | 0.38mi |
| 2310 W Ituni St West Covina, CA | 3.0 | 1.5 | 1201 | $3,800 | $3.16 | 18d | 1 | 0.45mi |
| 13725 Kenmore Ave Baldwin Park, CA | 3.0 | 2.0 | 1200 | $2,600 | $2.17 | 43d | 1 | 0.84mi |
| 1043 Stichman Ave La Puente, CA | 3.0 | 2.0 | 1410 | $3,500 | $2.48 | 5d | 1 | 0.84mi |
| 1024 N Orange Blossom Ave La Puente, CA | 3.0 | 2.0 | 1170 | $3,200 | $2.74 | 19d | 1 | 0.95mi |
| 3831 1/4 Bresee Ave Baldwin Park, CA | 4.0 | 2.5 | 1591 | $3,300 | $2.07 | 43d | 1 | 0.96mi |
| 14724 Clydewood St Baldwin Park, CA | 3.0 | 2.0 | 1254 | $3,375 | $2.69 | 43d | 1 | 1.01mi |
| 1501 W Delhaven St West Covina, CA | 3.0 | 2.0 | 1080 | $3,000 | $2.78 | 7d | 1 | 1.11mi |
| 13690 Ramona Pkwy Baldwin Park, CA | 3.0 | 2.5 | 1504 | $3,200 | $2.13 | 43d | 1 | 1.15mi |
| 13268 Ramona Blvd Unit B Baldwin Park, CA | 3.0 | 2.5 | 1546 | $3,600 | $2.33 | 43d | 1 | 1.29mi |
| 14536 Jeremie St Baldwin Park, CA | 3.0 | 2.0 | 1129 | $3,600 | $3.19 | 1d | 1 | 1.29mi |
| 14536 Jeremie St Baldwin Park, CA | 3.0 | 2.0 | 1129 | $3,350 | $2.97 | 24d | 1 | 1.29mi |
| 14536 Jeremie St Unit A Baldwin Park, CA | 3.0 | 2.0 | 1129 | $3,050 | $2.70 | 24d | 1 | 1.29mi |
| 1225 W Glenmere St West Covina, CA | 3.0 | 2.0 | 1706 | $3,300 | $1.93 | 1d | 1 | 1.32mi |
| 1231 W Francisquito Ave Unit 140 West Covina, CA | 2.0 | 2.0 | 1003 | $2,785 | $2.78 | 24d | 1 | 1.33mi |
| 1231 W Francisquito Ave Unit 084 West Covina, CA | 2.0 | 2.0 | 1003 | $2,485 | $2.48 | 24d | 1 | 1.33mi |
| 1812 San Diego St West Covina, CA | 2.0 | 2.5 | 1195 | $2,900 | $2.43 | 43d | 1 | 1.39mi |
| 851 S Sunset Ave West Covina, CA | 2.0 | 1.0 | 923 | $2,686 | $2.91 | 1d | 6 | 1.40mi |
| 1113 W Ituni St West Covina, CA | 3.0 | 2.0 | 1497 | $3,900 | $2.61 | 21d | 1 | 1.47mi |
Listing history 6 events
-
2026-06-18days on market $215,000 Active 6 DOM
-
2026-06-17days on market $215,000 Active 5 DOM
-
2026-06-16days on market $215,000 Active 4 DOM
-
2026-06-15days on market $215,000 Active 3 DOM
-
2026-06-13remarks 699-char remark
-
2026-06-13$215,000 Active 1 DOM
ⓘ Source: listings_history table (triggers on properties + properties_extension) + one-shot
backfill from property_details.listing_events for pre-trigger history.
Climate risk First Street
- Flood 7/10 Severe FEMA zone X (unshaded) · 99% chance over 30 yrs
- Wildfire 1/10 Low
- Heat 6/10 Major 7 d/yr ≥101°F today · 20 d/yr by 30 yrs out
- Wind 1/10 Low
- Air quality 7/10 Severe 12 unhealthy d/yr today · 14 by 30 yrs out
Nearby sold comps map
Loading sold comps map…
Walkable amenities ~0.75 mi
Loading nearby amenities…
Taxation est. · year 1
- Rental income
- $40,536
- − Mortgage interest
- −$12,043
- − Property taxes
- −$3,225
- − Insurance
- −$1,872
- − Repairs & maintenance
- −$3,243
- − Management
- −$3,243
- − Depreciation
- −$6,255
- Taxable income
- $10,655
- Est. tax owed @ 24.0%
- −$2,557
- After-tax cash flow
- $10,839/yr
For passive investors: Depreciation is non-cash, so a rental often shows a tax loss while cash-flowing — sheltering income. Rental losses are passive: they offset passive income freely, and up to $25,000/yr can offset ordinary (W-2) income if you actively participate and your MAGI is under $100k (phasing out to $0 by $150k); unused losses carry forward. On sale, claimed depreciation is recaptured at up to 25%, and gains may owe capital-gains tax (a 1031 exchange can defer both). Figures are a year-1 estimate at your 24.0% rate — not tax advice; consult a CPA.
Schools (NCES district)
- District
- Baldwin Park Unified
- NCES district ID
- 0603690
- Math proficiency
- 20% ▼ -9.00%
- Reading proficiency
- 37% ▼ -7.00%
- Median HH income
- $53,156
- Composite
- 25.2/100
- National rank
- #7510
- State rank
- #359 of 517 in CA
Livability — Baldwin Park
- Score
- 66/100
- State rank
- #357
- US rank
- #12192
Category grades
Schools grade is shown separately in the Schools card above.
Census & demographics
- Census place
- Baldwin Park, CA
- County
- Los Angeles County · 9,444,647 people
- City population
- 71,082
- Metro
- Los Angeles-Long Beach-Anaheim, CA
- Population (ZIP)
- 71,082
- Household income
- $81,122
- Rent vs Own
- Severe rent burden
- 1946.0
Population outlook (Los Angeles County) Hauer SSP2
- Today (2025)
- 10,940,515 people
- By 2030
- 11,256,481 · +2.9%
- By 2040
- 11,729,929 · +7.2%
- By 2050
- 11,948,407 · +9.2%
- By 2075
- 11,818,114 · +8.0%
- By 2100
- 10,842,928 · -0.9%
Race, ethnicity, and origin ACS 2023
- Neighborhood character
- Predominantly Hispanic (73%)
- Race & ethnicity
- Hispanic / Latino 73% Two or more races 24% Asian 22% Native American 3% White 3%
- Hispanic origin (detail)
- Mexican 63%
- Foreign-born
- 44% · Canada, China, Vietnam
- Languages at home
- 21% English-only · Spanish 60% Chinese 10% Vietnamese 4%
Political lean MEDSL · Los Angeles
- 2024 margin
- Solid D (+32.9) · D 64.8% · R 31.9% · Other 3.3%
- 2008→2024 swing
- -7.4pp toward R · 2008: 40.4pp · 2024: 32.9pp
- All cycles
- 2024: D+32.9 2020: D+44.2 2016: D+48.0 2012: D+40.0 2008: D+40.4
Not yet ingested
- Civics
- —
Market trends
- HPI YoY
- ▼ -1031.00%
- Current HPI
- 458.8227
- Rent YoY
- —
- Metro
- Los Angeles-Long Beach-Anaheim, CA
- State GDP YoY
- ▲ 3.21%
- F500 in state
- 116
Industry mix (Fortune 500 HQ in CA)
| Industry | F500 HQs | Revenue |
|---|---|---|
| Technology | 27 | $1,492B |
|
||
| Financial Services | 3 | $174B |
|
||
| Retail | 3 | $44B |
|
||
| Insurance | 3 | $26B |
|
||
| Media / Entertainment | 2 | $115B |
|
||
| Pharmaceuticals / Biotech | 2 | $62B |
|
||
Price history
+139.2% since first listed12 events — show timeline
- 2026-06-12 Listed $215,000 CRMLS
- 2025-09-25 Listing Removed — CRMLS
- 2025-04-28 Listed $160,000 CRMLS
- 2025-04-23 Coming Soon — CRMLS
- 2023-05-12 Sold (MLS) $155,000 CRMLS
- 2023-05-08 Pending — CRMLS
- 2023-05-01 Listed $160,000 CRMLS
- 2022-03-08 Pending — CRMLS
- 2022-03-08 Listing Removed — CRMLS
- 2022-03-02 Listed $125,000 CRMLS
- 2020-01-15 Listing Removed — CRMLS
- 2019-09-14 Listed $89,900 CRMLS
Property tax history
+4.5%/yrLatest (2025): $33,787 · +4.9% YoY. Source: county tax records.
Cash-flow waterfall
monthlySold comps — $/sqft
last 12 mo · ≤1 miLoading sold comps…