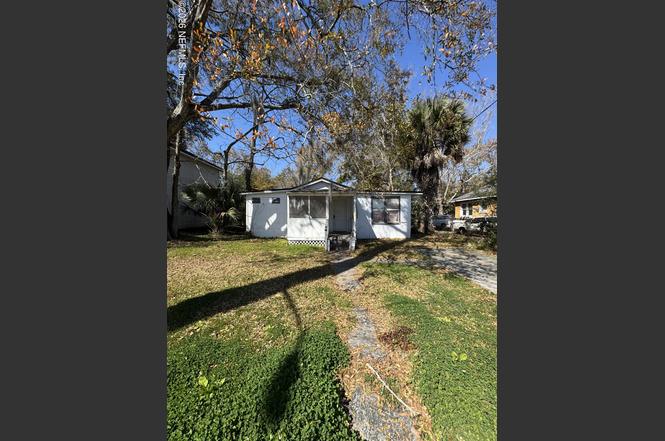
1767 Broadway Ave · Jacksonville, FL
Flood risk 1/10 · Minimal
- FEMA flood zone
- X (unshaded)
- Chance of flooding over 30 yrs
- 0.0%
- Est. flood insurance / yr
- $507 – $1,088
Fire risk 1/10 · Minimal
- Est. fire insurance / yr
- $947 – $1,759
Heat risk 9/10 · Severe
- Hot days now (above 107°F)
- 7 days/yr
- Hot days in 30 yrs
- 20 days/yr
Wind risk 9/10 · Severe
- Chance of severe wind over 30 yrs
- 99.0%
Air-quality risk 5/10 · Moderate
- Unhealthy air days now
- 7 days/yr
- Unhealthy air days in 30 yrs
- 7 days/yr
Risk factors via First Street. Map © Google.
Why this score? — see what drove the B+ grade
The composite is a weighted blend of 9 inputs, each scored 0–100. Each bar is that input's sub-score; the figure is the points it added to the 100-point composite (weight × sub-score).
- Cash flow +30.0/30.0
- ARV discount +15.0/15.0
- 1% rule +10.0/10.0
- DSCR +10.0/10.0
- Livability +4.2/5.0
- Schools +3.9/10.0
- Rent growth +3.0/5.0
- Condition / age +2.5/5.0
- Appreciation +0.0/10.0
$72,500
🖨 Deal sheet (PDF) 📄 Offer letter ✓ Due diligence
Listing remarks MLS
Excellent Fixer Upper with a NEW ROOF ready to be made into an excellent rental property. Home will be sold AS-IS, make your offer today!
Key facts
- 6,098 sq ft lot
- Garage
- Built 1947
Tags
Property features AI
Finance
- HOA & community: Not a senior community
Exterior
- Parking: Attached garage
- Utilities: Public sewer; Sewer available; Water available
- Home design: Single-family residence; Property faces southeast; Entry level: 1; Attached property
- Construction: Wood siding construction
- Exterior features: Other detached structure on property; Lot is approximately 0.14 acres
Interior
- Kitchen: Electric oven; Refrigerator
- Bedrooms: 3 bedrooms
- Bathrooms: 1 full bathroom
- Heating & cooling: Wall/window cooling units
- Interior features: Electric oven; Refrigerator
Neighborhood map
What this means for you Summary
Snapshot
- This is a 3-bed/1.0-bath single-family listed at $72k.
Deal economics
- At list price, monthly cash flow is $464 ($6k/yr) — positive.
- The deal already cash-flows at list — no discount required.
- Meets the 1% rule at list price ($1k rent vs $72k).
- Recommended offer: $66k (9.0% below list) — sets the bar for market timing.
- Cap rate 14.0% vs local median 3.9% in Jacksonville — top-decile yield for the area; either an underpriced asset or a hidden risk that comps aren't pricing in. Stress-test before assuming the spread holds.
Location & tenants
- Location reads 83/100 on livability (#50 in FL, #911 nationally) — a professional / high-income tenant draw. Strengths: amenities A+, commute A+, housing A+.
- Duval (urban): math 46% / reading 45% proficiency, ranked #48 of 73 in FL (top 66%) — families likely to look elsewhere, expect single-tenant / working-renter base with shorter leases.
- Zoned schools: Smart Pope Livingston Elementary (428 students, 91% FRL); Joseph Stilwell Middle School (math 31% / reading 33%, grade F, #448 of 571 statewide, top 79%, 612 students, 68% FRL); William M. Raines High School (math 14% / reading 13%, grade F, #616 of 667 statewide, top 92%, 1,217 students, 78% FRL) — zoned schools average 79% FRL vs 49% district-wide (30 pts higher); higher-poverty schools than district average — tighter screening recommended.
- Zoned-school proficiency averages 23% at this address vs 46% district-wide (-23 pts) — the specific schools serving this property underperform the Duval average; the district grade overstates school quality for this exact location.
- Market conditions: Rents rising (+1.8%/yr); 399 active listings in the ZIP; 40 comparable units currently listed for rent nearby; rentals at typical pace (median 26d on market — plan ~3-4 weeks tenant-placement turnaround); lower-income renter base — watch delinquency; 6,503 units permitted in Duval County in 2024 (1,131 in 5+ unit buildings).
Forward outlook
- Local home prices are declining (-3.0%/yr); year-one equity from $501 of loan paydown is wiped out by about $2k of value loss. Plan a longer hold.
- Duval County population projected at +19% by 2050 — long-run rental-demand tailwind backs the buy-and-hold thesis.
- At projected returns (-3.0% appreciation + 1.8% rent growth), your $20k cash investment doubles in ~5 years — after that, you're playing with house money.
Negotiation context
- It's been on market 120 days — a 9% lower offer ($66k) is reasonable based on typical stale-listing flexibility.
- 6 sale attempts since 5y ago; this cycle's ask has dropped $8k (9%) from the opening price — seller is motivated, your offer sets the floor, not the list.
Risks & watch-outs
- Watch-outs: built in 1947 — expect roof / HVAC / electrical / plumbing capex.
- Climate carrying-cost: severe wind risk, 99% chance of damaging wind over 30y; extreme-heat days projected 7→20/yr by 2055 (HVAC capex compounding) — expect insurance premiums to compound above CPI over the hold.
Questions for the listing agent
- It's been on market 120 days. Have you received any prior offers? Is the seller open to a 9% concession, seller financing, or rate buy-down credit?
- Built in 1947 — when were the roof, HVAC, electrical panel, plumbing, and water heater last replaced?
- Why hasn't it sold? Are there any deal-killer items the seller is aware of (foundation, flood, title, zoning, code violations)?
- Is there a deadline driving the sale (1031 exchange, divorce, estate, relocation)? That informs how much negotiation room exists.
- Schools are B-rated — typically a magnet for longer-tenancy family renters. What's the average tenant stay here, and is there a school-zone premium baked into asking?
- What's the average days-on-market for RENTAL listings here right now (not sales)? A rising rental-DOM trend means longer vacancies and softer asking-rent achievability than the comps imply.
- What's the recent tenant-quality profile in this submarket — average credit score on applications, eviction rate, late-payment / NSF rate, and stable-employment percentage? A property-management company in the area should have these aggregated.
- How much new for-sale + rental construction is in the pipeline within 1–3 miles? Heavy new supply typically softens prices + rents 12–24 months out; constrained supply supports both.
Investment metrics
- 1% rule
- 1.79% ✓
- Cap rate
- 13.97%
- Cash-on-cash
- 27.43%
- DSCR
- 2.22
- GRM
- 4.7
CMA / ARV
- ARV (on-the-fly)
- $90,720
- Comps found
- 12
Show comp detail 12 sales within ~0.75 mi
| Address | Dist | Beds/Ba | Sqft | Sold | Price | $/sf | Match |
|---|---|---|---|---|---|---|---|
| 1116 Fairfax St | 0.20mi | 3/1.0 | 1,000 (-1%) | 2mo | $173,017 | $173 | 88 |
| 1831 Broadway Ave | 0.17mi | 3/2.0 | 1,050 (+4%) | 3mo | $95,000 | $90 | 79 |
| 2067 Woodside St | 0.44mi | 3/1.0 | 1,013 (+0%) | 1mo | $34,900 | $34 | 78 |
| 1776 Starr St | 0.49mi | 3/1.5 | 1,008 (0%) | 5mo | $60,000 | $60 | 71 |
| 1725 Seminary St | 0.60mi | 3/1.0 | 996 (-1%) | 3mo | $88,000 | $88 | 68 |
| 1550 W 2nd St | 0.45mi | 3/2.0 | 972 (-4%) | 2mo | $123,500 | $127 | 67 |
| 2202 W 1st St | 0.68mi | 3/1.0 | 988 (-2%) | 2mo | $56,900 | $58 | 63 |
| 2081 Baldwin St | 0.46mi | 3/1.0 | 915 (-9%) | 2mo | $47,000 | $51 | 62 |
| 1438 State St W | 0.55mi | 3/2.0 | 1,075 (+7%) | 5mo | $135,000 | $126 | 56 |
| 2108 Yulee St | 0.49mi | 3/1.0 | 873 (-13%) | 0mo | $117,000 | $134 | 54 |
| 2231 Placeda St | 0.71mi | 2/1.0 (-1) | 1,081 (+7%) | 2mo | $26,000 | $24 | 48 |
| 1314 Rushing St | 0.52mi | 3/2.0 | 1,147 (+14%) | 4mo | $183,000 | $160 | 45 |
Match score weights: distance 35% · size 25% · config 20% · recency 20%. Top-matched comps best support the ARV.
Projected returns pro-forma
-3.0% appreciation · 1.81% rent growth · sell at horizon
- IRR
- 20.1%
- Equity multiple
- 1.80×
- Total profit
- $16,329
- Equity at exit
- $10,810
- IRR
- 27.5%
- Equity multiple
- 3.28×
- Total profit
- $46,355
- Equity at exit
- $6,268
Cash invested: $20,300 (down + closing). Projections, not guarantees.
Landlord ↔ Tenant lean methodology
- Overall (STATE)
- 87 Strongly Landlord-Friendly
- State Florida
- 87 Strongly Landlord-Friendly · R+3
- County
- — inherits STATE
- City
- — inherits STATE
ZIP-level market 32209
- Home prices YoY
- -22.1%
- Rents YoY
- 1.8%
- Active inventory
- 399
- Price-to-rent
- 4.7×
Monthly cashflow live
- Estimated rent
- $1,298 high interval (Pro) →
- Mortgage (P&I)
- −$380
- Tax from tax record
- −$151 /mo · $1,812/yr
- Insurance
- −$30
- HOA
- −$0
- Vacancy / Maint / Mgmt
- −$273
- Net cashflow
- $464
Break-even live
Sensitivity live
| Price | -10% $505 | -5% $485 | +0% $464 | +5% $444 | +10% $423 |
|---|---|---|---|---|---|
| Rent | -10% $362 | -5% $413 | +0% $464 | +5% $515 | +10% $567 |
| Rate | -1.0pp $501 | -0.5pp $483 | base $464 | +0.5pp $445 | +1.0pp $426 |
UW: 25.0% down · 7.5% · 30yr · 1.5% tax · 5.0% vac · 8.0% maint · 8.0% mgmt
Financing live
Cash to close
- Down payment
- $18,125
- Closing costs
- $2,175
- Reserves months
- —
- Total cash needed
- —
Loan-product check · same deal, 3 products live
Conventional
25% down · 7.5% · 30yr
- Down + closing
- —
- Monthly P&I
- —
- Monthly cashflow
- —
- DSCR
- —
- Eligible?
- —
Personal DTI + credit; lowest rate.
DSCR
20% down · 8.5% · 30yr
- Down + closing
- —
- Monthly P&I
- —
- Monthly cashflow
- —
- DSCR
- —
- Eligible?
- —
No personal income docs; deal must DSCR.
Hard money
10% down · 12.0% · 12mo
- Down + closing
- —
- Monthly P&I
- —
- Monthly cashflow
- —
- DSCR
- —
- Eligible?
- —
Short-term bridge; refi at stabilization.
Rent comps 40 comps
| Address | Beds | Baths | Sqft | Rent | $/sqft | DOM | Units | Dist |
|---|---|---|---|---|---|---|---|---|
| 1751 Broadway Ave Jacksonville, FL | 2.0 | 1.0 | 1000 | $1,525 | $1.52 | 6d | 1 | 0.05mi |
| 1657 Union St W Unit 1 Jacksonville, FL | 2.0 | 1.0 | 700 | $1,050 | $1.50 | 3d | 1 | 0.23mi |
| 1923 Broadway Ave Jacksonville, FL | 3.0 | 2.0 | 1230 | $1,421 | $1.16 | 25d | 1 | 0.27mi |
| 1710 W 2nd St Unit A Jacksonville, FL | 2.0 | 1.0 | 939 | $800 | $0.85 | 25d | 1 | 0.30mi |
| 1607 Logan St Jacksonville, FL | 4.0 | 2.0 | 1232 | $1,800 | $1.46 | 25d | 1 | 0.30mi |
| 1545 Union St W Jacksonville, FL | 3.0 | 2.0 | 1253 | $1,400 | $1.12 | 4d | 1 | 0.33mi |
| 1979 Yulee St Jacksonville, FL | 3.0 | 2.0 | 1050 | $1,500 | $1.43 | 25d | 1 | 0.33mi |
| 1783 W 3rd St Jacksonville, FL | 3.0 | 1.0 | 816 | $650 | $0.80 | 25d | 1 | 0.33mi |
| 1539 Union St W Jacksonville, FL | 3.0 | 1.5 | 1000 | $1,144 | $1.14 | 15d | 1 | 0.34mi |
| 1319 Woods St Jacksonville, FL | 3.0 | 2.0 | 1103 | $1,221 | $1.11 | 25d | 1 | 0.35mi |
| 1911 W 3rd St Jacksonville, FL | 3.0 | 1.0 | 912 | $1,050 | $1.15 | 6d | 1 | 0.36mi |
| 2012 Baldwin St Jacksonville, FL | 3.0 | 2.0 | 1232 | $1,445 | $1.17 | 25d | 1 | 0.37mi |
| 844 Tyler St Unit 1 Jacksonville, FL | 2.0 | 1.0 | 800 | $900 | $1.12 | 9d | 1 | 0.39mi |
| 1788 W 5th St Jacksonville, FL | 3.0 | 2.0 | 948 | $1,295 | $1.37 | 25d | 1 | 0.42mi |
| 1470 Windle St Jacksonville, FL | 3.0 | 2.0 | 1170 | $1,425 | $1.22 | 16d | 1 | 0.45mi |
| 1640 W 4th St Unit 1 Jacksonville, FL | 4.0 | 2.0 | 1119 | $1,675 | $1.50 | 21d | 1 | 0.46mi |
| 1866 W 6th St Jacksonville, FL | 3.0 | 1.0 | 1064 | $1,120 | $1.05 | 5d | 1 | 0.46mi |
| 1448 Union St W Jacksonville, FL | 3.0 | 1.0 | 958 | $1,200 | $1.25 | 25d | 1 | 0.48mi |
| 1934 W 6th St Jacksonville, FL | 3.0 | 1.0 | 948 | $1,125 | $1.19 | 25d | 1 | 0.50mi |
| 1995 W 4th St Jacksonville, FL | 4.0 | 1.5 | 1213 | $1,375 | $1.13 | 25d | 1 | 0.51mi |
| 2128 Woodside St Jacksonville, FL | 2.0 | 1.0 | 776 | $895 | $1.15 | 25d | 1 | 0.53mi |
| 1425 Morgan St Jacksonville, FL | 2.0 | 1.0 | 850 | $650 | $0.76 | 5d | 1 | 0.54mi |
| 2011 W 5th St Jacksonville, FL | 3.0 | 1.0 | 988 | $1,150 | $1.16 | 25d | 1 | 0.58mi |
| 1437 Prince St Unit 1437 Jacksonville, FL | 2.0 | 1.0 | 700 | $1,120 | $1.60 | 25d | 1 | 0.63mi |
| 1145 N Canal St Jacksonville, FL | 2.0 | 2.0 | 1184 | $1,396 | $1.18 | 4d | 1 | 0.63mi |
| 2154 Placeda St Jacksonville, FL | 4.0 | 1.5 | 1124 | $1,500 | $1.33 | 23d | 1 | 0.64mi |
| 2185 Kingston St Jacksonville, FL | 3.0 | 2.0 | 1230 | $1,381 | $1.12 | 25d | 1 | 0.66mi |
| 1376 Prince St Jacksonville, FL | 2.0 | 1.0 | 800 | $1,050 | $1.31 | 9d | 1 | 0.67mi |
| 1478 W 5th St Jacksonville, FL | 3.0 | 1.0 | 960 | $1,225 | $1.28 | 25d | 1 | 0.68mi |
| 1478 W 5th St Jacksonville, FL | 3.0 | 1.0 | 960 | $1,225 | $1.28 | 6d | 1 | 0.68mi |
| 1721 Campus St Jacksonville, FL | 3.0 | 2.0 | 909 | $1,400 | $1.54 | 25d | 1 | 0.68mi |
| 1358 Prince St Jacksonville, FL | 3.0 | 3.5 | 1044 | $1,350 | $1.29 | 23d | 1 | 0.69mi |
| 1358 Prince St Jacksonville, FL | 3.0 | 2.5 | 1044 | $1,350 | $1.29 | 25d | 1 | 0.69mi |
| 1733 McMillan St Jacksonville, FL | 3.0 | 2.0 | 1211 | $1,265 | $1.04 | 6d | 1 | 0.69mi |
| 1460 W 5th St Unit 1 Jacksonville, FL | 2.0 | 1.0 | 700 | $850 | $1.21 | 13d | 1 | 0.70mi |
| 1776 Spires Ave Unit 2 Jacksonville, FL | 2.0 | 1.0 | 800 | $1,125 | $1.41 | 6d | 1 | 0.73mi |
| 1934 Ella St Jacksonville, FL | 3.0 | 1.0 | 1045 | $1,095 | $1.05 | 22d | 1 | 0.73mi |
| 1570 Mc Conihe St Unit B Jacksonville, FL | 2.0 | 1.0 | 714 | $875 | $1.23 | 25d | 1 | 0.74mi |
| 1537 7th St W Unit B Jacksonville, FL | 3.0 | 1.0 | 950 | $1,050 | $1.11 | 25d | 1 | 0.74mi |
| 1537 W 7th St Jacksonville, FL | 3.0 | 1.0 | 950 | $1,050 | $1.11 | 9d | 1 | 0.75mi |
Listing history 28 events
-
2026-06-21days on market $72,500 Active 120 DOM
-
2026-06-18days on market $72,500 Active 117 DOM
-
2026-06-17days on market $72,500 Active 116 DOM
-
2026-06-16days on market $72,500 Active 115 DOM
-
2026-06-15days on market $72,500 Active 114 DOM
-
2026-06-10pricedays on market $72,500 Active 108 DOM
-
2026-06-08days on market $75,000 Active 107 DOM
-
2026-06-07days on market $75,000 Active 106 DOM
-
2026-06-03days on market $75,000 Active 102 DOM
-
2026-06-02days on market $75,000 Active 101 DOM
-
2026-06-01days on market $75,000 Active 100 DOM
-
2026-05-31days on market $75,000 Active 99 DOM
-
2026-05-23status Active
-
2026-05-22historical
-
2026-05-09status Active
-
2026-04-30historical Active Under Contract
-
2026-04-08price $75,000
-
2026-03-23price $78,000
-
2026-03-06price $79,900
-
2026-02-20$80,000 Active
-
2021-08-31historical 137-char remark
Show marketing remark (137 chars)
Excellent Fixer Upper with a NEW ROOF ready to be made into an excellent rental property. Home will be sold AS-IS, make your offer today!
-
2021-08-20status Active 137-char remark
Show marketing remark (137 chars)
Excellent Fixer Upper with a NEW ROOF ready to be made into an excellent rental property. Home will be sold AS-IS, make your offer today!
-
2021-07-19status Pending 137-char remark
Show marketing remark (137 chars)
Excellent Fixer Upper with a NEW ROOF ready to be made into an excellent rental property. Home will be sold AS-IS, make your offer today!
-
2021-06-30status Active 137-char remark
Show marketing remark (137 chars)
Excellent Fixer Upper with a NEW ROOF ready to be made into an excellent rental property. Home will be sold AS-IS, make your offer today!
-
2021-06-26historical 137-char remark
Show marketing remark (137 chars)
Excellent Fixer Upper with a NEW ROOF ready to be made into an excellent rental property. Home will be sold AS-IS, make your offer today!
-
2021-06-16price $54,000 137-char remark
Show marketing remark (137 chars)
Excellent Fixer Upper with a NEW ROOF ready to be made into an excellent rental property. Home will be sold AS-IS, make your offer today!
-
2021-05-28price $59,000 137-char remark
Show marketing remark (137 chars)
Excellent Fixer Upper with a NEW ROOF ready to be made into an excellent rental property. Home will be sold AS-IS, make your offer today!
-
2021-05-25$55,000 Active 137-char remark
Show marketing remark (137 chars)
Excellent Fixer Upper with a NEW ROOF ready to be made into an excellent rental property. Home will be sold AS-IS, make your offer today!
ⓘ Source: listings_history table (triggers on properties + properties_extension) + one-shot
backfill from property_details.listing_events for pre-trigger history.
Tax reassessment forecast FL · Resets to sale price
- Current annual tax
- $1,812 · $151/mo
- Projected year-2 tax
- $1,812 · $151/mo
- Expected delta
- $0/yr ($0/mo · 0.0%)
ⓘ Screening estimate from a state-policy table — verify with the county assessor before closing.
Climate risk First Street
- Flood 1/10 Low FEMA zone X (unshaded) · 0% chance over 30 yrs
- Wildfire 1/10 Low
- Heat 9/10 Extreme 7 d/yr ≥107°F today · 20 d/yr by 30 yrs out
- Wind 9/10 Extreme 99% chance of damaging wind over 30 yrs
- Air quality 5/10 Major 7 unhealthy d/yr today · 7 by 30 yrs out
Nearby sold comps map
Loading sold comps map…
Walkable amenities ~0.75 mi
Loading nearby amenities…
Taxation est. · year 1
- Rental income
- $15,577
- − Mortgage interest
- −$4,061
- − Property taxes
- −$1,812
- − Insurance
- −$362
- − Repairs & maintenance
- −$1,246
- − Management
- −$1,246
- − Depreciation
- −$2,109
- Taxable income
- $4,740
- Est. tax owed @ 24.0%
- −$1,138
- After-tax cash flow
- $4,431/yr
For passive investors: Depreciation is non-cash, so a rental often shows a tax loss while cash-flowing — sheltering income. Rental losses are passive: they offset passive income freely, and up to $25,000/yr can offset ordinary (W-2) income if you actively participate and your MAGI is under $100k (phasing out to $0 by $150k); unused losses carry forward. On sale, claimed depreciation is recaptured at up to 25%, and gains may owe capital-gains tax (a 1031 exchange can defer both). Figures are a year-1 estimate at your 24.0% rate — not tax advice; consult a CPA.
Schools (NCES district)
- District
- Duval
- NCES district ID
- 1200480
- Math proficiency
- 46% ▼ -11.00%
- Reading proficiency
- 45% ▼ -4.00%
- Median HH income
- $48,987
- Composite
- 38.97/100
- National rank
- #4076
- State rank
- #48 of 73 in FL
Livability — Jacksonville
- Score
- 83/100
- State rank
- #50
- US rank
- #911
Category grades
Schools grade is shown separately in the Schools card above.
Census & demographics
- Census place
- Jacksonville, FL
- County
- Duval County · 1,015,274 people
- City population
- 979,034
- Metro
- Jacksonville, FL
- Population (ZIP)
- 34,657
- Household income
- $30,514
- Rent vs Own
- Severe rent burden
- 2921.0
Population outlook (Duval County) Hauer SSP2
- Today (2025)
- 1,013,010 people
- By 2030
- 1,059,228 · +4.6%
- By 2040
- 1,141,439 · +12.7%
- By 2050
- 1,205,258 · +19.0%
- By 2075
- 1,324,282 · +30.7%
- By 2100
- 1,319,620 · +30.3%
Race, ethnicity, and origin ACS 2023
- Neighborhood character
- Predominantly Black (88%)
- Race & ethnicity
- Black 88% White 5% Hispanic / Latino 5% Two or more races 2%
- Hispanic origin (detail)
- Puerto Rican 3%
- Common ancestry
- Hispanic 1% Romanian 1%
- Foreign-born
- 3% · Canada
- Languages at home
- 95% English-only · Spanish 4% French/Haitian/Cajun 1%
Political lean MEDSL · Duval
- 2024 margin
- Toss-up / Even · D 48.7% · R 50.1% · Other 1.2%
- 2008→2024 swing
- +0.4pp no change · 2008: -1.9pp · 2024: -1.5pp
- All cycles
- 2024: R+1.5 2020: D+3.8 2016: R+1.5 2012: R+3.6 2008: R+1.9
Not yet ingested
- Civics
- —
Market trends
- HPI YoY
- ▼ -53.92%
- Current HPI
- 189.5977
- Rent YoY
- ▲ 1.81%
- Metro
- Jacksonville, FL
- State GDP YoY
- ▲ 3.28%
- F500 in state
- 36
Industry mix (Fortune 500 HQ in FL)
| Industry | F500 HQs | Revenue |
|---|---|---|
| Industrial Technology | 2 | $29B |
|
||
| Insurance | 2 | $17B |
|
||
| Retail | 1 | $60B |
|
||
| Technology Distribution | 1 | $58B |
|
||
| Homebuilding | 1 | $35B |
|
||
| Technology Manufacturing | 1 | $35B |
|
||
Price history
+36.4% since first listed16 events — show timeline
- 2026-05-23 Relisted — realMLS
- 2026-05-22 Listing Removed — realMLS
- 2026-05-09 Relisted — realMLS
- 2026-04-30 Contingent — realMLS
- 2026-04-08 Price Changed $75,000 realMLS
- 2026-03-23 Price Changed $78,000 realMLS
- 2026-03-06 Price Changed $79,900 realMLS
- 2026-02-20 Listed $80,000 realMLS
- 2021-08-31 Listing Removed — realMLS
- 2021-08-20 Relisted — realMLS
- 2021-07-19 Pending — realMLS
- 2021-06-30 Relisted — realMLS
- 2021-06-26 Listing Removed — realMLS
- 2021-06-16 Price Changed $54,000 realMLS
- 2021-05-28 Price Changed $59,000 realMLS
- 2021-05-25 Listed $55,000 realMLS
Property tax history
+9.5%/yrLatest (2025): $1,812 · +21.9% YoY. Source: county tax records.
Cash-flow waterfall
monthlySold comps — $/sqft
last 12 mo · ≤1 miLoading sold comps…