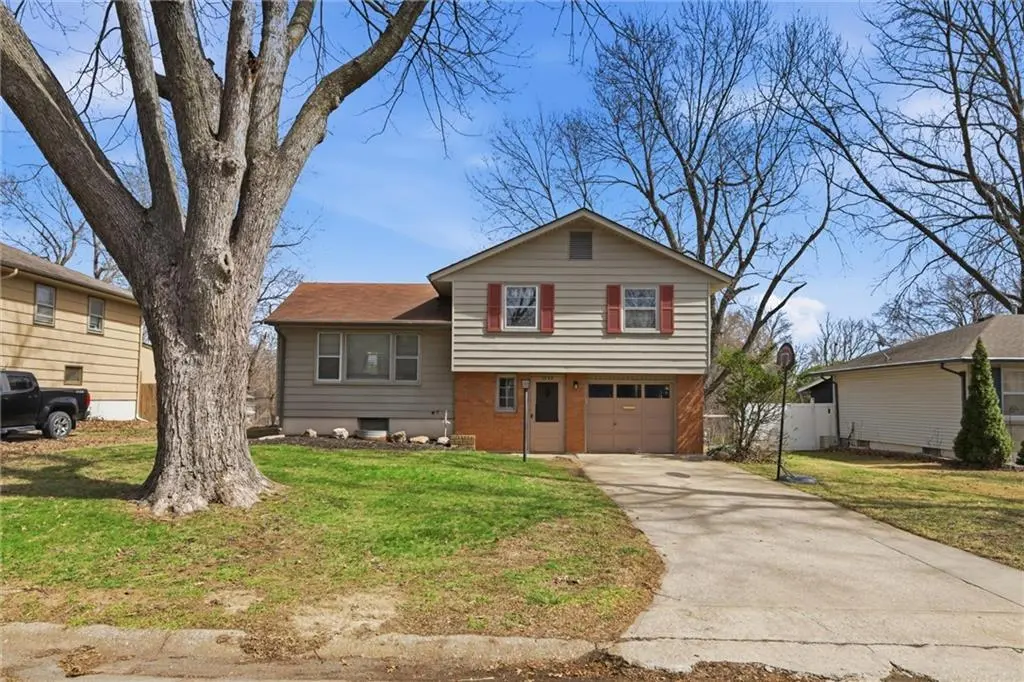
3527 S Adams Ave · Independence, MO
Flood risk 1/10 · Minimal
- FEMA flood zone
- X (unshaded)
- Chance of flooding over 30 yrs
- 0.0%
- Est. flood insurance / yr
- $473 – $860
Fire risk 1/10 · Minimal
- Est. fire insurance / yr
- $1,054 – $1,958
Heat risk 4/10 · Minor
- Hot days now (above 107°F)
- 7 days/yr
- Hot days in 30 yrs
- 17 days/yr
Wind risk 2/10 · Minimal
- Chance of severe wind over 30 yrs
- —
Air-quality risk 3/10 · Minor
- Unhealthy air days now
- 3 days/yr
- Unhealthy air days in 30 yrs
- 3 days/yr
Risk factors via First Street. Map © Google.
Why this score? — see what drove the D+ grade
The composite is a weighted blend of 9 inputs, each scored 0–100. Each bar is that input's sub-score; the figure is the points it added to the 100-point composite (weight × sub-score).
- Cash flow +14.1/30.0
- ARV discount +12.5/15.0
- DSCR +4.3/10.0
- Livability +4.1/5.0
- Rent growth +3.8/5.0
- 1% rule +3.3/10.0
- Schools +2.7/10.0
- Condition / age +2.5/5.0
- Appreciation +0.0/10.0
$195,000
🖨 Deal sheet (PDF) 📄 Offer letter ✓ Due diligence
Listing remarks MLS
Perfect starter home in nice neighborhood. Home is in wonderful condition & has been very well cared for by the current owners. Hardwood floors throughout; updated cabinets, hardware & newer ceramic tile in the kitchen; good sized bedrooms; big laundry room on the garage level; newer roof, A/C & deck; large fenced back yard. 1st time buyer's dream. Lower level has over 300 sf that is clean, dry and could easily be finished as a rec room or home office. Or just leave it as it is and use it for a play room/exercise room/storage
Key facts
- 9,583 sq ft lot
- Garage
- Built 1962
Property features AI
Finance
- Other: Approximately 1,035 above-grade finished living area; Lot dimensions about 65 x 149 (0.22 acre)
Exterior
- Parking: Attached built-in garage with garage door opener; garage faces front (1 garage space)
- Security: Smoke detector(s)
- Utilities: Public water; Public sewer; Cable, fiber, and high-speed internet available
- Home design: Single family residence (residential property); Tri-level / side-by-side split; Located inside city limits
- Construction: Frame construction with metal siding; Composition (asphalt) roof; Basement: concrete, daylight, inside entrance
- Exterior features: Deck; Fire pit; Metal fencing; City lot with paved road and public maintenance
Interior
- Kitchen: Dishwasher; Disposal; Exhaust fan; Microwave; Refrigerator; Electric range; Kitchen with ceramic tile flooring; eat-in/country kitchen layout
- Bedrooms: 3 bedrooms (all on the third level)
- Flooring: Wood flooring; Linoleum in some bathrooms and laundry; Ceramic tile in kitchen
- Bathrooms: 1 full bathroom with shower-over-tub; 1 half bathroom
- Heating & cooling: Forced air heating; Electric cooling (central air)
- Interior features: Window coverings; Smoke detector(s); Side/side split and tri-level floor plan
- Laundry & utility: Dedicated laundry room on the lower level
Neighborhood map
What this means for you Summary
Snapshot
- This is a 3-bed/1.5-bath single-family listed at $195k.
Deal economics
- At list price, monthly cash flow is $30 ($358/yr) — positive.
- The deal already cash-flows at list — no discount required.
- To meet the 1% rule (rent ≥ 1% of price), the offer needs to be $162k (16.8% below list).
- Recommended offer: $162k (16.8% below list) — sets the bar for 1% rule.
- Cap rate 6.5% vs local median 5.0% in Independence — meaningfully above typical; check what's discounted (condition, days-on-market, listing class) to confirm the premium yield is real.
Location & tenants
- Location reads 82/100 on livability (#10 in MO, #1,296 nationally) — a professional / high-income tenant draw. Strengths: amenities A+, commute A+, cost of living A+; Watch: employment D+, crime F.
- Independence 30 (suburban): math 26% / reading 38% proficiency, ranked #252 of 324 in MO (top 78%) — families likely to look elsewhere, expect single-tenant / working-renter base with shorter leases.
- Zoned schools: Sycamore Hills Elem. (math 42% / reading 47%, grade F, #413 of 1,115 statewide, top 42%, 543 students, 55% FRL); Truman High (math 18% / reading 34%, grade F, #430 of 521 statewide, top 83%, 1,662 students, 52% FRL) — zoned schools at 54% FRL track the district average.
- Market conditions: Rents rising fast (+5.1%/yr); 202 active listings in the ZIP; 19 comparable units currently listed for rent nearby; rentals at typical pace (median 17d on market — plan ~3-4 weeks tenant-placement turnaround); 4,002 units permitted in Jackson County in 2024 (2,271 in 5+ unit buildings).
- This rent runs 31% of the median local income ($62k/yr) — at the standard rent-burdened threshold; future hikes will face affordability resistance.
Forward outlook
- Local home prices are declining (-3.0%/yr); year-one equity from $1k of loan paydown is wiped out by about $6k of value loss. Plan a longer hold.
- Jackson County population projected at +4% by 2050 — modest demand growth; plan on rents tracking national, not racing it.
Negotiation context
- Only 8 days on market — expect competitive offers; lowballing is unlikely to land.
- 3 sale attempts since 21y ago with the ask held roughly flat each time — persistent listings suggest the price (not the market) is what's stuck; bring a comps-based counter.
Questions for the listing agent
- Built in 1962 — when were the roof, HVAC, electrical panel, plumbing, and water heater last replaced?
- Is there a deadline driving the sale (1031 exchange, divorce, estate, relocation)? That informs how much negotiation room exists.
- Crime grade is F in this area — have there been break-ins, vandalism, or insurance claims at this property in the last 3 years? What carrier currently insures it and at what premium?
- The area grade is low — what's the realistic commute time and amenity access for the typical tenant pool here? Any planned neighborhood developments (good or bad) we should know about?
- What's the average days-on-market for RENTAL listings here right now (not sales)? A rising rental-DOM trend means longer vacancies and softer asking-rent achievability than the comps imply.
- What's the recent tenant-quality profile in this submarket — average credit score on applications, eviction rate, late-payment / NSF rate, and stable-employment percentage? A property-management company in the area should have these aggregated.
- How much new for-sale + rental construction is in the pipeline within 1–3 miles? Heavy new supply typically softens prices + rents 12–24 months out; constrained supply supports both.
Investment metrics
- 1% rule
- 0.83% ✗
- Cap rate
- 6.48%
- Cash-on-cash
- 0.66%
- DSCR
- 1.03
- GRM
- 10.0
CMA / ARV
- ARV (on-the-fly)
- $219,600
- Comps found
- 12
Show comp detail 12 sales within ~0.75 mi
| Address | Dist | Beds/Ba | Sqft | Sold | Price | $/sf | Match |
|---|---|---|---|---|---|---|---|
| 15300 E 36th Ter S | 0.07mi | 3/1.0 | 1,220 (0%) | 0mo | $219,900 | $180 | 94 |
| 3700 Randall Dr | 0.14mi | 3/1.5 | 1,180 (-3%) | 4mo | $245,000 | $208 | 85 |
| 3518 S Haden Dr | 0.14mi | 3/2.0 | 1,350 (+11%) | 6mo | $240,500 | $178 | 69 |
| 14507 E 39th Ter S | 0.61mi | 3/2.0 | 1,162 (-5%) | 1mo | $225,000 | $194 | 61 |
| 3601 S Hocker Ave | 0.55mi | 3/2.0 | 1,196 (-2%) | 11mo | $169,900 | $142 | 60 |
| 14600 E 33rd St | 0.55mi | 3/1.5 | 1,364 (+12%) | 1mo | $241,000 | $177 | 54 |
| 14805 E 40th St S | 0.56mi | 3/1.5 | 1,107 (-9%) | 8mo | $185,000 | $167 | 52 |
| 14224 E 36th St | 0.59mi | 3/2.0 | 1,300 (+7%) | 10mo | $235,000 | $181 | 51 |
| 14400 E 32nd Ter S | 0.68mi | 3/2.0 | 1,274 (+4%) | 12mo | $248,800 | $195 | 50 |
| 4222 E 42nd Street Ct | 0.73mi | 3/1.0 | 1,150 (-6%) | 10mo | $229,900 | $200 | 46 |
| 3830 S Summit Ridge Dr | 0.72mi | 3/2.0 | 1,324 (+8%) | 8mo | $210,000 | $159 | 43 |
| 521 S Leslie Dr | 0.65mi | 3/2.0 | 1,362 (+12%) | 8mo | $240,000 | $176 | 42 |
Match score weights: distance 35% · size 25% · config 20% · recency 20%. Top-matched comps best support the ARV.
Projected returns pro-forma
-3.0% appreciation · 5.09% rent growth · sell at horizon
- IRR
- -13.1%
- Equity multiple
- 0.52×
- Total profit
- $-26,247
- Equity at exit
- $29,075
- IRR
- -1.4%
- Equity multiple
- 0.90×
- Total profit
- $-5,628
- Equity at exit
- $16,860
Cash invested: $54,600 (down + closing). Projections, not guarantees.
Landlord ↔ Tenant lean methodology
- Overall (STATE)
- 81 Strongly Landlord-Friendly
- State Missouri
- 81 Strongly Landlord-Friendly · R+10
- County
- — inherits STATE
- City
- — inherits STATE
ZIP-level market 64055
- Rents YoY
- 5.1%
- Active inventory
- 202
- Price-to-rent
- 10.0×
Monthly cashflow live
- Estimated rent
- $1,623 high interval (Pro) →
- Mortgage (P&I)
- −$1,023
- Tax from tax record
- −$148 /mo · $1,778/yr
- Insurance
- −$81
- HOA
- −$0
- Vacancy / Maint / Mgmt
- −$341
- Net cashflow
- $30
Break-even live
Sensitivity live
| Price | -10% $140 | -5% $85 | +0% $30 | +5% $-25 | +10% $-81 |
|---|---|---|---|---|---|
| Rent | -10% $-98 | -5% $-34 | +0% $30 | +5% $94 | +10% $158 |
| Rate | -1.0pp $128 | -0.5pp $79 | base $30 | +0.5pp $-21 | +1.0pp $-72 |
UW: 25.0% down · 7.5% · 30yr · 1.5% tax · 5.0% vac · 8.0% maint · 8.0% mgmt
Financing live
Cash to close
- Down payment
- $48,750
- Closing costs
- $5,850
- Reserves months
- —
- Total cash needed
- —
Loan-product check · same deal, 3 products live
Conventional
25% down · 7.5% · 30yr
- Down + closing
- —
- Monthly P&I
- —
- Monthly cashflow
- —
- DSCR
- —
- Eligible?
- —
Personal DTI + credit; lowest rate.
DSCR
20% down · 8.5% · 30yr
- Down + closing
- —
- Monthly P&I
- —
- Monthly cashflow
- —
- DSCR
- —
- Eligible?
- —
No personal income docs; deal must DSCR.
Hard money
10% down · 12.0% · 12mo
- Down + closing
- —
- Monthly P&I
- —
- Monthly cashflow
- —
- DSCR
- —
- Eligible?
- —
Short-term bridge; refi at stabilization.
Rent comps 19 comps
| Address | Beds | Baths | Sqft | Rent | $/sqft | DOM | Units | Dist |
|---|---|---|---|---|---|---|---|---|
| 3605 S Stayton Ave Independence, MO | 3.0 | 2.0 | 1078 | $1,631 | $1.51 | 8d | 1 | 0.26mi |
| 14405 E 37th St S Independence, MO | 3.0 | 1.0 | 1300 | $1,800 | $1.38 | 4d | 1 | 0.51mi |
| 2905 S Lee's Summit Rd Independence, MO | 1.0–3.0 | 1.0–2.0 | 853 | $1,746 | $2.05 | 2d | 48 | 0.83mi |
| 16504 E 33rd St S Independence, MO | 4.0 | 2.0 | 1495 | $2,055 | $1.37 | 2d | 1 | 0.87mi |
| 16301 E 29 St S Independence, MO | 1.0–2.0 | 1.0 | 718 | $1,400 | $1.95 | 17d | 16 | 0.97mi |
| 3551 S Lynn St Unit 3551 Independence, MO | 2.0 | 1.0 | 850 | $899 | $1.06 | 44d | 1 | 0.98mi |
| 16421 E 29th Ter S Independence, MO | 3.0 | 2.0 | 1225 | $1,606 | $1.31 | 44d | 1 | 1.07mi |
| 16428 E 29th Street Ct S Unit B Independence, MO | 2.0 | 1.5 | 826 | $1,277 | $1.55 | 24d | 1 | 1.13mi |
| 3501 S Osage St Independence, MO | 3.0 | 1.0 | 1300 | $1,495 | $1.15 | 17d | 1 | 1.16mi |
| 3501 S Osage St Independence, MO | 3.0 | 1.0 | 1300 | $1,495 | $1.15 | 20d | 1 | 1.16mi |
| 3100 Quail Creek Dr Independence, MO | 1.0–2.0 | 1.0 | 961 | $1,330 | $1.38 | 13d | 1 | 1.19mi |
| 13511 E 41st Ter S Independence, MO | 3.0 | 2.0 | 925 | $1,530 | $1.65 | 24d | 1 | 1.21mi |
| 8061/2 E Devon St Independence, MO | 2.0 | 1.0 | 824 | $1,195 | $1.45 | 8d | 1 | 1.25mi |
| 4232 S Liberty St Independence, MO | 3.0 | 1.0 | 1152 | $1,525 | $1.32 | 24d | 1 | 1.35mi |
| 3936 S Pleasant St Independence, MO | 3.0 | 2.0 | 1150 | $1,750 | $1.52 | 24d | 1 | 1.36mi |
| 16801 E Larkspur Ln Independence, MO | 1.0–3.0 | 1.0–2.0 | 1042 | $1,549 | $1.49 | 44d | 26 | 1.47mi |
| 16801 E Larkspur Ln Independence, MO | 1.0–3.0 | 1.0–2.0 | 1125 | $1,650 | $1.47 | 2d | 7 | 1.47mi |
| 15404 E 48th St Kansas City, MO | 2.0 | 1.5 | 1325 | $1,350 | $1.02 | 24d | 1 | 1.49mi |
| 15312 E 48th St Kansas City, MO | 3.0 | 2.0 | 1160 | $1,700 | $1.47 | 13d | 1 | 1.50mi |
Listing history 9 events
-
2026-04-17status Pending
-
2026-04-09$195,000 Active
-
2026-03-25historical $195,000
-
2019-09-17soldstatus
-
2019-09-17soldstatus
-
2013-05-10$90,000 549-char remark
Show marketing remark (549 chars)
Perfect starter home in nice neighborhood. Home is in wonderful condition & has been very well cared for by the current owners. Hardwood floors throughout; updated cabinets, hardware & newer ceramic tile in the kitchen; good sized bedrooms; big laundry room on the garage level; newer roof, A/C & deck; large fenced back yard. 1st time buyer's dream. Lower level has over 300 sf that is clean, dry and could easily be finished as a rec room or home office. Or just leave it as it is and use it for a play room/exercise room/storage
-
2005-06-30soldstatus
-
2005-06-21soldstatus 302-char remark
Show marketing remark (302 chars)
Great area and nice home. LR eat-in kitchen, washer & dryer hook-up on entrance level. 1 1/2 baths, basement & garage. Water heater & dispoal 1994. This home has wood windows and steel siding. Double sliding doors going out to backyard. Original owners, one family owned. Fenced yard.
-
2005-04-06$99,950 302-char remark
Show marketing remark (302 chars)
Great area and nice home. LR eat-in kitchen, washer & dryer hook-up on entrance level. 1 1/2 baths, basement & garage. Water heater & dispoal 1994. This home has wood windows and steel siding. Double sliding doors going out to backyard. Original owners, one family owned. Fenced yard.
ⓘ Source: listings_history table (triggers on properties + properties_extension) + one-shot
backfill from property_details.listing_events for pre-trigger history.
Tax reassessment forecast MO · Resets to sale price
- Current annual tax
- $1,778 · $148/mo
- Projected year-2 tax
- $1,892 · $158/mo
- Expected delta
- +$114/yr (+$9/mo · 6.4%)
ⓘ Screening estimate from a state-policy table — verify with the county assessor before closing.
Climate risk First Street
- Flood 1/10 Low FEMA zone X (unshaded) · 0% chance over 30 yrs
- Wildfire 1/10 Low
- Heat 4/10 Moderate 7 d/yr ≥107°F today · 17 d/yr by 30 yrs out
- Wind 2/10 Low
- Air quality 3/10 Moderate 3 unhealthy d/yr today · 3 by 30 yrs out
Nearby sold comps map
Loading sold comps map…
Walkable amenities ~0.75 mi
Loading nearby amenities…
Taxation est. · year 1
- Rental income
- $19,471
- − Mortgage interest
- −$10,923
- − Property taxes
- −$1,778
- − Insurance
- −$975
- − Repairs & maintenance
- −$1,558
- − Management
- −$1,558
- − Depreciation
- −$5,673
- Taxable loss
- −$2,993
- Est. tax savings @ 24.0%
- +$718
- After-tax cash flow
- $1,077/yr
For passive investors: Depreciation is non-cash, so a rental often shows a tax loss while cash-flowing — sheltering income. Rental losses are passive: they offset passive income freely, and up to $25,000/yr can offset ordinary (W-2) income if you actively participate and your MAGI is under $100k (phasing out to $0 by $150k); unused losses carry forward. On sale, claimed depreciation is recaptured at up to 25%, and gains may owe capital-gains tax (a 1031 exchange can defer both). Figures are a year-1 estimate at your 24.0% rate — not tax advice; consult a CPA.
Schools (NCES district)
- District
- Independence 30
- NCES district ID
- 2915480
- Math proficiency
- 26% ▼ -8.00%
- Reading proficiency
- 38% ▼ -5.00%
- Median HH income
- $41,843
- Composite
- 27.04/100
- National rank
- #7054
- State rank
- #252 of 324 in MO
Livability — Independence
- Score
- 82/100
- State rank
- #10
- US rank
- #1296
Category grades
Schools grade is shown separately in the Schools card above.
Census & demographics
- Census place
- Independence, MO
- County
- Jackson County · 687,798 people
- City population
- 117,675
- Metro
- Kansas City, MO-KS
- Population (ZIP)
- 35,960
- Household income
- $62,439
- Rent vs Own
- Severe rent burden
- 1404.0
Population outlook (Jackson County) Hauer SSP2
- Today (2025)
- 719,589 people
- By 2030
- 731,456 · +1.6%
- By 2040
- 746,689 · +3.8%
- By 2050
- 749,289 · +4.1%
- By 2075
- 736,227 · +2.3%
- By 2100
- 668,210 · -7.1%
Race, ethnicity, and origin ACS 2023
- Neighborhood character
- Predominantly White (71%)
- Race & ethnicity
- White 71% Black 13% Hispanic / Latino 10% Two or more races 8% Asian 1%
- Hispanic origin (detail)
- Mexican 7% Puerto Rican 2%
- Common ancestry
- Italian 9% Lithuanian 2% Slovak 2%
- Foreign-born
- 4% · Canada
- Languages at home
- 94% English-only · Spanish 4%
Political lean MEDSL · Jackson
- 2024 margin
- D (+19.3) · D 58.9% · R 39.5% · Other 1.6%
- 2008→2024 swing
- -6.1pp toward R · 2008: 25.4pp · 2024: 19.3pp
- All cycles
- 2024: D+19.3 2020: D+22.0 2016: D+16.6 2012: D+19.0 2008: D+25.4
Not yet ingested
- Civics
- —
Market trends
- HPI YoY
- ▼ -180.54%
- Current HPI
- 245.3636
- Rent YoY
- ▲ 5.09%
- Metro
- Kansas City, MO-KS
- State GDP YoY
- ▲ 1.84%
- F500 in state
- 20
Industry mix (Fortune 500 HQ in MO)
| Industry | F500 HQs | Revenue |
|---|---|---|
| Healthcare | 1 | $163B |
|
||
| Insurance | 1 | $21B |
|
||
| Industrial Technology | 1 | $17B |
|
||
| Retail | 1 | $16B |
|
||
| Industrial Distribution | 1 | $10B |
|
||
| Utilities | 1 | $9B |
|
||
Price history
+95.1% since first listed9 events — show timeline
- 2026-04-17 Pending — Heartland MLS as Distributed by MLS Grid
- 2026-04-09 Listed $195,000 Heartland MLS as Distributed by MLS Grid
- 2026-03-25 Coming Soon $195,000 Heartland MLS as Distributed by MLS Grid
- 2019-09-17 Sold (Public Records) — Public Records
- 2019-09-17 Sold (Public Records) — Public Records
- 2013-05-10 Listed $90,000 Heartland MLS as Distributed by MLS Grid
- 2005-06-30 Sold (Public Records) — Public Records
- 2005-06-21 Sold (MLS) — Heartland MLS as Distributed by MLS Grid
- 2005-04-06 Listed $99,950 Heartland MLS as Distributed by MLS Grid
Property tax history
+2.5%/yrLatest (2025): $1,778 · -22.5% YoY. Source: county tax records.
Cash-flow waterfall
monthlySold comps — $/sqft
last 12 mo · ≤1 miLoading sold comps…