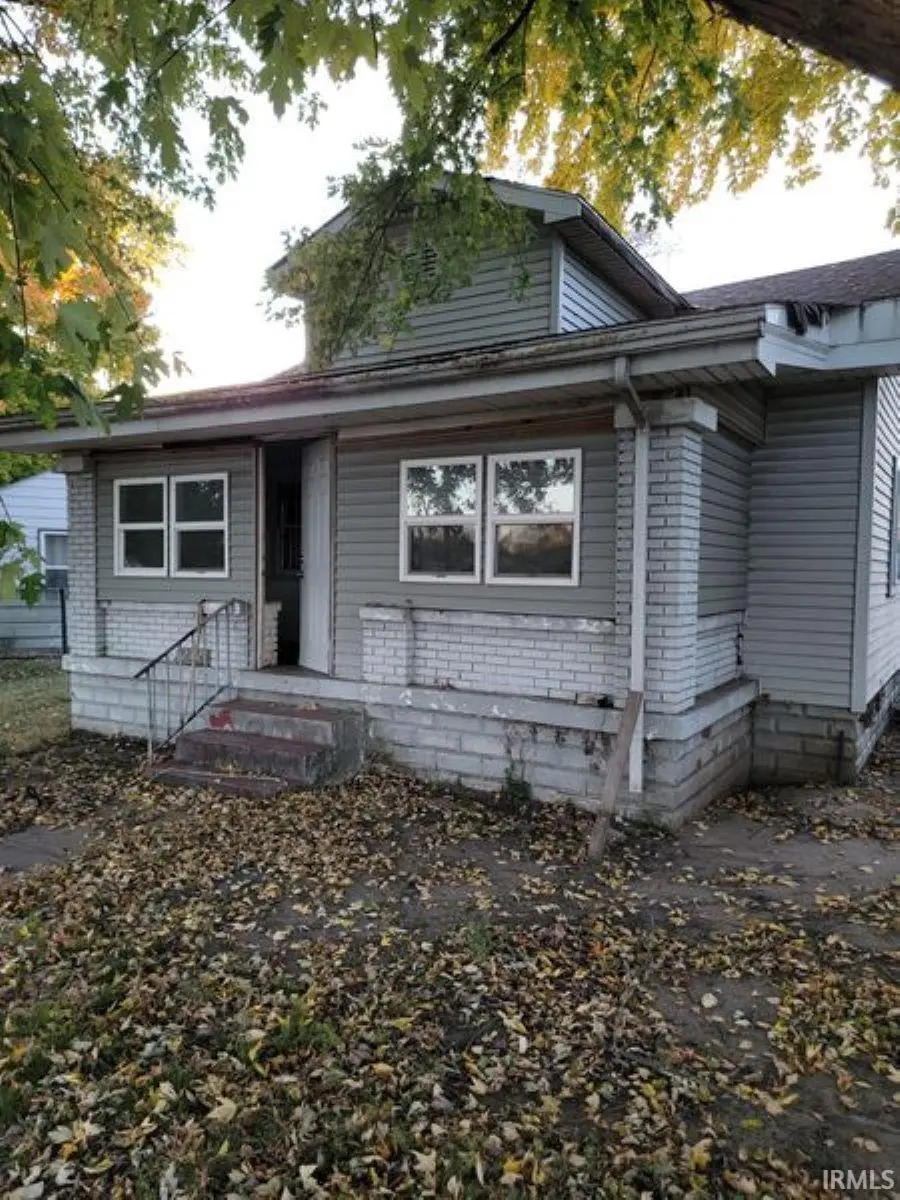
2420 Lafayette Ave · Terre Haute, IN
Flood risk 1/10 · Minimal
- FEMA flood zone
- X (unshaded)
- Chance of flooding over 30 yrs
- 0.0%
- Est. flood insurance / yr
- $473 – $860
Fire risk 1/10 · Minimal
- Est. fire insurance / yr
- $717 – $1,331
Heat risk 4/10 · Minor
- Hot days now (above 105°F)
- 7 days/yr
- Hot days in 30 yrs
- 19 days/yr
Wind risk 2/10 · Minimal
- Chance of severe wind over 30 yrs
- 1.0%
Air-quality risk 3/10 · Minor
- Unhealthy air days now
- 3 days/yr
- Unhealthy air days in 30 yrs
- 4 days/yr
Risk factors via First Street. Map © Google.
Why this score? — see what drove the C+ grade
The composite is a weighted blend of 9 inputs, each scored 0–100. Each bar is that input's sub-score; the figure is the points it added to the 100-point composite (weight × sub-score).
- Cash flow +22.6/30.0
- ARV discount +15.0/15.0
- DSCR +7.2/10.0
- 1% rule +5.3/10.0
- Livability +3.8/5.0
- Schools +2.9/10.0
- Rent growth +2.5/5.0
- Condition / age +2.5/5.0
- Appreciation +0.0/10.0
$92,599
🖨 Deal sheet (PDF) 📄 Offer letter ✓ Due diligence
Key facts
- 4,792 sq ft lot
- Built 1924
- Listed 603 days
Neighborhood map
What this means for you Summary
Snapshot
- This is a 2-bed/1.0-bath single-family listed at $93k.
Deal economics
- At list price, monthly cash flow is $158 ($2k/yr) — positive.
- The deal already cash-flows at list — no discount required.
- Meets the 1% rule at list price ($957 rent vs $93k).
- Recommended offer: $81k (12.0% below list) — sets the bar for market timing.
- Cap rate 8.3% vs local median 4.6% in Terre Haute — top-decile yield for the area; either an underpriced asset or a hidden risk that comps aren't pricing in. Stress-test before assuming the spread holds.
Location & tenants
- Location reads 75/100 on livability (#63 in IN, #4,186 nationally) — a middle-class / working-renter tenant base. Strengths: cost of living A+, housing A+, health & safety A+; Watch: crime F, employment F.
- Vigo County School Corporation (urban): math 32% / reading 37% proficiency, ranked #202 of 301 in IN (top 67%) — families likely to look elsewhere, expect single-tenant / working-renter base with shorter leases.
- Zoned schools: Terre Town Elementary School (math 43% / reading 35%, grade F, #530 of 994 statewide, top 54%, 556 students, 82% FRL); Otter Creek Middle School (math 13% / reading 25%, grade F, #274 of 330 statewide, top 83%, 787 students, 65% FRL); Terre Haute North Vigo High School (math 25% / reading 62%, grade F, #191 of 369 statewide, top 52%, 1,507 students, 51% FRL) — zoned schools average 66% FRL vs 47% district-wide (19 pts higher); higher-poverty schools than district average — tighter screening recommended.
- Market conditions: 81 active listings in the ZIP; 3 comparable units currently listed for rent nearby; rentals lingering (median 46d on market — plan ~5-8 weeks vacancy on turnover, expect pricing pressure); 100% of comp listings sitting > 30 days — soft ceiling on asking rent; 60 units permitted in Vigo County in 2024 (0 in 5+ unit buildings).
- This rent is only 16% of the median local income ($72k/yr) — well below the 30% rent-burden line; pricing power to push rent on renewal without tenant pushback.
Forward outlook
- Local home prices are declining (-3.0%/yr); year-one equity from $640 of loan paydown is wiped out by about $3k of value loss. Plan a longer hold.
- Vigo County population projected to shrink 5% by 2050 — rents likely to lag national; underwrite the cash flow, not the appreciation.
Negotiation context
- It's been on market 603 days — a 12% lower offer ($81k) is reasonable based on typical stale-listing flexibility.
- 2 sale attempts since 2y ago; this cycle's ask has dropped $5k (6%) from the opening price — seller is motivated, your offer sets the floor, not the list.
Risks & watch-outs
- Watch-outs: built in 1924 — expect roof / HVAC / electrical / plumbing capex.
Questions for the listing agent
- It's been on market 603 days. Have you received any prior offers? Is the seller open to a 12% concession, seller financing, or rate buy-down credit?
- Built in 1924 — when were the roof, HVAC, electrical panel, plumbing, and water heater last replaced?
- Why hasn't it sold? Are there any deal-killer items the seller is aware of (foundation, flood, title, zoning, code violations)?
- Is there a deadline driving the sale (1031 exchange, divorce, estate, relocation)? That informs how much negotiation room exists.
- Schools are D-rated, which usually means shorter tenancies and higher turnover. Who's the typical renter profile here, and what's been the actual vacancy rate?
- Crime grade is F in this area — have there been break-ins, vandalism, or insurance claims at this property in the last 3 years? What carrier currently insures it and at what premium?
- What's the average days-on-market for RENTAL listings here right now (not sales)? A rising rental-DOM trend means longer vacancies and softer asking-rent achievability than the comps imply.
- What's the recent tenant-quality profile in this submarket — average credit score on applications, eviction rate, late-payment / NSF rate, and stable-employment percentage? A property-management company in the area should have these aggregated.
- How much new for-sale + rental construction is in the pipeline within 1–3 miles? Heavy new supply typically softens prices + rents 12–24 months out; constrained supply supports both.
Investment metrics
- 1% rule
- 1.03% ✓
- Cap rate
- 8.34%
- Cash-on-cash
- 7.29%
- DSCR
- 1.32
- GRM
- 8.1
CMA / ARV
- ARV (median comp)
- $135,485
- List price
- $92,599
- Delta
- -31.65%
- Verdict
- UNDERPRICED
- Comps
- 20 within 1.0 mi
Show comp detail 7 sales within ~0.75 mi
| Address | Dist | Beds/Ba | Sqft | Sold | Price | $/sf | Match |
|---|---|---|---|---|---|---|---|
| 3839 N 26th St | 0.24mi | 3/1.0 (+1) | 989 (+0%) | 1mo | $107,000 | $108 | 83 |
| 1933 Dahlen Ave | 0.38mi | 2/1.0 | 1,032 (+5%) | 2mo | $178,500 | $173 | 73 |
| 1924 Dahlen Avenue Ave | 0.40mi | 3/1.0 (+1) | 924 (-6%) | 1mo | $158,000 | $171 | 65 |
| 2201 Cross Ln | 0.33mi | 2/1.0 | 1,100 (+12%) | 6mo | $110,000 | $100 | 60 |
| 3220 N 24th St | 0.71mi | 2/1.0 | 896 (-9%) | 6mo | $23,000 | $26 | 46 |
| 3218 N 24th St | 0.72mi | 2/1.0 | 1,076 (+9%) | 8mo | $92,500 | $86 | 45 |
| 2730 E Dexter Ave | 0.68mi | 2/1.0 | 940 (-5%) | 22mo | $110,000 | $117 | 42 |
Match score weights: distance 35% · size 25% · config 20% · recency 20%. Top-matched comps best support the ARV.
Projected returns pro-forma
-3.0% appreciation · 3.0% rent growth · sell at horizon
- IRR
- -5.2%
- Equity multiple
- 0.81×
- Total profit
- $-4,979
- Equity at exit
- $13,807
- IRR
- 4.5%
- Equity multiple
- 1.33×
- Total profit
- $8,544
- Equity at exit
- $8,006
Cash invested: $25,928 (down + closing). Projections, not guarantees.
Landlord ↔ Tenant lean methodology
- Overall (STATE)
- 90 Strongly Landlord-Friendly
- State Indiana
- 90 Strongly Landlord-Friendly · R+11
- County
- — inherits STATE
- City
- — inherits STATE
ZIP-level market 47805
- Home prices YoY
- -20.3%
- Active inventory
- 81
- Price-to-rent
- 8.1×
Monthly cashflow live
- Estimated rent
- $957 medium interval (Pro) →
- Mortgage (P&I)
- −$486
- Tax from tax record
- −$74 /mo · $889/yr
- Insurance
- −$39
- HOA
- −$0
- Vacancy / Maint / Mgmt
- −$201
- Net cashflow
- $158
Break-even live
Sensitivity live
| Price | -10% $210 | -5% $184 | +0% $158 | +5% $131 | +10% $105 |
|---|---|---|---|---|---|
| Rent | -10% $82 | -5% $120 | +0% $158 | +5% $195 | +10% $233 |
| Rate | -1.0pp $204 | -0.5pp $181 | base $158 | +0.5pp $134 | +1.0pp $109 |
UW: 25.0% down · 7.5% · 30yr · 1.5% tax · 5.0% vac · 8.0% maint · 8.0% mgmt
Financing live
Cash to close
- Down payment
- $23,150
- Closing costs
- $2,778
- Reserves months
- —
- Total cash needed
- —
Loan-product check · same deal, 3 products live
Conventional
25% down · 7.5% · 30yr
- Down + closing
- —
- Monthly P&I
- —
- Monthly cashflow
- —
- DSCR
- —
- Eligible?
- —
Personal DTI + credit; lowest rate.
DSCR
20% down · 8.5% · 30yr
- Down + closing
- —
- Monthly P&I
- —
- Monthly cashflow
- —
- DSCR
- —
- Eligible?
- —
No personal income docs; deal must DSCR.
Hard money
10% down · 12.0% · 12mo
- Down + closing
- —
- Monthly P&I
- —
- Monthly cashflow
- —
- DSCR
- —
- Eligible?
- —
Short-term bridge; refi at stabilization.
Rent comps 3 comps
| Address | Beds | Baths | Sqft | Rent | $/sqft | DOM | Units | Dist |
|---|---|---|---|---|---|---|---|---|
| 3850 N 25th St Terre Haute, IN | 2.0 | 1.0 | 900 | $1,000 | $1.11 | 45d | 1 | 0.20mi |
| 2524 E Dexter Ave North Terre Haute, IN | 1.0 | 1.0 | 600 | $650 | $1.08 | 45d | 1 | 0.58mi |
| 3100 N 14th St Terre Haute, IN | 3.0 | 1.5 | 990 | $1,450 | $1.46 | 45d | 1 | 1.17mi |
Listing history 21 events
-
2026-06-21days on market $92,599 Active 603 DOM
-
2026-06-19days on market $92,599 Active 601 DOM
-
2026-06-18days on market $92,599 Active 600 DOM
-
2026-06-17days on market $92,599 Active 599 DOM
-
2026-06-16days on market $92,599 Active 598 DOM
-
2026-06-15days on market $92,599 Active 597 DOM
-
2026-06-14days on market $92,599 Active 595 DOM
-
2026-06-13days on market $92,599 Active 594 DOM
-
2026-06-10days on market $92,599 Active 592 DOM
-
2026-06-09days on market $92,599 Active 591 DOM
-
2026-06-08days on market $92,599 Active 590 DOM
-
2026-06-07days on market $92,599 Active 589 DOM
-
2026-06-05days on market $92,599 Active 586 DOM
-
2026-06-02days on market $92,599 Active 584 DOM
-
2026-06-01days on market $92,599 Active 583 DOM
-
2026-05-31days on market $92,599 Active 582 DOM
-
2026-05-30days on market $92,599 Active 581 DOM
-
2026-04-13status Active
-
2025-12-22price $92,599
-
2025-09-05price $93,100
-
2024-10-27$98,000 Active
ⓘ Source: listings_history table (triggers on properties + properties_extension) + one-shot
backfill from property_details.listing_events for pre-trigger history.
Tax reassessment forecast IN · Partial reset (capped growth)
- Current annual tax
- $889 · $74/mo
- Projected year-2 tax
- $889 · $74/mo
- Expected delta
- $0/yr ($0/mo · 0.0%)
ⓘ Screening estimate from a state-policy table — verify with the county assessor before closing.
Climate risk First Street
- Flood 1/10 Low FEMA zone X (unshaded) · 0% chance over 30 yrs
- Wildfire 1/10 Low
- Heat 4/10 Moderate 7 d/yr ≥105°F today · 19 d/yr by 30 yrs out
- Wind 2/10 Low 100% chance of damaging wind over 30 yrs
- Air quality 3/10 Moderate 3 unhealthy d/yr today · 4 by 30 yrs out
Nearby sold comps map
Loading sold comps map…
Walkable amenities ~0.75 mi
Loading nearby amenities…
Taxation est. · year 1
- Rental income
- $11,481
- − Mortgage interest
- −$5,187
- − Property taxes
- −$889
- − Insurance
- −$463
- − Repairs & maintenance
- −$918
- − Management
- −$918
- − Depreciation
- −$2,694
- Taxable income
- $412
- Est. tax owed @ 24.0%
- −$99
- After-tax cash flow
- $1,792/yr
For passive investors: Depreciation is non-cash, so a rental often shows a tax loss while cash-flowing — sheltering income. Rental losses are passive: they offset passive income freely, and up to $25,000/yr can offset ordinary (W-2) income if you actively participate and your MAGI is under $100k (phasing out to $0 by $150k); unused losses carry forward. On sale, claimed depreciation is recaptured at up to 25%, and gains may owe capital-gains tax (a 1031 exchange can defer both). Figures are a year-1 estimate at your 24.0% rate — not tax advice; consult a CPA.
Schools (NCES district)
- District
- Vigo County School Corporation
- NCES district ID
- 1812090
- Math proficiency
- 32% ▼ -10.00%
- Reading proficiency
- 37% ▼ -8.00%
- Median HH income
- $40,100
- Composite
- 28.97/100
- National rank
- #6625
- State rank
- #202 of 301 in IN
Livability — Terre Haute
- Score
- 75/100
- State rank
- #63
- US rank
- #4186
Category grades
Schools grade is shown separately in the Schools card above.
Census & demographics
- Census place
- Terre Haute, IN
- County
- Vigo County · 91,193 people
- City population
- 91,193
- Metro
- Terre Haute, IN
- Population (ZIP)
- 12,619
- Household income
- $72,411
- Rent vs Own
- Severe rent burden
- 192.0
Population outlook (Vigo County) Hauer SSP2
- Today (2025)
- 106,366 people
- By 2030
- 105,674 · -0.7%
- By 2040
- 103,731 · -2.5%
- By 2050
- 101,200 · -4.9%
- By 2075
- 95,674 · -10.1%
- By 2100
- 85,910 · -19.2%
Race, ethnicity, and origin ACS 2023
- Neighborhood character
- Predominantly White (92%)
- Race & ethnicity
- White 92% Two or more races 5% Hispanic / Latino 2% Black 1%
- Common ancestry
- Italian 3% Slovak 2% Lithuanian 2%
- Foreign-born
- 1% · South Korea
- Languages at home
- 98% English-only · Spanish 1%
Political lean MEDSL · Vigo
- 2024 margin
- R (+18.1) · D 40.0% · R 58.1% · Other 2.0%
- 2008→2024 swing
- -33.9pp toward R · 2008: 15.8pp · 2024: -18.1pp
- All cycles
- 2024: R+18.1 2020: R+14.7 2016: R+15.2 2012: D+0.8 2008: D+15.8
Not yet ingested
- Civics
- —
Market trends
- HPI YoY
- ▼ -48.03%
- Current HPI
- 188.402
- Rent YoY
- —
- Metro
- Terre Haute, IN
- State GDP YoY
- ▲ 2.90%
- F500 in state
- 18
Industry mix (Fortune 500 HQ in IN)
| Industry | F500 HQs | Revenue |
|---|---|---|
| Industrial Machinery | 2 | $37B |
|
||
| Healthcare | 1 | $177B |
|
||
| Pharmaceuticals | 1 | $45B |
|
||
| Metals / Steel | 1 | $18B |
|
||
| Agriculture | 1 | $17B |
|
||
| Packaging | 1 | $12B |
|
||
Price history
-5.5% since first listed4 events — show timeline
- 2026-04-13 Relisted — IRMLS
- 2025-12-22 Price Changed $92,599 IRMLS
- 2025-09-05 Price Changed $93,100 IRMLS
- 2024-10-27 Listed $98,000 IRMLS
Property tax history
-6.4%/yrLatest (2024): $889 · +0.5% YoY. Source: county tax records.
Cash-flow waterfall
monthlySold comps — $/sqft
last 12 mo · ≤1 miLoading sold comps…