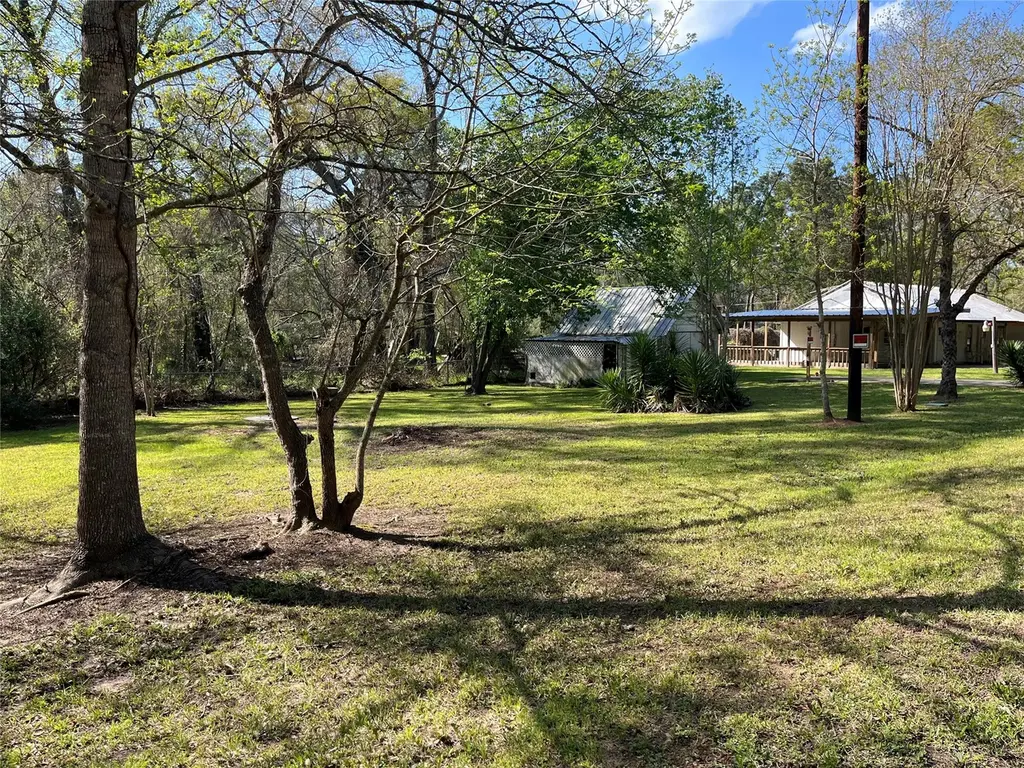
19995 Lakeway Ln · Montgomery, TX
Flood risk 8/10 · Major
- FEMA flood zone
- X (unshaded)
- Chance of flooding over 30 yrs
- 0.99%
- Est. flood insurance / yr
- $507 – $1,088
Fire risk 3/10 · Minor
- Est. fire insurance / yr
- $1,222 – $2,270
Heat risk 8/10 · Major
- Hot days now (above 111°F)
- 7 days/yr
- Hot days in 30 yrs
- 24 days/yr
Wind risk 8/10 · Major
- Chance of severe wind over 30 yrs
- 99.0%
Air-quality risk 2/10 · Minimal
- Unhealthy air days now
- 1 days/yr
- Unhealthy air days in 30 yrs
- 1 days/yr
Risk factors via First Street. Map © Google.
Why this score? — see what drove the B+ grade
The composite is a weighted blend of 9 inputs, each scored 0–100. Each bar is that input's sub-score; the figure is the points it added to the 100-point composite (weight × sub-score).
- Cash flow +30.0/30.0
- ARV discount +14.6/15.0
- DSCR +10.0/10.0
- 1% rule +8.4/10.0
- Schools +5.4/10.0
- Livability +3.5/5.0
- Condition / age +2.5/5.0
- Rent growth +1.7/5.0
- Appreciation +0.0/10.0
$150,000
🖨 Deal sheet (PDF) 📄 Offer letter ✓ Due diligence
Listing remarks MLS
Oversized Dual-Lot Property with Income Potential This unique, UNRESTRICTED property features two lots, each with city water, electric meters, septic tanks, and RV hookups with sewer input—ideal for creating two income-producing homes. The home includes 3 bedrooms, 2 bathrooms, handicap-accessible features, and a shared kitchen and living area setup. NEW wrap-around metal-covered porch with wood treated railing, NEW metal carport with gates, two concrete driveways, partial fenced yard, and a shed. Ready for your personal touch, this home is sold AS-IS. Public lake access to LAKE CONROE and to Scott’s Ridge Park both minutes away. Short distance from Montgomery shopping and local restaurants. Highly rated Montgomery schools.
Key facts
- Dual-lot property
- Income potential
- City water
Tags
Neighborhood map
What this means for you Summary
Snapshot
- This is a 3-bed/1.0-bath single-family listed at $150k.
Deal economics
- At list price, monthly cash flow is $492 ($6k/yr) — positive.
- The deal already cash-flows at list — no discount required.
- Meets the 1% rule at list price ($2k rent vs $150k).
- Recommended offer: $132k (12.0% below list) — sets the bar for market timing.
- Cap rate 10.8% vs local median 2.0% in Montgomery — top-decile yield for the area; either an underpriced asset or a hidden risk that comps aren't pricing in. Stress-test before assuming the spread holds.
Location & tenants
- Location reads 70/100 on livability (#372 in TX) — a middle-class / working-renter tenant base. Strengths: crime A+, employment A+, housing A+; Watch: amenities F, commute F, health & safety F.
- Montgomery ISD (rural): math 63% / reading 57% proficiency, ranked #49 of 826 in TX (top 6%) — acceptable for families but not a draw, mixed tenant base, ~2y average lease.
- Zoned schools: Montgomery El (math 50% / reading 50%, grade D+, #849 of 4,322 statewide, top 20%, 595 students, 45% FRL); Montgomery J H (math 68% / reading 54%, grade B+, #145 of 1,662 statewide, top 9%, 1,045 students, 30% FRL); Montgomery H S (math 53% / reading 62%, grade C, #327 of 1,632 statewide, top 20%, 1,556 students, 25% FRL).
- Market conditions: Rents falling (-3.3%/yr); 1069 active listings in the ZIP; solid renter incomes; 13,259 units permitted in Montgomery County in 2024 (1,402 in 5+ unit buildings).
Forward outlook
- Local home prices are declining (-3.0%/yr); year-one equity from $1k of loan paydown is wiped out by about $4k of value loss. Plan a longer hold.
- Montgomery County population projected at +65% by 2050 — long-run rental-demand tailwind backs the buy-and-hold thesis.
Negotiation context
- It's been on market 182 days — a 12% lower offer ($132k) is reasonable based on typical stale-listing flexibility.
- 4 sale attempts since 6y ago; this cycle's ask has dropped $25k (14%) from the opening price — seller is motivated, your offer sets the floor, not the list.
Risks & watch-outs
- Watch-outs: flood insurance adds $66/mo.
- Climate carrying-cost: severe flood risk; severe wind risk, 99% chance of damaging wind over 30y; extreme-heat days projected 7→24/yr by 2055 (HVAC capex compounding) — expect insurance premiums to compound above CPI over the hold.
Questions for the listing agent
- It's been on market 182 days. Have you received any prior offers? Is the seller open to a 12% concession, seller financing, or rate buy-down credit?
- What's the actual annual flood-insurance premium (NFIP or private), and is the property in a SFHA with mandatory coverage?
- Why hasn't it sold? Are there any deal-killer items the seller is aware of (foundation, flood, title, zoning, code violations)?
- Is there a deadline driving the sale (1031 exchange, divorce, estate, relocation)? That informs how much negotiation room exists.
- Schools are B-rated — typically a magnet for longer-tenancy family renters. What's the average tenant stay here, and is there a school-zone premium baked into asking?
- What's the average days-on-market for RENTAL listings here right now (not sales)? A rising rental-DOM trend means longer vacancies and softer asking-rent achievability than the comps imply.
- What's the recent tenant-quality profile in this submarket — average credit score on applications, eviction rate, late-payment / NSF rate, and stable-employment percentage? A property-management company in the area should have these aggregated.
- How much new for-sale + rental construction is in the pipeline within 1–3 miles? Heavy new supply typically softens prices + rents 12–24 months out; constrained supply supports both.
Investment metrics
- 1% rule
- 1.34% ✓
- Cap rate
- 10.76%
- Cash-on-cash
- 15.95%
- DSCR
- 1.71
- GRM
- 6.2
CMA / ARV
- ARV (median comp)
- $178,195
- List price
- $150,000
- Delta
- -15.82%
- Verdict
- UNDERPRICED
- Comps
- 6 within 1.0 mi
Projected returns pro-forma
-3.0% appreciation · 0.0% rent growth · sell at horizon
- IRR
- 0.8%
- Equity multiple
- 1.03×
- Total profit
- $1,206
- Equity at exit
- $22,365
- IRR
- 7.0%
- Equity multiple
- 1.45×
- Total profit
- $18,928
- Equity at exit
- $12,969
Cash invested: $42,000 (down + closing). Projections, not guarantees.
Landlord ↔ Tenant lean methodology
- Overall (STATE)
- 87 Strongly Landlord-Friendly
- State Texas
- 87 Strongly Landlord-Friendly · R+5
- County
- — inherits STATE
- City
- — inherits STATE
ZIP-level market 77356
- Home prices YoY
- -30.3%
- Rents YoY
- -3.3%
- Active inventory
- 1069
- Price-to-rent
- 6.2×
Monthly cashflow live
- Estimated rent
- $2,007 medium interval (Pro) →
- Mortgage (P&I)
- −$787
- Tax from tax record
- −$178 /mo · $2,133/yr
- Insurance
- −$62
- Flood insurance flood zone
- −$66 /mo · $798/yr
- HOA
- −$0
- Vacancy / Maint / Mgmt
- −$421
- Net cashflow
- $492
Break-even live
Sensitivity live
| Price | -10% $577 | -5% $534 | +0% $492 | +5% $449 | +10% $407 |
|---|---|---|---|---|---|
| Rent | -10% $333 | -5% $413 | +0% $492 | +5% $571 | +10% $650 |
| Rate | -1.0pp $567 | -0.5pp $530 | base $492 | +0.5pp $453 | +1.0pp $413 |
UW: 25.0% down · 7.5% · 30yr · 1.5% tax · 5.0% vac · 8.0% maint · 8.0% mgmt
Financing live
Cash to close
- Down payment
- $37,500
- Closing costs
- $4,500
- Reserves months
- —
- Total cash needed
- —
Loan-product check · same deal, 3 products live
Conventional
25% down · 7.5% · 30yr
- Down + closing
- —
- Monthly P&I
- —
- Monthly cashflow
- —
- DSCR
- —
- Eligible?
- —
Personal DTI + credit; lowest rate.
DSCR
20% down · 8.5% · 30yr
- Down + closing
- —
- Monthly P&I
- —
- Monthly cashflow
- —
- DSCR
- —
- Eligible?
- —
No personal income docs; deal must DSCR.
Hard money
10% down · 12.0% · 12mo
- Down + closing
- —
- Monthly P&I
- —
- Monthly cashflow
- —
- DSCR
- —
- Eligible?
- —
Short-term bridge; refi at stabilization.
Listing history 29 events
-
2026-06-21pricedays on market $150,000 Active 182 DOM
-
2026-06-18days on market $175,000 Active 179 DOM
-
2026-06-17days on market $175,000 Active 178 DOM
-
2026-06-16days on market $175,000 Active 177 DOM
-
2026-06-15days on market $175,000 Active 176 DOM
-
2026-06-13days on market $175,000 Active 174 DOM
-
2026-06-13days on market $175,000 Active 173 DOM
-
2026-06-09days on market $175,000 Active 170 DOM
-
2026-06-08days on market $175,000 Active 169 DOM
-
2026-06-07days on market $175,000 Active 168 DOM
-
2026-06-04days on market $175,000 Active 165 DOM
-
2026-06-03days on market $175,000 Active 164 DOM
-
2026-06-02days on market $175,000 Active 163 DOM
-
2026-06-01days on market $175,000 Active 162 DOM
-
2026-05-31days on market $175,000 Active 161 DOM
-
2025-12-21$175,000 Active 746-char remark
Show marketing remark (746 chars)
Oversized Dual-Lot Property with Income Potential This unique, UNRESTRICTED property features two lots, each with city water, electric meters, septic tanks, and RV hookups with sewer input—ideal for creating two income-producing homes. The home includes 3 bedrooms, 2 bathrooms, handicap-accessible features, and a shared kitchen and living area setup. NEW wrap-around metal-covered porch with wood treated railing, NEW metal carport with gates, two concrete driveways, partial fenced yard, and a shed. Ready for your personal touch, this home is sold AS-IS. Public lake access to LAKE CONROE and to Scott’s Ridge Park both minutes away. Short distance from Montgomery shopping and local restaurants. Highly rated Montgomery schools.
-
2025-12-21historical
Show marketing remark (746 chars)
Oversized Dual-Lot Property with Income Potential This unique, UNRESTRICTED property features two lots, each with city water, electric meters, septic tanks, and RV hookups with sewer input—ideal for creating two income-producing homes. The home includes 3 bedrooms, 2 bathrooms, handicap-accessible features, and a shared kitchen and living area setup. NEW wrap-around metal-covered porch with wood treated railing, NEW metal carport with gates, two concrete driveways, partial fenced yard, and a shed. Ready for your personal touch, this home is sold AS-IS. Public lake access to LAKE CONROE and to Scott’s Ridge Park both minutes away. Short distance from Montgomery shopping and local restaurants. Highly rated Montgomery schools.
-
2025-09-29$175,000 Active
-
2025-09-29historical
-
2025-07-10price $190,000
-
2025-04-30price $210,000
-
2025-03-27$220,000 Active
-
2020-08-26soldstatus
-
2020-08-25soldstatus Sold
-
2020-08-19status Pending
-
2020-07-28$55,000 Active
-
2009-10-06soldstatus
-
2003-04-28soldstatus
-
2003-04-16soldstatus
ⓘ Source: listings_history table (triggers on properties + properties_extension) + one-shot
backfill from property_details.listing_events for pre-trigger history.
Tax reassessment forecast TX · Resets to sale price
- Current annual tax
- $2,133 · $178/mo
- Projected year-2 tax
- $2,745 · $229/mo
- Expected delta
- +$612/yr (+$51/mo · 28.7%)
ⓘ Screening estimate from a state-policy table — verify with the county assessor before closing.
Climate risk First Street
- Flood 8/10 Severe FEMA zone X (unshaded) · 99% chance over 30 yrs
- Wildfire 3/10 Moderate
- Heat 8/10 Severe 7 d/yr ≥111°F today · 24 d/yr by 30 yrs out
- Wind 8/10 Severe 99% chance of damaging wind over 30 yrs
- Air quality 2/10 Low 1 unhealthy d/yr today · 1 by 30 yrs out
Nearby sold comps map
Loading sold comps map…
Walkable amenities ~0.75 mi
Loading nearby amenities…
Taxation est. · year 1
- Rental income
- $24,079
- − Mortgage interest
- −$8,402
- − Property taxes
- −$2,133
- − Insurance
- −$1,547
- − Repairs & maintenance
- −$1,926
- − Management
- −$1,926
- − Depreciation
- −$4,364
- Taxable income
- $3,780
- Est. tax owed @ 24.0%
- −$907
- After-tax cash flow
- $4,995/yr
For passive investors: Depreciation is non-cash, so a rental often shows a tax loss while cash-flowing — sheltering income. Rental losses are passive: they offset passive income freely, and up to $25,000/yr can offset ordinary (W-2) income if you actively participate and your MAGI is under $100k (phasing out to $0 by $150k); unused losses carry forward. On sale, claimed depreciation is recaptured at up to 25%, and gains may owe capital-gains tax (a 1031 exchange can defer both). Figures are a year-1 estimate at your 24.0% rate — not tax advice; consult a CPA.
Schools (NCES district)
- District
- Montgomery ISD
- NCES district ID
- 4831260
- Math proficiency
- 63% ▼ -3.00%
- Reading proficiency
- 57% ▼ -3.00%
- Median HH income
- $75,596
- Composite
- 53.55/100
- National rank
- #1445
- State rank
- #49 of 826 in TX
Livability — Montgomery
- Score
- 70/100
- State rank
- #372
- US rank
- #7894
Category grades
Schools grade is shown separately in the Schools card above.
Census & demographics
- County
- Montgomery County · 663,713 people
- City population
- 67,277
- Metro
- Houston-The Woodlands-Sugar Land, TX
- Population (ZIP)
- 32,583
- Household income
- $106,804
- Rent vs Own
- Severe rent burden
- 414.0
Population outlook (Montgomery County) Hauer SSP2
- Today (2025)
- 713,896 people
- By 2030
- 805,263 · +12.8%
- By 2040
- 992,708 · +39.1%
- By 2050
- 1,179,590 · +65.2%
- By 2075
- 1,628,084 · +128.1%
- By 2100
- 1,937,880 · +171.5%
Race, ethnicity, and origin ACS 2023
- Neighborhood character
- Predominantly White (87%)
- Race & ethnicity
- White 87% Two or more races 5% Hispanic / Latino 5% Black 4%
- Common ancestry
- Lithuanian 8% Slovak 2% Romanian 2%
- Foreign-born
- 3% · Canada, China
- Languages at home
- 96% English-only · Spanish 3%
Political lean MEDSL · Montgomery
- 2024 margin
- Solid R (+45.5) · D 26.8% · R 72.3%
- 2008→2024 swing
- +7.2pp toward D · 2008: -52.7pp · 2024: -45.5pp
- All cycles
- 2024: R+45.5 2020: R+43.8 2016: R+51.4 2012: R+60.7 2008: R+52.7
Not yet ingested
- Civics
- —
Market trends
- HPI YoY
- ▼ -101.28%
- Current HPI
- 233.0032
- Rent YoY
- ▼ -3.30%
- Metro
- Houston-The Woodlands-Sugar Land, TX
- State GDP YoY
- ▲ 3.95%
- F500 in state
- 110
Industry mix (Fortune 500 HQ in TX)
| Industry | F500 HQs | Revenue |
|---|---|---|
| Energy | 16 | $1,198B |
|
||
| Technology | 5 | $198B |
|
||
| Engineering / Construction | 4 | $72B |
|
||
| Energy Services | 3 | $60B |
|
||
| Utilities | 3 | $41B |
|
||
| Healthcare | 2 | $330B |
|
||
Price history
+218.2% since first listed14 events — show timeline
- 2025-12-21 Listing Removed — HARMLS
- 2025-12-21 Listed $175,000 HARMLS
- 2025-09-29 Listing Removed — HARMLS
- 2025-09-29 Listed $175,000 HARMLS
- 2025-07-10 Price Changed $190,000 HARMLS
- 2025-04-30 Price Changed $210,000 HARMLS
- 2025-03-27 Listed $220,000 HARMLS
- 2020-08-26 Sold (Public Records) — Public Records
- 2020-08-25 Sold (MLS) — HARMLS
- 2020-08-19 Pending — HARMLS
- 2020-07-28 Listed $55,000 HARMLS
- 2009-10-06 Sold (Public Records) — Public Records
- 2003-04-28 Sold (Public Records) — Public Records
- 2003-04-16 Sold (Public Records) — Public Records
Property tax history
+6.7%/yrLatest (2025): $2,133 · +10.1% YoY. Source: county tax records.
Cash-flow waterfall
monthlySold comps — $/sqft
last 12 mo · ≤1 miLoading sold comps…