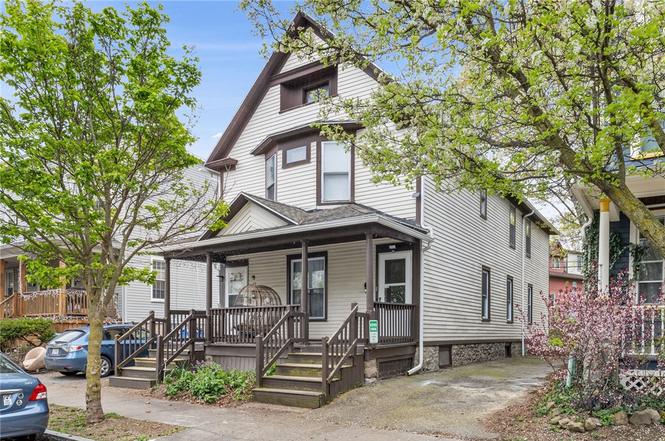
93 Asbury St · Rochester, NY
Flood risk 1/10 · Minimal
- FEMA flood zone
- X (unshaded)
- Chance of flooding over 30 yrs
- 0.0%
- Est. flood insurance / yr
- $473 – $860
Fire risk 1/10 · Minimal
- Est. fire insurance / yr
- $691 – $1,283
Heat risk 2/10 · Minimal
- Hot days now (above 95°F)
- 7 days/yr
- Hot days in 30 yrs
- 15 days/yr
Wind risk 1/10 · Minimal
- Chance of severe wind over 30 yrs
- —
Air-quality risk 2/10 · Minimal
- Unhealthy air days now
- 1 days/yr
- Unhealthy air days in 30 yrs
- 1 days/yr
Risk factors via First Street. Map © Google.
Why this score? — see what drove the C grade
The composite is a weighted blend of 9 inputs, each scored 0–100. Each bar is that input's sub-score; the figure is the points it added to the 100-point composite (weight × sub-score).
- Cash flow +20.6/30.0
- ARV discount +15.0/15.0
- DSCR +6.6/10.0
- 1% rule +5.4/10.0
- Livability +3.8/5.0
- Rent growth +2.8/5.0
- Condition / age +2.5/5.0
- Schools +1.9/10.0
- Appreciation +0.0/10.0
$239,900
🖨 Deal sheet 📄 Offer letter ✓ Due diligence
Listing remarks MLS
Boston Double in the very popular Swillburg/South Wedge/Highland Park Area. 6 YEAR OLD TEAR OFF ROOF. New vinyl windows throughout first floor unit.
Key facts
- Functional layouts
- Easy access to parks
- Spacious units
Tags
Property features AI
Finance
- Financial info: Property configured as a 2-unit building; Gross annual income reported at $43,200; Operating expenses include insurance, maintenance, and water/sewer; One unit currently leased (lease expires January 1, 2027); Both units have lease expiration dates listed as January 1, 2027; Owner pays trash collection; tenants pay all utilities; rent includes trash collection
Exterior
- Parking: Paved parking area
- Utilities: Electricity connected; Public water connected; Sewer connected
- Home design: Two-story multi-family property; Resale condition
- Construction: Vinyl siding; Asphalt roof; Existing structure
- Exterior features: Rectangular residential lot (approx. 40 x 78); City street frontage; Paved parking
Interior
- Kitchen: Gas water heater (appliance listed)
- Bedrooms: One unit with 3 bedrooms; One unit with 2 bedrooms
- Flooring: Hardwood; Luxury vinyl; Varied flooring
- Bathrooms: Two full bathrooms (total)
- Heating & cooling: Gas forced-air heating
- Interior features: Hardwood and luxury vinyl flooring with some variation throughout; Full basement
- Laundry & utility: Separate electric meters for each unit; Separate gas meters for each unit
Neighborhood map
What this means for you Summary
Snapshot
- This is a 5-bed/2.0-bath townhouse listed at $240k.
Deal economics
- At list price, monthly cash flow is $322 ($4k/yr) — positive.
- The deal already cash-flows at list — no discount required.
- Meets the 1% rule at list price ($3k rent vs $240k).
Location & tenants
- Location reads 76/100 on livability (#222 in NY, #3,482 nationally) — a middle-class / working-renter tenant base. Strengths: commute A+, cost of living A+, housing A+; Watch: schools D+, crime F, employment F.
- Rochester City School District (urban): math 21% / reading 26% proficiency, ranked #589 of 590 in NY (top 100%) — low school quality limits family demand, transient renter base, plan for 1-2y turnover; 82% free/reduced lunch — lower-income household profile, screen leases tightly.
- Market conditions: Rents rising (+1.2%/yr); 74 active listings in the ZIP; 2 comparable units currently listed for rent nearby; 1,169 units permitted in Monroe County in 2024 (591 in 5+ unit buildings).
- At $2,506/mo this rent would consume 49% of the median local household income ($62k/yr) (locally 2013% of renters already pay >50% of income on rent) — very limited rent-growth headroom before tenants either downsize or default.
Forward outlook
- Local home prices are declining (-3.0%/yr); year-one equity from $2k of loan paydown is wiped out by about $7k of value loss. Plan a longer hold.
- Monroe County population projected to shrink 6% by 2050 — rents likely to lag national; underwrite the cash flow, not the appreciation.
Negotiation context
- Only 3 days on market — expect competitive offers; lowballing is unlikely to land.
- 7 sale attempts since 8y ago with the ask held roughly flat each time — persistent listings suggest the price (not the market) is what's stuck; bring a comps-based counter.
Risks & watch-outs
- Watch-outs: built in 1900 — expect roof / HVAC / electrical / plumbing capex.
Questions for the listing agent
- Built in 1900 — when were the roof, HVAC, electrical panel, plumbing, and water heater last replaced?
- Is there a deadline driving the sale (1031 exchange, divorce, estate, relocation)? That informs how much negotiation room exists.
- Schools are D-rated, which usually means shorter tenancies and higher turnover. Who's the typical renter profile here, and what's been the actual vacancy rate?
- Crime grade is F in this area — have there been break-ins, vandalism, or insurance claims at this property in the last 3 years? What carrier currently insures it and at what premium?
- What's the average days-on-market for RENTAL listings here right now (not sales)? A rising rental-DOM trend means longer vacancies and softer asking-rent achievability than the comps imply.
- What's the recent tenant-quality profile in this submarket — average credit score on applications, eviction rate, late-payment / NSF rate, and stable-employment percentage? A property-management company in the area should have these aggregated.
- How much new for-sale + rental construction is in the pipeline within 1–3 miles? Heavy new supply typically softens prices + rents 12–24 months out; constrained supply supports both.
Investment metrics
- 1% rule
- 1.04% ✓
- Cap rate
- 7.90%
- Cash-on-cash
- 5.75%
- DSCR
- 1.26
- GRM
- 8.0
CMA / ARV
- ARV (on-the-fly)
- $312,771
- Comps found
- 12
Show comp detail 12 sales within ~0.75 mi
| Address | Dist | Beds/Ba | Sqft | Sold | Price | $/sf | Match |
|---|---|---|---|---|---|---|---|
| 308 Field St | 0.13mi | 5/2.0 | 2,105 (-8%) | 6mo | $296,000 | $141 | 76 |
| 64 Benton St | 0.48mi | 5/2.0 | 2,231 (-2%) | 13mo | $180,000 | $81 | 63 |
| 478 Pearl St | 0.39mi | 4/2.0 (-1) | 2,308 (+1%) | 17mo | $242,500 | $105 | 60 |
| 14-16 Boardman St | 0.45mi | 4/2.0 (-1) | 2,016 (-12%) | 2mo | $305,000 | $151 | 53 |
| 10 Boardman St | 0.45mi | 4/2.0 (-1) | 2,016 (-12%) | 2mo | $315,000 | $156 | 52 |
| 47 Nicholson St | 0.61mi | 4/2.0 (-1) | 2,190 (-4%) | 12mo | $299,900 | $137 | 50 |
| 484-488 Caroline St | 0.19mi | 4/2.5 (-1) | 1,944 (-15%) | 14mo | $297,000 | $153 | 47 |
| 11-11.5 Bly St | 0.16mi | 4/2.0 (-1) | 1,942 (-15%) | 18mo | $190,000 | $98 | 47 |
| 20 Alliance Ave | 0.55mi | 4/3.0 (-1) | 2,420 (+6%) | 10mo | $240,000 | $99 | 47 |
| 141 Rosedale St #2 | 0.45mi | 6/2.0 (+1) | 2,589 (+13%) | 10mo | $349,500 | $135 | 43 |
| 32 Cornell St | 0.56mi | 4/3.0 (-1) | 2,191 (-4%) | 18mo | $320,000 | $146 | 43 |
| 370 Pearl St | 0.49mi | 5/2.0 | 2,584 (+13%) | 21mo | $240,000 | $93 | 38 |
Match score weights: distance 35% · size 25% · config 20% · recency 20%. Top-matched comps best support the ARV.
Projected returns pro-forma
-3.0% appreciation · 1.2% rent growth · sell at horizon
- IRR
- -9.4%
- Equity multiple
- 0.66×
- Total profit
- $-22,802
- Equity at exit
- $35,770
- IRR
- -2.6%
- Equity multiple
- 0.84×
- Total profit
- $-10,960
- Equity at exit
- $20,742
Cash invested: $67,172 (down + closing). Projections, not guarantees.
Landlord ↔ Tenant lean methodology
- Overall (STATE)
- 15 Strongly Tenant-Friendly
- State New York
- 15 Strongly Tenant-Friendly · D+10
- County
- — inherits STATE
- City
- — inherits STATE
ZIP-level market 14620
- Home prices YoY
- -20.1%
- Rents YoY
- 1.2%
- Active inventory
- 74
- Price-to-rent
- 8.0×
Monthly cashflow live
- Estimated rent
- $2,506 medium interval (Pro) →
- Mortgage (P&I)
- −$1,258
- Tax est. 1.5%
- −$300 /mo · $3,598/yr
- Insurance
- −$100
- HOA
- −$0
- Vacancy / Maint / Mgmt
- −$526
- Net cashflow
- $322
Break-even live
UW: 25.0% down · 7.5% · 30yr · 1.5% tax · 5.0% vac · 8.0% maint · 8.0% mgmt
Financing live
Cash to close
- Down payment
- $59,975
- Closing costs
- $7,197
- Reserves months
- —
- Total cash needed
- —
Loan-product check · same deal, 3 products live
Conventional
25% down · 7.5% · 30yr
- Down + closing
- —
- Monthly P&I
- —
- Monthly cashflow
- —
- DSCR
- —
- Eligible?
- —
Personal DTI + credit; lowest rate.
DSCR
20% down · 8.5% · 30yr
- Down + closing
- —
- Monthly P&I
- —
- Monthly cashflow
- —
- DSCR
- —
- Eligible?
- —
No personal income docs; deal must DSCR.
Hard money
10% down · 12.0% · 12mo
- Down + closing
- —
- Monthly P&I
- —
- Monthly cashflow
- —
- DSCR
- —
- Eligible?
- —
Short-term bridge; refi at stabilization.
Rent comps 2 comps
| Address | Beds | Baths | Sqft | Rent | $/sqft | DOM | Units | Dist |
|---|---|---|---|---|---|---|---|---|
| 34 Shepard St Rochester, NY | 4.0 | 1.5 | 2347 | $800 | $0.34 | 43d | 1 | 0.46mi |
| 95 Parkwood Ave Rochester, NY | 5.0 | 2.5 | 2000 | $3,900 | $1.95 | 11d | 1 | 0.57mi |
Listing history 4 events
-
2026-06-18days on market $239,900 Active 3 DOM
-
2026-06-17days on market $239,900 Active 2 DOM
-
2026-06-15remarks 699-char remark
-
2026-06-15$239,900 Active 1 DOM
ⓘ Source: listings_history table (triggers on properties + properties_extension) + one-shot
backfill from property_details.listing_events for pre-trigger history.
Climate risk First Street
- Flood 1/10 Low FEMA zone X (unshaded) · 0% chance over 30 yrs
- Wildfire 1/10 Low
- Heat 2/10 Low 7 d/yr ≥95°F today · 15 d/yr by 30 yrs out
- Wind 1/10 Low
- Air quality 2/10 Low 1 unhealthy d/yr today · 1 by 30 yrs out
Nearby sold comps map
Loading sold comps map…
Walkable amenities ~0.75 mi
Loading nearby amenities…
Taxation est. · year 1
- Rental income
- $30,071
- − Mortgage interest
- −$13,438
- − Property taxes
- −$3,598
- − Insurance
- −$1,200
- − Repairs & maintenance
- −$2,406
- − Management
- −$2,406
- − Depreciation
- −$6,979
- Taxable income
- $44
- Est. tax owed @ 24.0%
- −$11
- After-tax cash flow
- $3,850/yr
For passive investors: Depreciation is non-cash, so a rental often shows a tax loss while cash-flowing — sheltering income. Rental losses are passive: they offset passive income freely, and up to $25,000/yr can offset ordinary (W-2) income if you actively participate and your MAGI is under $100k (phasing out to $0 by $150k); unused losses carry forward. On sale, claimed depreciation is recaptured at up to 25%, and gains may owe capital-gains tax (a 1031 exchange can defer both). Figures are a year-1 estimate at your 24.0% rate — not tax advice; consult a CPA.
Schools (NCES district)
- District
- Rochester City School District
- NCES district ID
- 3624750
- Math proficiency
- 21% ▬ 0.00%
- Reading proficiency
- 26% ▲ 4.00%
- Median HH income
- $30,923
- Composite
- 18.98/100
- National rank
- #8850
- State rank
- #589 of 590 in NY
Livability — Rochester
- Score
- 76/100
- State rank
- #222
- US rank
- #3482
Category grades
Schools grade is shown separately in the Schools card above.
Census & demographics
- Census place
- Rochester, NY
- County
- Monroe County · 674,131 people
- City population
- 432,803
- Metro
- Rochester, NY
- Population (ZIP)
- 23,769
- Household income
- $61,783
- Rent vs Own
- Severe rent burden
- 2013.0
Population outlook (Monroe County) Hauer SSP2
- Today (2025)
- 759,460 people
- By 2030
- 757,154 · -0.3%
- By 2040
- 740,644 · -2.5%
- By 2050
- 714,443 · -5.9%
- By 2075
- 645,883 · -15.0%
- By 2100
- 547,084 · -28.0%
Race, ethnicity, and origin ACS 2023
- Neighborhood character
- Predominantly White (68%)
- Race & ethnicity
- White 68% Black 12% Asian 9% Hispanic / Latino 6% Two or more races 6%
- Hispanic origin (detail)
- Puerto Rican 3%
- Common ancestry
- Romanian 5% Iranian 3% Lithuanian 2%
- Foreign-born
- 13% · China, Canada, South Korea
- Languages at home
- 85% English-only · Chinese 4% Spanish 4% Other Indo-European 3%
Political lean MEDSL · Monroe
- 2024 margin
- D (+19.1) · D 59.5% · R 40.5%
- 2008→2024 swing
- +1.4pp toward D · 2008: 17.7pp · 2024: 19.1pp
- All cycles
- 2024: D+19.1 2020: D+21.0 2016: D+14.1 2012: D+17.4 2008: D+17.7
Not yet ingested
- Civics
- —
Market trends
- HPI YoY
- ▼ -84.77%
- Current HPI
- 337.6917
- Rent YoY
- ▲ 1.20%
- Metro
- Rochester, NY
- State GDP YoY
- ▲ 2.60%
- F500 in state
- 92
Industry mix (Fortune 500 HQ in NY)
| Industry | F500 HQs | Revenue |
|---|---|---|
| Financial Services | 10 | $950B |
|
||
| Consumer Goods | 9 | $162B |
|
||
| Insurance | 4 | $225B |
|
||
| Telecommunications | 2 | $144B |
|
||
| Pharmaceuticals | 2 | $112B |
|
||
| Media / Entertainment | 2 | $69B |
|
||
Price history
-0.0% since first listed19 events — show timeline
- 2026-06-15 Listed $239,900 UNYREIS
- 2023-09-26 Sold (MLS) $245,000 UNYREIS
- 2023-07-06 Pending — UNYREIS
- 2023-06-26 Price Changed $262,000 UNYREIS
- 2023-06-12 Listed $268,000 UNYREIS
- 2023-05-26 Listing Removed — UNYREIS
- 2023-05-12 Relisted — UNYREIS
- 2023-05-05 Pending — UNYREIS
- 2023-05-03 Listed $268,900 UNYREIS
- 2023-05-01 Pending — UNYREIS
- 2023-04-30 Listing Removed — UNYREIS
- 2023-04-24 Price Changed $269,900 UNYREIS
- 2023-04-09 Listed $289,900 UNYREIS
- 2019-01-25 Listing Removed — UNYREIS
- 2018-11-27 Listed $218,000 UNYREIS
- 2018-11-24 Listing Removed — UNYREIS
- 2018-10-02 Price Changed $220,000 UNYREIS
- 2018-08-31 Price Changed $230,000 UNYREIS
- 2018-08-26 Listed $240,000 UNYREIS
Cash-flow waterfall
monthlySold comps — $/sqft
last 12 mo · ≤1 miLoading sold comps…