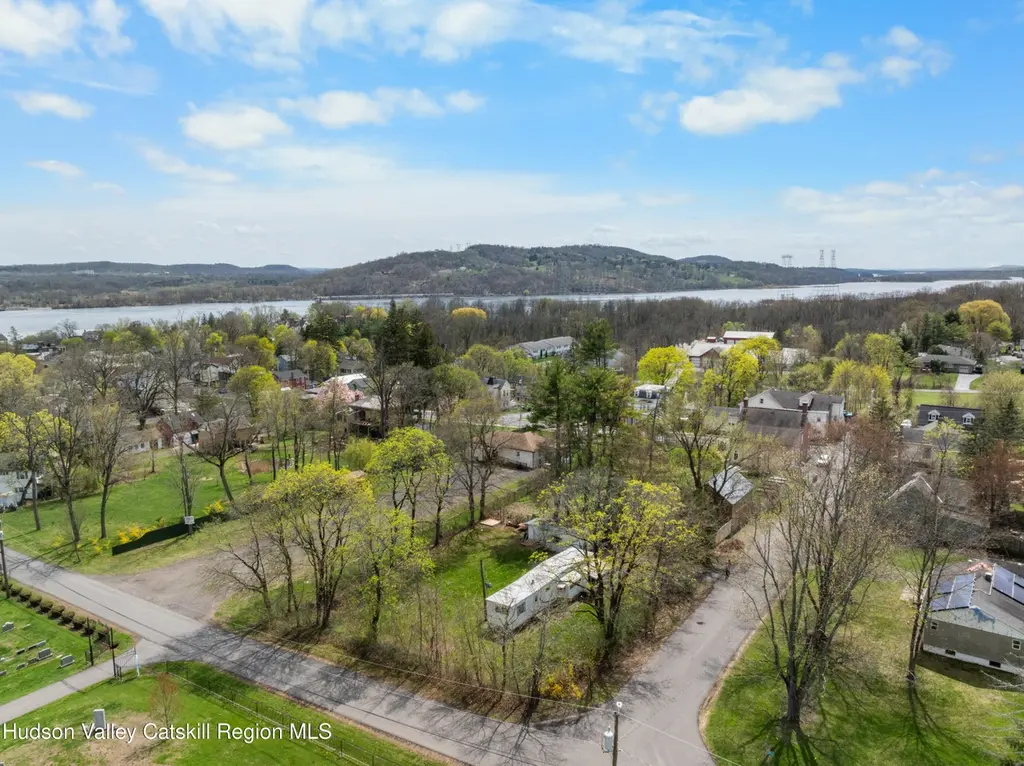
3 Wayne St · Athens, NY
Flood risk 1/10 · Minimal
- FEMA flood zone
- X (unshaded)
- Chance of flooding over 30 yrs
- 0.0%
- Est. flood insurance / yr
- $507 – $1,088
Fire risk 3/10 · Minor
- Est. fire insurance / yr
- $691 – $1,283
Heat risk 4/10 · Minor
- Hot days now (above 99°F)
- 7 days/yr
- Hot days in 30 yrs
- 17 days/yr
Wind risk 3/10 · Minor
- Chance of severe wind over 30 yrs
- 8.0%
Air-quality risk 2/10 · Minimal
- Unhealthy air days now
- 0 days/yr
- Unhealthy air days in 30 yrs
- 1 days/yr
Risk factors via First Street. Map © Google.
Why this score? — see what drove the B+ grade
The composite is a weighted blend of 9 inputs, each scored 0–100. Each bar is that input's sub-score; the figure is the points it added to the 100-point composite (weight × sub-score).
- Cash flow +30.0/30.0
- 1% rule +10.0/10.0
- DSCR +10.0/10.0
- Appreciation +8.0/10.0
- ARV discount +7.5/15.0
- Schools +4.3/10.0
- Livability +3.2/5.0
- Rent growth +2.5/5.0
- Condition / age +2.5/5.0
$129,900
🖨 Deal sheet (PDF) 📄 Offer letter ✓ Due diligence
Listing remarks
Welcome to 3 Wayne Street in the village of Athens, NY, an affordable and low maintenance opportunity perfect for first time buyers, downsizers, or weekend getaways in the Hudson Valley. This 1 bedroom, 1 bathroom manufactured home, built in 1963, sits on a manageable 0.3 acre lot, offering just the right amount of outdoor space for relaxing, gardening, or entertaining. Inside, you'll find a simple and functional layout designed for easy living, with comfortable living space and plenty of natural light throughout. The property includes a 1 car garage, providing convenient parking or additional storage. With municipal water and septic system already in place, this home offers a practical set
Key facts
- Quiet street
- Manageable lot
- Municipal water
Tags
Property features AI
Exterior
- Parking: 1-car garage
- Utilities: Public water; Public sewer; 100 Amp electric service
- Home design: Manufactured house (single wide); Residential property
- Construction: Block foundation
- Exterior features: Cleared lot; Garage(s) on property
Interior
- Kitchen: Free-standing refrigerator; Free-standing range
- Bathrooms: 1 full bathroom
- Heating & cooling: Forced air heating; Oil heating
- Interior features: Free-standing refrigerator; Free-standing range
- Laundry & utility: Washer; Laundry located in hall
Neighborhood map
What this means for you Summary
Snapshot
- This is a 1-bed/1.0-bath manufactured listed at $130k.
Deal economics
- At list price, monthly cash flow is $1k ($13k/yr) — positive.
- The deal already cash-flows at list — no discount required.
- Meets the 1% rule at list price ($2k rent vs $130k).
- Recommended offer: $126k (3.0% below list) — sets the bar for market timing.
Location & tenants
- Location reads 63/100 on livability (#785 in NY) — a middle-class / working-renter tenant base. Strengths: crime A+, housing A+; Watch: amenities F, commute F, health & safety D-.
- Coxsackie-Athens Central School District (town): math 43% / reading 56% proficiency, ranked #384 of 590 in NY (top 65%) — families likely to look elsewhere, expect single-tenant / working-renter base with shorter leases.
- Zoned schools: Edward J Arthur Elementary School (math 44% / reading 64%, grade C, #908 of 2,108 statewide, top 46%, 184 students, 40% FRL); Coxsackie-Athens Middle School (math 22% / reading 46%, grade F, #497 of 729 statewide, top 69%, 364 students, 41% FRL); Coxsackie-Athens High School (math 87% / reading 82%, grade A, #379 of 1,100 statewide, top 36%, 365 students, 0% FRL) — zoned schools at 27% FRL track the district average.
- Market conditions: 91 active listings in the ZIP; 3 comparable units currently listed for rent nearby; rentals lingering (median 45d on market — plan ~5-8 weeks vacancy on turnover, expect pricing pressure); 67% of comp listings sitting > 30 days — soft ceiling on asking rent; 97 units permitted in Greene County in 2024 (0 in 5+ unit buildings).
Forward outlook
- In year one you build about $9k of equity ($898 loan paydown + $8k appreciation (5.9% local appreciation)).
- Greene County population projected at -22% by 2050 — secular population decline; favor cash flow + early exit over multi-decade hold.
- At projected returns (5.9% appreciation + 3.0% rent growth), your $36k cash investment doubles in ~2 years — after that, you're playing with house money.
- By year 5, paydown + projected appreciation supports a ~$38k cash-out refi (75% LTV) — recoverable capital for the next deal without selling this one.
Negotiation context
- It's been on market 44 days — a 3% lower offer ($126k) is reasonable based on typical stale-listing flexibility.
- Current owner paid $25k; list at $130k implies a 420% gain — meaningful room to come down on a strong offer.
Questions for the listing agent
- It's been on market 44 days. Have you received any prior offers? Is the seller open to a 3% concession, seller financing, or rate buy-down credit?
- Built in 1963 — when were the roof, HVAC, electrical panel, plumbing, and water heater last replaced?
- Is there a deadline driving the sale (1031 exchange, divorce, estate, relocation)? That informs how much negotiation room exists.
- Schools are F-rated, which usually means shorter tenancies and higher turnover. Who's the typical renter profile here, and what's been the actual vacancy rate?
- What's the average days-on-market for RENTAL listings here right now (not sales)? A rising rental-DOM trend means longer vacancies and softer asking-rent achievability than the comps imply.
- What's the recent tenant-quality profile in this submarket — average credit score on applications, eviction rate, late-payment / NSF rate, and stable-employment percentage? A property-management company in the area should have these aggregated.
- How much new for-sale + rental construction is in the pipeline within 1–3 miles? Heavy new supply typically softens prices + rents 12–24 months out; constrained supply supports both.
Investment metrics
- 1% rule
- 1.85% ✓
- Cap rate
- 15.99%
- Cash-on-cash
- 34.62%
- DSCR
- 2.54
- GRM
- 4.5
CMA / ARV
No comps found within radius.
Projected returns pro-forma
5.93% appreciation · 3.0% rent growth · sell at horizon
- IRR
- 44.8%
- Equity multiple
- 3.85×
- Total profit
- $103,759
- Equity at exit
- $81,043
- IRR
- 41.9%
- Equity multiple
- 7.96×
- Total profit
- $253,036
- Equity at exit
- $146,437
Cash invested: $36,372 (down + closing). Projections, not guarantees.
Landlord ↔ Tenant lean methodology
- Overall (STATE)
- 15 Strongly Tenant-Friendly
- State New York
- 15 Strongly Tenant-Friendly · D+10
- County
- — inherits STATE
- City
- — inherits STATE
ZIP-level market 12015
- Home prices YoY
- 1.4%
- Active inventory
- 91
- Price-to-rent
- 4.5×
Monthly cashflow live
- Estimated rent
- $2,400 medium interval (Pro) →
- Mortgage (P&I)
- −$681
- Tax from tax record
- −$111 /mo · $1,337/yr
- Insurance
- −$54
- HOA
- −$0
- Vacancy / Maint / Mgmt
- −$504
- Net cashflow
- $1,049
Break-even live
Sensitivity live
| Price | -10% $1,123 | -5% $1,086 | +0% $1,049 | +5% $1,013 | +10% $976 |
|---|---|---|---|---|---|
| Rent | -10% $860 | -5% $954 | +0% $1,049 | +5% $1,144 | +10% $1,239 |
| Rate | -1.0pp $1,115 | -0.5pp $1,082 | base $1,049 | +0.5pp $1,016 | +1.0pp $981 |
UW: 25.0% down · 7.5% · 30yr · 1.5% tax · 5.0% vac · 8.0% maint · 8.0% mgmt
Financing live
Cash to close
- Down payment
- $32,475
- Closing costs
- $3,897
- Reserves months
- —
- Total cash needed
- —
Loan-product check · same deal, 3 products live
Conventional
25% down · 7.5% · 30yr
- Down + closing
- —
- Monthly P&I
- —
- Monthly cashflow
- —
- DSCR
- —
- Eligible?
- —
Personal DTI + credit; lowest rate.
DSCR
20% down · 8.5% · 30yr
- Down + closing
- —
- Monthly P&I
- —
- Monthly cashflow
- —
- DSCR
- —
- Eligible?
- —
No personal income docs; deal must DSCR.
Hard money
10% down · 12.0% · 12mo
- Down + closing
- —
- Monthly P&I
- —
- Monthly cashflow
- —
- DSCR
- —
- Eligible?
- —
Short-term bridge; refi at stabilization.
Rent comps 3 comps
| Address | Beds | Baths | Sqft | Rent | $/sqft | DOM | Units | Dist |
|---|---|---|---|---|---|---|---|---|
| 208 Warren St Unit 1 Hudson, NY | 1.0 | 1.0 | 700 | $2,800 | $4.00 | 45d | 1 | 1.18mi |
| 208 Warren St Unit 3 Hudson, NY | 1.0 | 1.0 | 700 | $2,250 | $3.21 | 45d | 1 | 1.18mi |
| 208 Warren St Unit 5 Hudson, NY | 1.0 | 1.0 | 700 | $2,150 | $3.07 | 25d | 1 | 1.18mi |
Listing history 7 events
-
2026-06-02status $129,900 Pending 44 DOM
-
2026-06-01days on market $129,900 Active Under Contract 44 DOM
-
2026-05-31days on market $129,900 Active Under Contract 43 DOM
-
2026-05-31days on market $129,900 Active Under Contract 42 DOM
-
2026-04-20historical Active Under Contract
-
2026-04-17$129,900 Active
-
2015-05-21soldstatus $25,000
ⓘ Source: listings_history table (triggers on properties + properties_extension) + one-shot
backfill from property_details.listing_events for pre-trigger history.
Tax reassessment forecast NY · Partial reset (capped growth)
- Current annual tax
- $1,337 · $111/mo
- Projected year-2 tax
- $1,766 · $147/mo
- Expected delta
- +$429/yr (+$36/mo · 32.1%)
ⓘ Screening estimate from a state-policy table — verify with the county assessor before closing.
Climate risk First Street
- Flood 1/10 Low FEMA zone X (unshaded) · 0% chance over 30 yrs
- Wildfire 3/10 Moderate
- Heat 4/10 Moderate 7 d/yr ≥99°F today · 17 d/yr by 30 yrs out
- Wind 3/10 Moderate 8% chance of damaging wind over 30 yrs
- Air quality 2/10 Low 0 unhealthy d/yr today · 1 by 30 yrs out
Nearby sold comps map
Loading sold comps map…
Walkable amenities ~0.75 mi
Loading nearby amenities…
Taxation est. · year 1
- Rental income
- $28,800
- − Mortgage interest
- −$7,276
- − Property taxes
- −$1,337
- − Insurance
- −$650
- − Repairs & maintenance
- −$2,304
- − Management
- −$2,304
- − Depreciation
- −$3,779
- Taxable income
- $11,151
- Est. tax owed @ 24.0%
- −$2,676
- After-tax cash flow
- $9,915/yr
For passive investors: Depreciation is non-cash, so a rental often shows a tax loss while cash-flowing — sheltering income. Rental losses are passive: they offset passive income freely, and up to $25,000/yr can offset ordinary (W-2) income if you actively participate and your MAGI is under $100k (phasing out to $0 by $150k); unused losses carry forward. On sale, claimed depreciation is recaptured at up to 25%, and gains may owe capital-gains tax (a 1031 exchange can defer both). Figures are a year-1 estimate at your 24.0% rate — not tax advice; consult a CPA.
Schools (NCES district)
- District
- Coxsackie-Athens Central School District
- NCES district ID
- 3608490
- Math proficiency
- 43% ▼ -1.00%
- Reading proficiency
- 56% ▲ 19.00%
- Median HH income
- $55,006
- Composite
- 42.8/100
- National rank
- #3143
- State rank
- #384 of 590 in NY
Livability — Athens
- Score
- 63/100
- State rank
- #785
- US rank
- #15102
Category grades
Schools grade is shown separately in the Schools card above.
Census & demographics
- Census place
- Athens, NY
- Population (ZIP)
- 4,084
Population outlook (Greene County) Hauer SSP2
- Today (2025)
- 44,963 people
- By 2030
- 43,126 · -4.1%
- By 2040
- 38,756 · -13.8%
- By 2050
- 34,913 · -22.4%
- By 2075
- 28,156 · -37.4%
- By 2100
- 22,296 · -50.4%
Race, ethnicity, and origin ACS 2023
- Neighborhood character
- Predominantly White (79%)
- Race & ethnicity
- White 79% Two or more races 10% Hispanic / Latino 7% Asian 3% Black 1%
- Hispanic origin (detail)
- Mexican 4% Dominican 2%
- Common ancestry
- Romanian 3% Iranian 3% Scotch-Irish 2%
- Foreign-born
- 11% · Canada, South Korea, Vietnam
- Languages at home
- 90% English-only · Russian/Polish/Slavic 5% Other Indo-European 2% Spanish 1%
Political lean MEDSL · Greene
- 2024 margin
- R (+17.0) · D 41.5% · R 58.5%
- 2008→2024 swing
- -7.1pp toward R · 2008: -9.9pp · 2024: -17.0pp
- All cycles
- 2024: R+17.0 2020: R+15.6 2016: R+27.4 2012: R+11.1 2008: R+9.9
Not yet ingested
- Civics
- —
Market trends
- HPI YoY
- ▲ 5.93%
- Current HPI
- 426.3034
- Rent YoY
- —
- Metro
- —
- State GDP YoY
- ▲ 2.60%
- F500 in state
- 92
Industry mix (Fortune 500 HQ in NY)
| Industry | F500 HQs | Revenue |
|---|---|---|
| Financial Services | 10 | $950B |
|
||
| Consumer Goods | 9 | $162B |
|
||
| Insurance | 4 | $225B |
|
||
| Telecommunications | 2 | $144B |
|
||
| Pharmaceuticals | 2 | $112B |
|
||
| Media / Entertainment | 2 | $69B |
|
||
Price history
+419.6% since first listed3 events — show timeline
- 2026-04-20 Contingent — HVCRMLS
- 2026-04-17 Listed $129,900 HVCRMLS
- 2015-05-21 Sold (Public Records) $25,000 Public Records
Property tax history
+2.1%/yrLatest (2025): $1,337 · +3.3% YoY. Source: county tax records.
Cash-flow waterfall
monthlySold comps — $/sqft
last 12 mo · ≤1 miLoading sold comps…