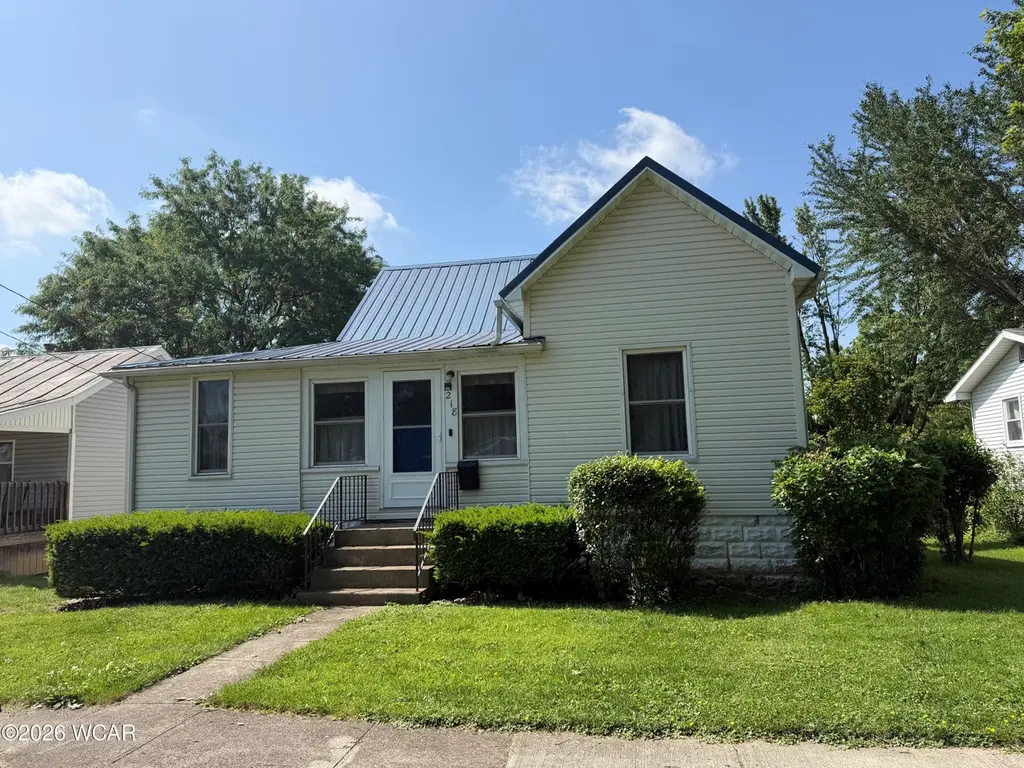
218 E Raymond St · Van Wert, OH
Flood risk 8/10 · Major
- FEMA flood zone
- X (unshaded)
- Chance of flooding over 30 yrs
- 0.99%
- Est. flood insurance / yr
- $473 – $860
Fire risk 1/10 · Minimal
- Est. fire insurance / yr
- $713 – $1,323
Heat risk 3/10 · Minor
- Hot days now (above 100°F)
- 7 days/yr
- Hot days in 30 yrs
- 18 days/yr
Wind risk 2/10 · Minimal
- Chance of severe wind over 30 yrs
- —
Air-quality risk 2/10 · Minimal
- Unhealthy air days now
- 1 days/yr
- Unhealthy air days in 30 yrs
- 2 days/yr
Risk factors via First Street. Map © Google.
Why this score? — see what drove the D+ grade
The composite is a weighted blend of 9 inputs, each scored 0–100. Each bar is that input's sub-score; the figure is the points it added to the 100-point composite (weight × sub-score).
- Cash flow +16.4/30.0
- ARV discount +9.4/15.0
- DSCR +5.1/10.0
- Schools +4.0/10.0
- Livability +3.6/5.0
- 1% rule +3.4/10.0
- Rent growth +2.5/5.0
- Condition / age +2.5/5.0
- Appreciation +0.0/10.0
$145,900
🖨 Deal sheet (PDF) 📄 Offer letter ✓ Due diligence
Listing remarks
Take a look at this charming 2-bedroom home priced at just $145,900! Offering a spacious layout with a large living room, generous kitchen, and dedicated dining room, this home provides plenty of room for comfortable everyday living. The property also features a full bathroom, an impressive 24' x 30' detached garage with ample space for vehicles, storage, or hobbies, and a valuable bonus--solar panels already installed on the roof to help improve energy efficiency and reduce utility costs. This is a great opportunity to own a home that combines comfort, functionality, and added savings!
Key facts
- Solar panels
- Detached garage
- 6,600 sq ft lot
Tags
Property features AI
Exterior
- Parking: Attached 2-car garage with garage door opener
- Utilities: Public water; Public sewer
- Home design: Single family residence; Residential property type
- Construction: Vinyl siding; Block foundation
- Exterior features: Lot approximately 50 x 132; Residential zoning
Interior
- Kitchen: Range; Microwave; Refrigerator
- Flooring: Carpet; Other
- Bathrooms: 1 full bathroom
- Heating & cooling: Central air conditioning; Forced air heating; Natural gas heating; Solar heating
- Interior features: Block and concrete basement; Washer and dryer included; Microwave, range and refrigerator included; Water heater included
- Laundry & utility: Washer; Dryer; Water heater
Neighborhood map
What this means for you Summary
Snapshot
- This is a 2-bed/1.0-bath single-family listed at $146k.
Deal economics
- At list price, monthly cash flow is $26 ($318/yr) — positive.
- The deal already cash-flows at list — no discount required.
- To meet the 1% rule (rent ≥ 1% of price), the offer needs to be $122k (16.2% below list).
- Recommended offer: $122k (16.2% below list) — sets the bar for 1% rule.
- Cap rate 7.0% vs local median 4.7% in Van Wert — top-decile yield for the area; either an underpriced asset or a hidden risk that comps aren't pricing in. Stress-test before assuming the spread holds.
Location & tenants
- Location reads 72/100 on livability (#392 in OH) — a middle-class / working-renter tenant base. Strengths: cost of living A+, housing A+, health & safety A-; Watch: crime D+, amenities F, commute F.
- Van Wert City (rural): math 46% / reading 50% proficiency, ranked #476 of 656 in OH (top 73%) — families likely to look elsewhere, expect single-tenant / working-renter base with shorter leases.
- Market conditions: 46 active listings in the ZIP; 2 comparable units currently listed for rent nearby; 44 units permitted in Van Wert County in 2024 (0 in 5+ unit buildings).
Forward outlook
- Local home prices are declining (-3.0%/yr); year-one equity from $1k of loan paydown is wiped out by about $4k of value loss. Plan a longer hold.
- Van Wert County population projected at -11% by 2050 — secular population decline; favor cash flow + early exit over multi-decade hold.
Negotiation context
- Only 11 days on market — expect competitive offers; lowballing is unlikely to land.
Risks & watch-outs
- Watch-outs: flood insurance adds $56/mo; built in 1900 — expect roof / HVAC / electrical / plumbing capex.
- Climate carrying-cost: severe flood risk — expect insurance premiums to compound above CPI over the hold.
Questions for the listing agent
- Built in 1900 — when were the roof, HVAC, electrical panel, plumbing, and water heater last replaced?
- What's the actual annual flood-insurance premium (NFIP or private), and is the property in a SFHA with mandatory coverage?
- Is there a deadline driving the sale (1031 exchange, divorce, estate, relocation)? That informs how much negotiation room exists.
- Schools are B-rated — typically a magnet for longer-tenancy family renters. What's the average tenant stay here, and is there a school-zone premium baked into asking?
- Crime grade is D in this area — have there been break-ins, vandalism, or insurance claims at this property in the last 3 years? What carrier currently insures it and at what premium?
- The area grade is low — what's the realistic commute time and amenity access for the typical tenant pool here? Any planned neighborhood developments (good or bad) we should know about?
- What's the average days-on-market for RENTAL listings here right now (not sales)? A rising rental-DOM trend means longer vacancies and softer asking-rent achievability than the comps imply.
- What's the recent tenant-quality profile in this submarket — average credit score on applications, eviction rate, late-payment / NSF rate, and stable-employment percentage? A property-management company in the area should have these aggregated.
- How much new for-sale + rental construction is in the pipeline within 1–3 miles? Heavy new supply typically softens prices + rents 12–24 months out; constrained supply supports both.
Investment metrics
- 1% rule
- 0.84% ✗
- Cap rate
- 6.97%
- Cash-on-cash
- 2.41%
- DSCR
- 1.11
- GRM
- 9.9
CMA / ARV
- ARV (on-the-fly)
- $152,438
- Comps found
- 12
Show comp detail 12 sales within ~0.75 mi
| Address | Dist | Beds/Ba | Sqft | Sold | Price | $/sf | Match |
|---|---|---|---|---|---|---|---|
| 421 Boyd Ave | 0.50mi | 2/1.0 | 1,080 (+1%) | 1mo | $138,000 | $128 | 74 |
| 529 S Tyler St | 0.22mi | 3/1.0 (+1) | 1,194 (+12%) | 1mo | $145,000 | $121 | 64 |
| 323 Gordon Ave | 0.37mi | 2/1.0 | 942 (-12%) | 5mo | $135,000 | $143 | 59 |
| 825 S Race St | 0.46mi | 2/1.0 | 962 (-10%) | 5mo | $161,000 | $167 | 58 |
| 624 S Shannon St | 0.62mi | 2/1.0 | 980 (-8%) | 4mo | $89,000 | $91 | 54 |
| 1040 Elm St | 0.52mi | 3/1.0 (+1) | 984 (-8%) | 5mo | $155,000 | $158 | 54 |
| 732 S Shannon St | 0.68mi | 3/1.0 (+1) | 1,008 (-5%) | 2mo | $138,000 | $137 | 53 |
| 228 W Second St | 0.67mi | 3/2.0 (+1) | 1,082 (+2%) | 6mo | $229,000 | $212 | 52 |
| 700 Leeson Ave | 0.65mi | 2/2.0 | 1,000 (-6%) | 6mo | $175,000 | $175 | 51 |
| 237 N Cherry St | 0.43mi | 3/1.0 (+1) | 1,202 (+13%) | 6mo | $70,000 | $58 | 49 |
| 115 S Vine St | 0.51mi | 3/1.0 (+1) | 1,204 (+13%) | 4mo | $174,000 | $145 | 46 |
| 807 E Main St | 0.46mi | 3/2.0 (+1) | 1,214 (+14%) | 1mo | $143,000 | $118 | 45 |
Match score weights: distance 35% · size 25% · config 20% · recency 20%. Top-matched comps best support the ARV.
Projected returns pro-forma
-3.0% appreciation · 3.0% rent growth · sell at horizon
- IRR
- -15.1%
- Equity multiple
- 0.46×
- Total profit
- $-21,979
- Equity at exit
- $21,754
- IRR
- -6.5%
- Equity multiple
- 0.58×
- Total profit
- $-17,065
- Equity at exit
- $12,615
Cash invested: $40,852 (down + closing). Projections, not guarantees.
Landlord ↔ Tenant lean methodology
- Overall (STATE)
- 73 Landlord-Friendly
- State Ohio
- 73 Landlord-Friendly · R+6
- County
- — inherits STATE
- City
- — inherits STATE
ZIP-level market 45891
- Home prices YoY
- -17.0%
- Active inventory
- 46
- Price-to-rent
- 9.9×
Monthly cashflow live
- Estimated rent
- $1,222 medium interval (Pro) →
- Mortgage (P&I)
- −$765
- Tax from tax record
- −$57 /mo · $689/yr
- Insurance
- −$61
- Flood insurance flood zone
- −$56 /mo · $666/yr
- HOA
- −$0
- Vacancy / Maint / Mgmt
- −$257
- Net cashflow
- $26
Break-even live
Sensitivity live
| Price | -10% $109 | -5% $68 | +0% $26 | +5% $-15 | +10% $-56 |
|---|---|---|---|---|---|
| Rent | -10% $-70 | -5% $-22 | +0% $26 | +5% $75 | +10% $123 |
| Rate | -1.0pp $100 | -0.5pp $64 | base $26 | +0.5pp $-11 | +1.0pp $-50 |
UW: 25.0% down · 7.5% · 30yr · 1.5% tax · 5.0% vac · 8.0% maint · 8.0% mgmt
Financing live
Cash to close
- Down payment
- $36,475
- Closing costs
- $4,377
- Reserves months
- —
- Total cash needed
- —
Loan-product check · same deal, 3 products live
Conventional
25% down · 7.5% · 30yr
- Down + closing
- —
- Monthly P&I
- —
- Monthly cashflow
- —
- DSCR
- —
- Eligible?
- —
Personal DTI + credit; lowest rate.
DSCR
20% down · 8.5% · 30yr
- Down + closing
- —
- Monthly P&I
- —
- Monthly cashflow
- —
- DSCR
- —
- Eligible?
- —
No personal income docs; deal must DSCR.
Hard money
10% down · 12.0% · 12mo
- Down + closing
- —
- Monthly P&I
- —
- Monthly cashflow
- —
- DSCR
- —
- Eligible?
- —
Short-term bridge; refi at stabilization.
Rent comps 2 comps
| Address | Beds | Baths | Sqft | Rent | $/sqft | DOM | Units | Dist |
|---|---|---|---|---|---|---|---|---|
| 693 N Cherry St Van Wert, OH | 3.0 | 1.0 | 864 | $1,200 | $1.39 | 45d | 1 | 0.86mi |
| 330 Davis St Van Wert, OH | 2.0 | 1.0 | 768 | $1,250 | $1.63 | 45d | 1 | 0.97mi |
Listing history 9 events
-
2026-06-21days on market $145,900 Active 11 DOM
-
2026-06-21days on market $145,900 Active 10 DOM
-
2026-06-18days on market $145,900 Active 8 DOM
-
2026-06-17days on market $145,900 Active 7 DOM
-
2026-06-16days on market $145,900 Active 6 DOM
-
2026-06-15days on market $145,900 Active 5 DOM
-
2026-06-13days on market $145,900 Active 3 DOM
-
2026-06-12remarks 593-char remark
-
2026-06-12$145,900 Active 2 DOM
ⓘ Source: listings_history table (triggers on properties + properties_extension) + one-shot
backfill from property_details.listing_events for pre-trigger history.
Tax reassessment forecast OH · Partial reset (capped growth)
- Current annual tax
- $689 · $57/mo
- Projected year-2 tax
- $1,483 · $124/mo
- Expected delta
- +$793/yr (+$66/mo · 115.1%)
ⓘ Screening estimate from a state-policy table — verify with the county assessor before closing.
Climate risk First Street
- Flood 8/10 Severe FEMA zone X (unshaded) · 99% chance over 30 yrs
- Wildfire 1/10 Low
- Heat 3/10 Moderate 7 d/yr ≥100°F today · 18 d/yr by 30 yrs out
- Wind 2/10 Low
- Air quality 2/10 Low 1 unhealthy d/yr today · 2 by 30 yrs out
Nearby sold comps map
Loading sold comps map…
Walkable amenities ~0.75 mi
Loading nearby amenities…
Taxation est. · year 1
- Rental income
- $14,664
- − Mortgage interest
- −$8,173
- − Property taxes
- −$689
- − Insurance
- −$1,396
- − Repairs & maintenance
- −$1,173
- − Management
- −$1,173
- − Depreciation
- −$4,244
- Taxable loss
- −$2,185
- Est. tax savings @ 24.0%
- +$524
- After-tax cash flow
- $842/yr
For passive investors: Depreciation is non-cash, so a rental often shows a tax loss while cash-flowing — sheltering income. Rental losses are passive: they offset passive income freely, and up to $25,000/yr can offset ordinary (W-2) income if you actively participate and your MAGI is under $100k (phasing out to $0 by $150k); unused losses carry forward. On sale, claimed depreciation is recaptured at up to 25%, and gains may owe capital-gains tax (a 1031 exchange can defer both). Figures are a year-1 estimate at your 24.0% rate — not tax advice; consult a CPA.
Schools (NCES district)
- District
- Van Wert City
- NCES district ID
- 3910023
- Math proficiency
- 46% ▼ -16.00%
- Reading proficiency
- 50% ▼ -13.00%
- Median HH income
- $41,846
- Composite
- 40.34/100
- National rank
- #3745
- State rank
- #476 of 656 in OH
Livability — Van Wert
- Score
- 72/100
- State rank
- #392
- US rank
- #6388
Category grades
Schools grade is shown separately in the Schools card above.
Census & demographics
- Census place
- Van Wert, OH
- County
- Van Wert · 34,605 people
- City population
- 15,522
- Population (ZIP)
- 15,522
- Household income
- $62,944
- Rent vs Own
- Severe rent burden
- 9.1
Population outlook (Van Wert County) Hauer SSP2
- Today (2025)
- 28,235 people
- By 2030
- 27,793 · -1.6%
- By 2040
- 26,650 · -5.6%
- By 2050
- 25,251 · -10.6%
- By 2075
- 22,247 · -21.2%
- By 2100
- 18,559 · -34.3%
Race, ethnicity, and origin ACS 2023
- Neighborhood character
- Predominantly White (92%)
- Race & ethnicity
- White 92% Two or more races 4% Hispanic / Latino 4%
- Common ancestry
- Iranian 2% Lithuanian 2% Slovak 2%
- Foreign-born
- 1% · Canada
- Languages at home
- 97% English-only · Spanish 2%
Political lean MEDSL · Van Wert
- 2024 margin
- Solid R (+58.5) · D 20.4% · R 78.9%
- 2008→2024 swing
- -31.3pp toward R · 2008: -27.2pp · 2024: -58.5pp
- All cycles
- 2024: R+58.5 2020: R+57.4 2016: R+56.4 2012: R+40.5 2008: R+27.2
Not yet ingested
- Civics
- —
Market trends
- HPI YoY
- ▼ -49.58%
- Current HPI
- 242.1743
- Rent YoY
- —
- Metro
- —
- State GDP YoY
- ▲ 1.98%
- F500 in state
- 48
Industry mix (Fortune 500 HQ in OH)
| Industry | F500 HQs | Revenue |
|---|---|---|
| Insurance | 3 | $145B |
|
||
| Industrial Machinery | 3 | $49B |
|
||
| Financial Services | 3 | $24B |
|
||
| Consumer Goods | 2 | $93B |
|
||
| Aerospace / Defense | 2 | $47B |
|
||
| Utilities | 2 | $33B |
|
||
Price history
1 event — show timeline
- 2026-06-10 Listed $145,900 WCARE
Property tax history
-5.6%/yrLatest (2025): $689 · -0.0% YoY. Source: county tax records.
Cash-flow waterfall
monthlySold comps — $/sqft
last 12 mo · ≤1 miLoading sold comps…