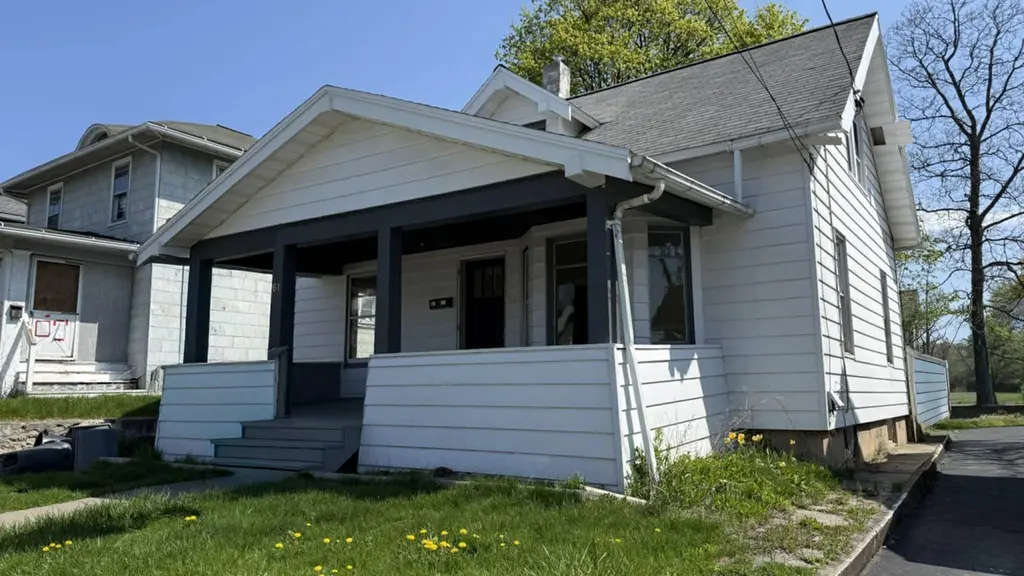
61 Elizabeth Street St · Johnson City, NY
Flood risk 6/10 · Moderate
- FEMA flood zone
- X
- Chance of flooding over 30 yrs
- 0.73%
- Est. flood insurance / yr
- $473 – $860
Fire risk 2/10 · Minimal
- Est. fire insurance / yr
- $691 – $1,283
Heat risk 3/10 · Minor
- Hot days now (above 92°F)
- 8 days/yr
- Hot days in 30 yrs
- 17 days/yr
Wind risk 2/10 · Minimal
- Chance of severe wind over 30 yrs
- 1.0%
Air-quality risk 2/10 · Minimal
- Unhealthy air days now
- 0 days/yr
- Unhealthy air days in 30 yrs
- 1 days/yr
Risk factors via First Street. Map © Google.
Why this score? — see what drove the B- grade
The composite is a weighted blend of 9 inputs, each scored 0–100. Each bar is that input's sub-score; the figure is the points it added to the 100-point composite (weight × sub-score).
- Cash flow +16.2/30.0
- ARV discount +15.0/15.0
- Appreciation +10.0/10.0
- 1% rule +6.4/10.0
- DSCR +5.0/10.0
- Rent growth +4.9/5.0
- Livability +3.8/5.0
- Schools +3.3/10.0
- Condition / age +2.5/5.0
$124,900
🖨 Deal sheet 📄 Offer letter ✓ Due diligence
Listing remarks MLS
Welcome to this charming two-story home in the heart of Johnson City, offering comfort, convenience, and great value. This well-maintained property features 3 bedrooms and 1 full bathroom, making it ideal for owner-occupy or a solid investment opportunity. Located conveniently near all local amenitiesincluding nearby hospitals. The home offers a practical layout with a bright living room, dining area, kitchen, and one bedroom on the first floor. Two additional bedrooms upstairs provide privacy and space. The clean basement offers plenty of storage and potential for additional use. Situated on a 4,680 sq ft lot, the home features a pleasant front yard and spacious backyard—perfect for relaxing, gardening, or gatherings. Enjoy morning coffee on the front porch and unwind in the evening on the back porch. Major updates include a furnace and boiler about one year old, plus fresh interior paint. A great opportunity to own a cozy home in a prime location. Priced for a quick sale!
Key facts
- Practical layout
- Bright living room
- Clean basement
Tags
Neighborhood map
What this means for you Summary
Snapshot
- This is a 3-bed/1.0-bath single-family listed at $125k.
Deal economics
- At list price, monthly cash flow is $67 ($805/yr) — positive.
- The deal already cash-flows at list — no discount required.
- Meets the 1% rule at list price ($1k rent vs $125k).
- Recommended offer: $114k (9.0% below list) — sets the bar for market timing.
Location & tenants
- Location reads 76/100 on livability (#238 in NY, #3,739 nationally) — a middle-class / working-renter tenant base. Strengths: cost of living A+, housing A+, health & safety A+; Watch: crime F, employment D-.
- Johnson City Central School District (suburban): math 38% / reading 41% proficiency, ranked #535 of 590 in NY (top 91%) — families likely to look elsewhere, expect single-tenant / working-renter base with shorter leases.
- Market conditions: Rents rising fast (+9.5%/yr); 99 active listings in the ZIP; 14 comparable units currently listed for rent nearby; rentals leasing fast (median 13d on market — plan ~1-2 weeks tenant-placement turnaround); 340 units permitted in Broome County in 2024 (269 in 5+ unit buildings).
Forward outlook
- In year one you build about $13k of equity ($864 loan paydown + $12k appreciation (10.0% local appreciation)).
- Broome County population projected at -13% by 2050 — secular population decline; favor cash flow + early exit over multi-decade hold.
- At projected returns (10.0% appreciation + 8.0% rent growth), your $35k cash investment doubles in ~3 years — after that, you're playing with house money.
- By year 3, paydown + projected appreciation supports a ~$34k cash-out refi (75% LTV) — recoverable capital for the next deal without selling this one.
Negotiation context
- It's been on market 105 days — a 9% lower offer ($114k) is reasonable based on typical stale-listing flexibility.
Risks & watch-outs
- Watch-outs: property tax is 3.4% of price; built in 1930 — expect roof / HVAC / electrical / plumbing capex.
- Climate carrying-cost: major flood risk — expect insurance premiums to compound above CPI over the hold.
Questions for the listing agent
- It's been on market 105 days. Have you received any prior offers? Is the seller open to a 9% concession, seller financing, or rate buy-down credit?
- Built in 1930 — when were the roof, HVAC, electrical panel, plumbing, and water heater last replaced?
- Property tax is high relative to price — has the assessment been appealed recently, and will the sale trigger a re-assessment?
- Why hasn't it sold? Are there any deal-killer items the seller is aware of (foundation, flood, title, zoning, code violations)?
- Is there a deadline driving the sale (1031 exchange, divorce, estate, relocation)? That informs how much negotiation room exists.
- Crime grade is F in this area — have there been break-ins, vandalism, or insurance claims at this property in the last 3 years? What carrier currently insures it and at what premium?
- What's the average days-on-market for RENTAL listings here right now (not sales)? A rising rental-DOM trend means longer vacancies and softer asking-rent achievability than the comps imply.
- What's the recent tenant-quality profile in this submarket — average credit score on applications, eviction rate, late-payment / NSF rate, and stable-employment percentage? A property-management company in the area should have these aggregated.
- How much new for-sale + rental construction is in the pipeline within 1–3 miles? Heavy new supply typically softens prices + rents 12–24 months out; constrained supply supports both.
Investment metrics
- 1% rule
- 1.14% ✓
- Cap rate
- 6.94%
- Cash-on-cash
- 2.30%
- DSCR
- 1.10
- GRM
- 7.3
CMA / ARV
- ARV (median comp)
- $151,828
- List price
- $124,900
- Delta
- -17.74%
- Verdict
- UNDERPRICED
- Comps
- 20 within 1.0 mi
Show comp detail 12 sales within ~0.75 mi
| Address | Dist | Beds/Ba | Sqft | Sold | Price | $/sf | Match |
|---|---|---|---|---|---|---|---|
| 211 Hudson St | 0.11mi | 3/1.0 | 962 (-2%) | 2mo | $149,900 | $156 | 90 |
| 233 Grand Ave | 0.20mi | 3/1.0 | 952 (-3%) | 3mo | $122,000 | $128 | 84 |
| 204 Baldwin St N | 0.21mi | 3/1.0 | 1,012 (+3%) | 6mo | $187,500 | $185 | 80 |
| 52 Albert St | 0.41mi | 2/1.0 (-1) | 992 (+1%) | 3mo | $122,000 | $123 | 72 |
| 58 Orchard Ave | 0.25mi | 2/1.0 (-1) | 998 (+2%) | 10mo | $145,000 | $145 | 72 |
| 28 & 24 Dartmouth Dr | 0.28mi | 3/1.0 | 944 (-4%) | 13mo | $115,000 | $122 | 70 |
| 76 Baker St | 0.42mi | 3/1.0 | 968 (-1%) | 22mo | $120,000 | $124 | 60 |
| 109 Hill Ave | 0.51mi | 2/1.0 (-1) | 938 (-4%) | 12mo | $160,000 | $171 | 54 |
| 14 Sturtevant St | 0.45mi | 3/1.5 | 1,024 (+4%) | 20mo | $145,500 | $142 | 53 |
| 479 Riverside Dr | 0.28mi | 2/1.0 (-1) | 1,080 (+10%) | 14mo | $115,000 | $106 | 53 |
| 514 Grand Ave | 0.46mi | 3/1.5 | 1,122 (+14%) | 22mo | $157,980 | $141 | 34 |
| 19 Lincoln Ave | 0.54mi | 2/1.5 (-1) | 1,098 (+12%) | 23mo | $113,402 | $103 | 29 |
Match score weights: distance 35% · size 25% · config 20% · recency 20%. Top-matched comps best support the ARV.
Projected returns pro-forma
10.0% appreciation · 8.0% rent growth · sell at horizon
- IRR
- 28.2%
- Equity multiple
- 3.29×
- Total profit
- $79,979
- Equity at exit
- $112,520
- IRR
- 26.4%
- Equity multiple
- 8.18×
- Total profit
- $251,125
- Equity at exit
- $242,653
Cash invested: $34,972 (down + closing). Projections, not guarantees.
Landlord ↔ Tenant lean methodology
- Overall (STATE)
- 15 Strongly Tenant-Friendly
- State New York
- 15 Strongly Tenant-Friendly · D+10
- County
- — inherits STATE
- City
- — inherits STATE
ZIP-level market 13790
- Home prices YoY
- 6.8%
- Rents YoY
- 9.5%
- Active inventory
- 99
- Price-to-rent
- 7.3×
Monthly cashflow live
- Estimated rent
- $1,427 high interval (Pro) →
- Mortgage (P&I)
- −$655
- Tax from tax record
- −$353 /mo · $4,235/yr
- Insurance
- −$52
- HOA
- −$0
- Vacancy / Maint / Mgmt
- −$300
- Net cashflow
- $67
Break-even live
UW: 25.0% down · 7.5% · 30yr · 1.5% tax · 5.0% vac · 8.0% maint · 8.0% mgmt
Financing live
Cash to close
- Down payment
- $31,225
- Closing costs
- $3,747
- Reserves months
- —
- Total cash needed
- —
Loan-product check · same deal, 3 products live
Conventional
25% down · 7.5% · 30yr
- Down + closing
- —
- Monthly P&I
- —
- Monthly cashflow
- —
- DSCR
- —
- Eligible?
- —
Personal DTI + credit; lowest rate.
DSCR
20% down · 8.5% · 30yr
- Down + closing
- —
- Monthly P&I
- —
- Monthly cashflow
- —
- DSCR
- —
- Eligible?
- —
No personal income docs; deal must DSCR.
Hard money
10% down · 12.0% · 12mo
- Down + closing
- —
- Monthly P&I
- —
- Monthly cashflow
- —
- DSCR
- —
- Eligible?
- —
Short-term bridge; refi at stabilization.
Rent comps 14 comps
| Address | Beds | Baths | Sqft | Rent | $/sqft | DOM | Units | Dist |
|---|---|---|---|---|---|---|---|---|
| 207 Saint Charles St #2 Johnson City, NY | 2.0 | 1.0 | 925 | $1,250 | $1.35 | 21d | 1 | 0.08mi |
| 143 Harrison St Unit 2 Johnson City, NY | 2.0 | 1.0 | 750 | $1,100 | $1.47 | 13d | 1 | 0.25mi |
| 145 Floral Ave Unit 4 Johnson City, NY | 3.0 | 1.0 | 1095 | $1,250 | $1.14 | 21d | 1 | 0.36mi |
| 79 Saint Charles St Apt 3 Johnson City, NY | 3.0 | 1.0 | 793 | $1,340 | $1.69 | 13d | 1 | 0.36mi |
| 155 Willow St Unit 3 Johnson City, NY | 2.0 | 1.0 | 739 | $1,200 | $1.62 | 21d | 1 | 0.41mi |
| 127 Burbank Ave Unit 2 Johnson City, NY | 2.0 | 1.0 | 1032 | $1,000 | $0.97 | 21d | 1 | 0.47mi |
| 400 Riverside Dr Unit 212 Johnson City, NY | 3.0 | 1.0 | 1100 | $2,500 | $2.27 | 13d | 1 | 0.51mi |
| 400 Riverside Dr Unit 27 Johnson City, NY | 2.0 | 1.0 | 800 | $2,000 | $2.50 | 13d | 1 | 0.51mi |
| 400 Riverside Dr Unit 15 Johnson City, NY | 3.0 | 1.0 | 1000 | $2,425 | $2.42 | 13d | 1 | 0.51mi |
| 263 Main St Unit 2 Johnson City, NY | 2.0 | 2.0 | 850 | $1,399 | $1.65 | 21d | 1 | 0.59mi |
| 11 Avenue A Unit 3L Johnson City, NY | 2.0 | 1.0 | 651 | $1,250 | $1.92 | 21d | 1 | 0.63mi |
| 11 Dayton St Apt 5 Johnson City, NY | 2.0 | 1.0 | 900 | $1,200 | $1.33 | 13d | 1 | 0.92mi |
| 35 Dayton St Unit 2 Johnson City, NY | 2.0 | 1.0 | 648 | $1,000 | $1.54 | 13d | 1 | 1.02mi |
| 263 Main St Binghamton, NY | 2.0 | 1.0 | 920 | $1,200 | $1.30 | 13d | 1 | 1.14mi |
Listing history 19 events
-
2026-06-19days on market $124,900 Active 105 DOM
-
2026-06-18days on market $124,900 Active 104 DOM
-
2026-06-17days on market $124,900 Active 103 DOM
-
2026-06-16days on market $124,900 Active 102 DOM
-
2026-06-15days on market $124,900 Active 101 DOM
-
2026-06-14days on market $124,900 Active 99 DOM
-
2026-06-13days on market $124,900 Active 98 DOM
-
2026-06-10days on market $124,900 Active 96 DOM
-
2026-06-09days on market $124,900 Active 95 DOM
-
2026-06-08days on market $124,900 Active 94 DOM
-
2026-06-07days on market $124,900 Active 93 DOM
-
2026-06-05days on market $124,900 Active 90 DOM
-
2026-06-03days on market $124,900 Active 89 DOM
-
2026-06-02days on market $124,900 Active 88 DOM
-
2026-06-01days on market $124,900 Active 87 DOM
-
2026-05-31days on market $124,900 Active 86 DOM
-
2026-05-30days on market $124,900 Active 85 DOM
-
2026-04-23price $129,500 1018-char remark
Show marketing remark (1018 chars)
Welcome to this charming two-story home in the heart of Johnson City, offering comfort, convenience, and great value. This well-maintained property features 3 bedrooms and 1 full bathroom, making it ideal for owner-occupy or a solid investment opportunity. Located conveniently near all local amenitiesincluding nearby hospitals. The home offers a practical layout with a bright living room, dining area, kitchen, and one bedroom on the first floor. Two additional bedrooms upstairs provide privacy and space. The clean basement offers plenty of storage and potential for additional use. Situated on a 4,680 sq ft lot, the home features a pleasant front yard and spacious backyard—perfect for relaxing, gardening, or gatherings. Enjoy morning coffee on the front porch and unwind in the evening on the back porch. Major updates include a furnace and boiler about one year old, plus fresh interior paint. A great opportunity to own a cozy home in a prime location. Priced for a quick sale!
-
2026-03-06$135,000 Active 1018-char remark
Show marketing remark (1018 chars)
Welcome to this charming two-story home in the heart of Johnson City, offering comfort, convenience, and great value. This well-maintained property features 3 bedrooms and 1 full bathroom, making it ideal for owner-occupy or a solid investment opportunity. Located conveniently near all local amenitiesincluding nearby hospitals. The home offers a practical layout with a bright living room, dining area, kitchen, and one bedroom on the first floor. Two additional bedrooms upstairs provide privacy and space. The clean basement offers plenty of storage and potential for additional use. Situated on a 4,680 sq ft lot, the home features a pleasant front yard and spacious backyard—perfect for relaxing, gardening, or gatherings. Enjoy morning coffee on the front porch and unwind in the evening on the back porch. Major updates include a furnace and boiler about one year old, plus fresh interior paint. A great opportunity to own a cozy home in a prime location. Priced for a quick sale!
ⓘ Source: listings_history table (triggers on properties + properties_extension) + one-shot
backfill from property_details.listing_events for pre-trigger history.
Tax reassessment forecast NY · Partial reset (capped growth)
- Current annual tax
- $4,235 · $353/mo
- Projected year-2 tax
- $4,235 · $353/mo
- Expected delta
- $0/yr ($0/mo · 0.0%)
ⓘ Screening estimate from a state-policy table — verify with the county assessor before closing.
Climate risk First Street
- Flood 6/10 Major FEMA zone X · 73% chance over 30 yrs
- Wildfire 2/10 Low
- Heat 3/10 Moderate 8 d/yr ≥92°F today · 17 d/yr by 30 yrs out
- Wind 2/10 Low 100% chance of damaging wind over 30 yrs
- Air quality 2/10 Low 0 unhealthy d/yr today · 1 by 30 yrs out
Nearby sold comps map
Loading sold comps map…
Walkable amenities ~0.75 mi
Loading nearby amenities…
Taxation est. · year 1
- Rental income
- $17,119
- − Mortgage interest
- −$6,996
- − Property taxes
- −$4,235
- − Insurance
- −$624
- − Repairs & maintenance
- −$1,370
- − Management
- −$1,370
- − Depreciation
- −$3,633
- Taxable loss
- −$1,109
- Est. tax savings @ 24.0%
- +$266
- After-tax cash flow
- $1,071/yr
For passive investors: Depreciation is non-cash, so a rental often shows a tax loss while cash-flowing — sheltering income. Rental losses are passive: they offset passive income freely, and up to $25,000/yr can offset ordinary (W-2) income if you actively participate and your MAGI is under $100k (phasing out to $0 by $150k); unused losses carry forward. On sale, claimed depreciation is recaptured at up to 25%, and gains may owe capital-gains tax (a 1031 exchange can defer both). Figures are a year-1 estimate at your 24.0% rate — not tax advice; consult a CPA.
Schools (NCES district)
- District
- Johnson City Central School District
- NCES district ID
- 3615900
- Math proficiency
- 38% ▼ -8.00%
- Reading proficiency
- 41% ▲ 2.00%
- Median HH income
- $40,514
- Composite
- 33.17/100
- National rank
- #5545
- State rank
- #535 of 590 in NY
Livability — Johnson City
- Score
- 76/100
- State rank
- #238
- US rank
- #3739
Category grades
Schools grade is shown separately in the Schools card above.
Census & demographics
- Census place
- Johnson City, NY
- County
- Broome County · 126,805 people
- City population
- 18,739
- Metro
- Binghamton, NY
- Population (ZIP)
- 18,739
- Household income
- $59,045
- Rent vs Own
- Severe rent burden
- 1233.0
Population outlook (Broome County) Hauer SSP2
- Today (2025)
- 187,989 people
- By 2030
- 183,066 · -2.6%
- By 2040
- 172,228 · -8.4%
- By 2050
- 163,161 · -13.2%
- By 2075
- 153,641 · -18.3%
- By 2100
- 140,851 · -25.1%
Race, ethnicity, and origin ACS 2023
- Neighborhood character
- Predominantly White (75%)
- Race & ethnicity
- White 75% Two or more races 9% Asian 8% Black 6% Hispanic / Latino 4%
- Common ancestry
- Romanian 6% Lithuanian 3% Scotch-Irish 2%
- Foreign-born
- 9% · Canada, China, Vietnam
- Languages at home
- 88% English-only · Other Indo-European 4% French/Haitian/Cajun 2% Spanish 2%
Political lean MEDSL · Broome
- 2024 margin
- Toss-up / Even · D 50.2% · R 49.8%
- 2008→2024 swing
- -7.6pp toward R · 2008: 8.0pp · 2024: 0.4pp
- All cycles
- 2024: D+0.4 2020: D+3.5 2016: R+3.7 2012: D+4.6 2008: D+8.0
Not yet ingested
- Civics
- —
Market trends
- HPI YoY
- ▲ 18.06%
- Current HPI
- 285.3668
- Rent YoY
- ▲ 9.47%
- Metro
- Binghamton, NY
- State GDP YoY
- ▲ 2.60%
- F500 in state
- 92
Industry mix (Fortune 500 HQ in NY)
| Industry | F500 HQs | Revenue |
|---|---|---|
| Financial Services | 10 | $950B |
|
||
| Consumer Goods | 9 | $162B |
|
||
| Insurance | 4 | $225B |
|
||
| Telecommunications | 2 | $144B |
|
||
| Pharmaceuticals | 2 | $112B |
|
||
| Media / Entertainment | 2 | $69B |
|
||
Price history
-4.1% since first listed2 events — show timeline
- 2026-04-23 Price Changed $129,500 GBAOR
- 2026-03-06 Listed $135,000 GBAOR
Property tax history
+4.2%/yrLatest (2025): $4,235 · +1.7% YoY. Source: county tax records.
Cash-flow waterfall
monthlySold comps — $/sqft
last 12 mo · ≤1 miLoading sold comps…