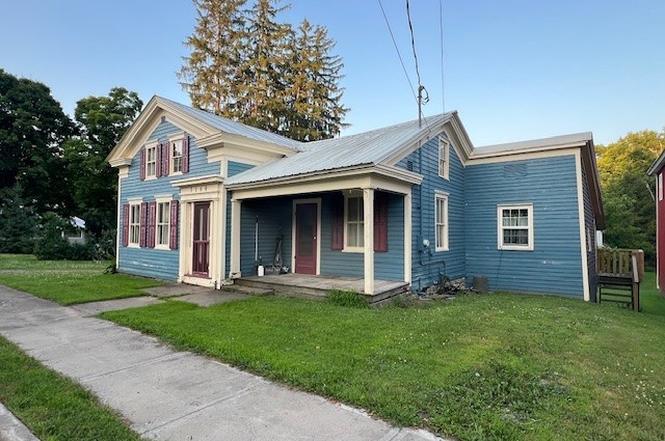
3160 Main St · Constableville, NY
Flood risk 3/10 · Minor
- FEMA flood zone
- X
- Chance of flooding over 30 yrs
- 0.1%
- Est. flood insurance / yr
- $473 – $860
Fire risk 3/10 · Minor
- Est. fire insurance / yr
- $691 – $1,283
Heat risk 1/10 · Minimal
- Hot days now (above 88°F)
- 7 days/yr
- Hot days in 30 yrs
- 17 days/yr
Wind risk 1/10 · Minimal
- Chance of severe wind over 30 yrs
- —
Air-quality risk 2/10 · Minimal
- Unhealthy air days now
- 0 days/yr
- Unhealthy air days in 30 yrs
- 1 days/yr
Risk factors via First Street. Map © Google.
Why this score? — see what drove the D+ grade
The composite is a weighted blend of 9 inputs, each scored 0–100. Each bar is that input's sub-score; the figure is the points it added to the 100-point composite (weight × sub-score).
- Cash flow +20.1/30.0
- DSCR +6.4/10.0
- 1% rule +6.1/10.0
- Appreciation +5.6/10.0
- Schools +3.9/10.0
- Livability +3.0/5.0
- Rent growth +2.5/5.0
- Condition / age +2.5/5.0
- ARV discount +0.0/15.0
$114,900
🖨 Deal sheet (PDF) 📄 Offer letter ✓ Due diligence
Listing remarks
Opportunity and affordability is knocking! Circa 1890 charmer located in the historic Village of Constableville priced to sell by Estate. Ideal for your home away from home or all year home in the midst of upstate New York's Tug Hill & Western Adirondack Regions . The Tug Hill and Western Adirondacks boast tens of thousands of acres of state lands, lakes & rivers & hundreds of miles of hiking, snowmobiling and atv/utv trails. This cozy home boasts 1,400 square feet of living space with 3 bedrooms, 2 baths, eat in kitchen, big living room and formal dining room. An upstairs bonus room adds additional space. The property also includes a large 22' x 28' one and one half story
Key facts
- Lakes
- Tug hill
- State lands
Tags
Neighborhood map
What this means for you Summary
Snapshot
- This is a 3-bed/2.0-bath single-family listed at $115k.
Deal economics
- At list price, monthly cash flow is $142 ($2k/yr) — positive.
- The deal already cash-flows at list — no discount required.
- Meets the 1% rule at list price ($1k rent vs $115k).
- Recommended offer: $113k (1.5% below list) — sets the bar for market timing.
Location & tenants
- Location reads 59/100 on livability (#1,019 in NY) — a working-class tenant base; expect higher turnover. Strengths: cost of living A+, housing A+; Watch: employment C-, health & safety C-, crime F.
- South Lewis Central School District (rural): math 43% / reading 50% proficiency, ranked #450 of 590 in NY (top 76%) — families likely to look elsewhere, expect single-tenant / working-renter base with shorter leases.
- Zoned schools: South Lewis Elementary School (463 students, 57% FRL); South Lewis Middle School (math 29% / reading 48%, grade F, #437 of 729 statewide, top 60%, 308 students, 61% FRL); South Lewis High School (math 87% / reading 74%, grade A, #495 of 1,100 statewide, top 46%, 272 students, 56% FRL).
- Zoned-school proficiency averages 60% at this address vs 46% district-wide (+13 pts) — the actual schools serving this property are materially stronger than the South Lewis Central School District average implies; a family-tenant draw the district grade alone would hide.
- Market conditions: 10 active listings in the ZIP; 110 units permitted in Lewis County in 2024 (0 in 5+ unit buildings).
Forward outlook
- In year one you build about $2k of equity ($794 loan paydown + $1k appreciation (1.2% local appreciation)).
- Lewis County population projected at -20% by 2050 — secular population decline; favor cash flow + early exit over multi-decade hold.
- At projected returns (1.2% appreciation + 3.0% rent growth), your $32k cash investment doubles in ~7 years — after that, you're playing with house money.
Negotiation context
- It's been on market 20 days — a 2% lower offer ($113k) is reasonable based on typical stale-listing flexibility.
- 3 sale attempts with the ask held roughly flat each time — persistent listings suggest the price (not the market) is what's stuck; bring a comps-based counter.
- Current owner paid $55k; list at $115k implies a 109% gain — meaningful room to come down on a strong offer.
Risks & watch-outs
- Watch-outs: built in 1890 — expect roof / HVAC / electrical / plumbing capex.
Questions for the listing agent
- Built in 1890 — when were the roof, HVAC, electrical panel, plumbing, and water heater last replaced?
- Is there a deadline driving the sale (1031 exchange, divorce, estate, relocation)? That informs how much negotiation room exists.
- Schools are F-rated, which usually means shorter tenancies and higher turnover. Who's the typical renter profile here, and what's been the actual vacancy rate?
- Crime grade is F in this area — have there been break-ins, vandalism, or insurance claims at this property in the last 3 years? What carrier currently insures it and at what premium?
- The area grade is low — what's the realistic commute time and amenity access for the typical tenant pool here? Any planned neighborhood developments (good or bad) we should know about?
- What's the average days-on-market for RENTAL listings here right now (not sales)? A rising rental-DOM trend means longer vacancies and softer asking-rent achievability than the comps imply.
- What's the recent tenant-quality profile in this submarket — average credit score on applications, eviction rate, late-payment / NSF rate, and stable-employment percentage? A property-management company in the area should have these aggregated.
- How much new for-sale + rental construction is in the pipeline within 1–3 miles? Heavy new supply typically softens prices + rents 12–24 months out; constrained supply supports both.
Investment metrics
- 1% rule
- 1.11% ✓
- Cap rate
- 7.78%
- Cash-on-cash
- 5.31%
- DSCR
- 1.24
- GRM
- 7.5
CMA / ARV
- ARV (on-the-fly)
- $92,256
- Comps found
- 3
Show comp detail 3 sales within ~0.75 mi
| Address | Dist | Beds/Ba | Sqft | Sold | Price | $/sf | Match |
|---|---|---|---|---|---|---|---|
| 3160 Main St | 0.00mi | 3/2.0 | 1,488 (0%) | 1mo | $92,000 | $62 | 100 |
| 5767 W Main St | 0.32mi | 3/1.0 | 1,672 (+12%) | 6mo | $100,000 | $60 | 55 |
| 5766 W Main St | 0.34mi | 3/1.0 | 1,661 (+12%) | 22mo | $157,000 | $95 | 42 |
Match score weights: distance 35% · size 25% · config 20% · recency 20%. Top-matched comps best support the ARV.
Projected returns pro-forma
1.19% appreciation · 3.0% rent growth · sell at horizon
- IRR
- 7.5%
- Equity multiple
- 1.38×
- Total profit
- $12,349
- Equity at exit
- $40,369
- IRR
- 11.4%
- Equity multiple
- 2.42×
- Total profit
- $45,586
- Equity at exit
- $54,542
Cash invested: $32,172 (down + closing). Projections, not guarantees.
Landlord ↔ Tenant lean methodology
- Overall (STATE)
- 15 Strongly Tenant-Friendly
- State New York
- 15 Strongly Tenant-Friendly · D+10
- County
- — inherits STATE
- City
- — inherits STATE
ZIP-level market 13325
- Home prices YoY
- 0.4%
- Active inventory
- 10
- Price-to-rent
- 7.5×
Monthly cashflow live
- Estimated rent
- $1,272 medium interval (Pro) →
- Mortgage (P&I)
- −$603
- Tax from tax record
- −$212 /mo · $2,548/yr
- Insurance
- −$48
- HOA
- −$0
- Vacancy / Maint / Mgmt
- −$267
- Net cashflow
- $142
Break-even live
Sensitivity live
| Price | -10% $207 | -5% $175 | +0% $142 | +5% $110 | +10% $77 |
|---|---|---|---|---|---|
| Rent | -10% $42 | -5% $92 | +0% $142 | +5% $193 | +10% $243 |
| Rate | -1.0pp $200 | -0.5pp $172 | base $142 | +0.5pp $113 | +1.0pp $82 |
UW: 25.0% down · 7.5% · 30yr · 1.5% tax · 5.0% vac · 8.0% maint · 8.0% mgmt
Financing live
Cash to close
- Down payment
- $28,725
- Closing costs
- $3,447
- Reserves months
- —
- Total cash needed
- —
Loan-product check · same deal, 3 products live
Conventional
25% down · 7.5% · 30yr
- Down + closing
- —
- Monthly P&I
- —
- Monthly cashflow
- —
- DSCR
- —
- Eligible?
- —
Personal DTI + credit; lowest rate.
DSCR
20% down · 8.5% · 30yr
- Down + closing
- —
- Monthly P&I
- —
- Monthly cashflow
- —
- DSCR
- —
- Eligible?
- —
No personal income docs; deal must DSCR.
Hard money
10% down · 12.0% · 12mo
- Down + closing
- —
- Monthly P&I
- —
- Monthly cashflow
- —
- DSCR
- —
- Eligible?
- —
Short-term bridge; refi at stabilization.
Listing history 7 events
-
2026-03-05status Pending
-
2026-02-13$114,900 Active
-
2026-01-30historical
-
2025-09-03status Active
-
2025-08-23status Pending
-
2025-07-31$119,000 Active
-
2007-10-22soldstatus $55,000
ⓘ Source: listings_history table (triggers on properties + properties_extension) + one-shot
backfill from property_details.listing_events for pre-trigger history.
Tax reassessment forecast NY · Partial reset (capped growth)
- Current annual tax
- $2,548 · $212/mo
- Projected year-2 tax
- $2,548 · $212/mo
- Expected delta
- $0/yr ($0/mo · 0.0%)
ⓘ Screening estimate from a state-policy table — verify with the county assessor before closing.
Climate risk First Street
- Flood 3/10 Moderate FEMA zone X · 10% chance over 30 yrs
- Wildfire 3/10 Moderate
- Heat 1/10 Low 7 d/yr ≥88°F today · 17 d/yr by 30 yrs out
- Wind 1/10 Low
- Air quality 2/10 Low 0 unhealthy d/yr today · 1 by 30 yrs out
Nearby sold comps map
Loading sold comps map…
Walkable amenities ~0.75 mi
Loading nearby amenities…
Taxation est. · year 1
- Rental income
- $15,267
- − Mortgage interest
- −$6,436
- − Property taxes
- −$2,548
- − Insurance
- −$574
- − Repairs & maintenance
- −$1,221
- − Management
- −$1,221
- − Depreciation
- −$3,343
- Taxable loss
- −$77
- Est. tax savings @ 24.0%
- +$18
- After-tax cash flow
- $1,726/yr
For passive investors: Depreciation is non-cash, so a rental often shows a tax loss while cash-flowing — sheltering income. Rental losses are passive: they offset passive income freely, and up to $25,000/yr can offset ordinary (W-2) income if you actively participate and your MAGI is under $100k (phasing out to $0 by $150k); unused losses carry forward. On sale, claimed depreciation is recaptured at up to 25%, and gains may owe capital-gains tax (a 1031 exchange can defer both). Figures are a year-1 estimate at your 24.0% rate — not tax advice; consult a CPA.
Schools (NCES district)
- District
- South Lewis Central School District
- NCES district ID
- 3627360
- Math proficiency
- 43% ▼ -9.00%
- Reading proficiency
- 50% ▲ 3.00%
- Median HH income
- $44,641
- Composite
- 39.35/100
- National rank
- #3980
- State rank
- #450 of 590 in NY
Livability — Constableville
- Score
- 59/100
- State rank
- #1019
- US rank
- #19911
Category grades
Schools grade is shown separately in the Schools card above.
Census & demographics
- Census place
- Constableville, NY
- Population (ZIP)
- 882
Population outlook (Lewis County) Hauer SSP2
- Today (2025)
- 26,126 people
- By 2030
- 25,354 · -3.0%
- By 2040
- 23,359 · -10.6%
- By 2050
- 20,927 · -19.9%
- By 2075
- 15,533 · -40.5%
- By 2100
- 10,215 · -60.9%
Race, ethnicity, and origin ACS 2023
- Neighborhood character
- Predominantly White (97%)
- Race & ethnicity
- White 97% Two or more races 2%
- Common ancestry
- Romanian 14% Lithuanian 5% Iranian 3%
- Foreign-born
- 0%
- Languages at home
- 99% English-only · Russian/Polish/Slavic 1%
Political lean MEDSL · Lewis
- 2024 margin
- Solid R (+44.4) · D 27.8% · R 72.2%
- 2008→2024 swing
- -35.6pp toward R · 2008: -8.8pp · 2024: -44.4pp
- All cycles
- 2024: R+44.4 2020: R+39.2 2016: R+39.6 2012: R+8.7 2008: R+8.8
Not yet ingested
- Civics
- —
Market trends
- HPI YoY
- ▲ 1.19%
- Current HPI
- 328.9708
- Rent YoY
- —
- Metro
- —
- State GDP YoY
- ▲ 2.60%
- F500 in state
- 92
Industry mix (Fortune 500 HQ in NY)
| Industry | F500 HQs | Revenue |
|---|---|---|
| Financial Services | 10 | $950B |
|
||
| Consumer Goods | 9 | $162B |
|
||
| Insurance | 4 | $225B |
|
||
| Telecommunications | 2 | $144B |
|
||
| Pharmaceuticals | 2 | $112B |
|
||
| Media / Entertainment | 2 | $69B |
|
||
Price history
+108.9% since first listed7 events — show timeline
- 2026-03-05 Pending — CNYIS
- 2026-02-13 Listed $114,900 CNYIS
- 2026-01-30 Listing Removed — CNYIS
- 2025-09-03 Relisted — CNYIS
- 2025-08-23 Pending — CNYIS
- 2025-07-31 Listed $119,000 CNYIS
- 2007-10-22 Sold (Public Records) $55,000 Public Records
Property tax history
+1.1%/yrLatest (2025): $2,548 · +1.4% YoY. Source: county tax records.
Cash-flow waterfall
monthlySold comps — $/sqft
last 12 mo · ≤1 miLoading sold comps…