 Multi-family
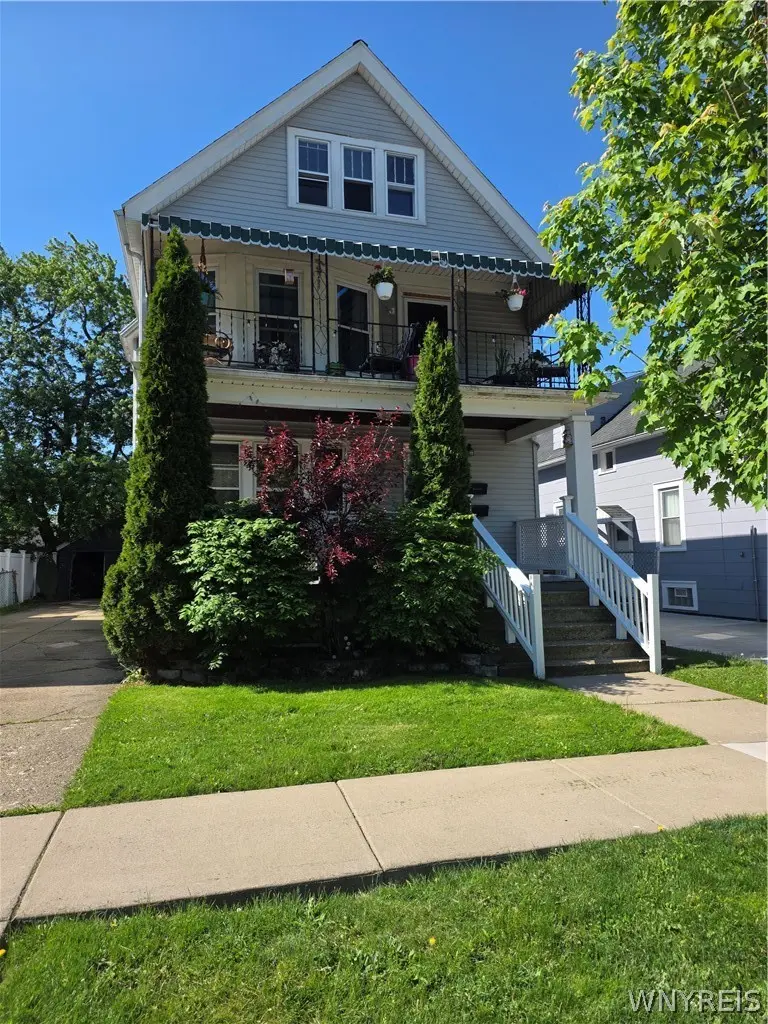
28 Wabash Ave · Kenmore, NY
Flood risk 1/10 · Minimal
- FEMA flood zone
- X (unshaded)
- Chance of flooding over 30 yrs
- 0.0%
- Est. flood insurance / yr
- $473 – $860
Fire risk 1/10 · Minimal
- Est. fire insurance / yr
- $691 – $1,283
Heat risk 3/10 · Minor
- Hot days now (above 92°F)
- 7 days/yr
- Hot days in 30 yrs
- 15 days/yr
Wind risk 1/10 · Minimal
- Chance of severe wind over 30 yrs
- —
Air-quality risk 3/10 · Minor
- Unhealthy air days now
- 3 days/yr
- Unhealthy air days in 30 yrs
- 4 days/yr
Risk factors via First Street. Map © Google.
Why this score? — see what drove the C+ grade
The composite is a weighted blend of 9 inputs, each scored 0–100. Each bar is that input's sub-score; the figure is the points it added to the 100-point composite (weight × sub-score).
- Cash flow +20.5/30.0
- ARV discount +12.9/15.0
- 1% rule +7.2/10.0
- DSCR +6.5/10.0
- Rent growth +4.9/5.0
- Livability +4.0/5.0
- Schools +3.9/10.0
- Condition / age +2.5/5.0
- Appreciation +0.0/10.0
$269,900
🖨 Deal sheet 📄 Offer letter ✓ Due diligence
Multi-family units
County records classify this as Multi-Family (2-4 Unit). Listing-text estimate: 1 unit. estimate disagrees with records
Listing remarks MLS
Check out this 3/2 double located in the heart of the Village of Kenmore. The home has a detached garage, separate utilities for each unit, hardwood floors throughout, and a full walk up attic with plenty of storage. The home is conveniently located between Elmwood and Delaware with quick access to shopping, major routes and schools. Don't let this home pass you by!
Key facts
- Covered porch
- Immediate income
- Large attic
Tags
Property features AI
Finance
- Financial info: Property configured as 2 units total; Both units currently month-to-month; Each unit shows actual rent of $1,400; Owner pays water; rent includes water; Operating expenses include water/sewer
Exterior
- Parking: Attached or detached garage with 2 spaces (garage present); Two or more parking spaces
- Utilities: Public water connected; Sewer connected
- Home design: Two-story building; Existing (previously built) condition
- Construction: Vinyl siding exterior; Asphalt roof; Block foundation; Built previously (existing structure)
- Exterior features: Irregular residential lot; Near public transit; City street frontage; Lot dimensions approximately 40 x 107
Interior
- Kitchen: Each unit includes an oven/range and refrigerator; One unit has an eat-in kitchen; both have formal dining rooms
- Bedrooms: One unit with 2 bedrooms; One unit with 3 bedrooms
- Flooring: Hardwood; Tile; Varies
- Bathrooms: Two full bathrooms (one in each unit)
- Heating & cooling: Gas forced-air heating
- Interior features: Hardwood and tile flooring throughout; some areas vary; Full basement
- Laundry & utility: Gas water heater; Separate gas and electric meters for each unit (2 of each)
Neighborhood map
What this means for you Summary
Snapshot
- This is a 6-bed/2.0-bath multifamily listed at $270k.
Deal economics
- At list price, monthly cash flow is $357 ($4k/yr) — positive.
- The deal already cash-flows at list — no discount required.
- Meets the 1% rule at list price ($3k rent vs $270k).
- Cap rate 7.9% vs local median 3.0% in Kenmore — top-decile yield for the area; either an underpriced asset or a hidden risk that comps aren't pricing in. Stress-test before assuming the spread holds.
Location & tenants
- Location reads 80/100 on livability (#114 in NY, #1,843 nationally) — a professional / high-income tenant draw. Strengths: amenities A+, housing A+, health & safety A+; Watch: crime D-, commute F.
- Kenmore-Tonawanda Union Free School District (suburban): math 44% / reading 47% proficiency, ranked #453 of 590 in NY (top 77%) — families likely to look elsewhere, expect single-tenant / working-renter base with shorter leases.
- Market conditions: Rents rising fast (+9.8%/yr); 99 active listings in the ZIP; 1,244 units permitted in Erie County in 2024 (563 in 5+ unit buildings).
- At $3,290/mo this rent would consume 53% of the median local household income ($74k/yr) (locally 727% of renters already pay >50% of income on rent) — very limited rent-growth headroom before tenants either downsize or default.
Forward outlook
- Local home prices are declining (-3.0%/yr); year-one equity from $2k of loan paydown is wiped out by about $8k of value loss. Plan a longer hold.
- At projected returns (-3.0% appreciation + 8.0% rent growth), your $76k cash investment doubles in ~9 years — after that, you're playing with house money.
Negotiation context
- Only 4 days on market — expect competitive offers; lowballing is unlikely to land.
- 2 sale attempts since 10y ago with the ask held roughly flat each time — persistent listings suggest the price (not the market) is what's stuck; bring a comps-based counter.
- Current owner paid $96k; list at $270k implies a 181% gain — meaningful room to come down on a strong offer.
Risks & watch-outs
- Watch-outs: property tax is 3.2% of price; built in 1930 — expect roof / HVAC / electrical / plumbing capex.
Questions for the listing agent
- Built in 1930 — when were the roof, HVAC, electrical panel, plumbing, and water heater last replaced?
- Property tax is high relative to price — has the assessment been appealed recently, and will the sale trigger a re-assessment?
- Is there a deadline driving the sale (1031 exchange, divorce, estate, relocation)? That informs how much negotiation room exists.
- Crime grade is D in this area — have there been break-ins, vandalism, or insurance claims at this property in the last 3 years? What carrier currently insures it and at what premium?
- What's the average days-on-market for RENTAL listings here right now (not sales)? A rising rental-DOM trend means longer vacancies and softer asking-rent achievability than the comps imply.
- What's the recent tenant-quality profile in this submarket — average credit score on applications, eviction rate, late-payment / NSF rate, and stable-employment percentage? A property-management company in the area should have these aggregated.
- How much new apartment / multifamily construction is in the pipeline within 1–3 miles? Heavy new supply (>2% of stock underway) typically softens rents 12–24 months out; light construction supports rent growth.
Investment metrics
- 1% rule
- 1.22% ✓
- Cap rate
- 7.88%
- Cash-on-cash
- 5.67%
- DSCR
- 1.25
- GRM
- 6.8
CMA / ARV
- ARV (on-the-fly)
- $306,332
- Comps found
- 12
Show comp detail 12 sales within ~0.75 mi
| Address | Dist | Beds/Ba | Sqft | Sold | Price | $/sf | Match |
|---|---|---|---|---|---|---|---|
| 137 Delaware Rd | 0.19mi | 5/2.0 (-1) | 2,288 (+2%) | 11mo | $355,000 | $155 | 73 |
| 163 Shepard Ave | 0.40mi | 6/2.0 | 2,282 (+2%) | 10mo | $272,500 | $119 | 69 |
| 312 Victoria Blvd | 0.54mi | 5/2.0 (-1) | 2,302 (+3%) | 1mo | $320,000 | $139 | 64 |
| 94 Parkwood Ave | 0.44mi | 6/2.0 | 2,172 (-3%) | 18mo | $326,000 | $150 | 60 |
| 1338 Kenmore Ave | 0.50mi | 6/2.0 | 2,288 (+2%) | 16mo | $171,000 | $75 | 60 |
| 186 Palmer Ave | 0.46mi | 6/2.0 | 2,435 (+9%) | 8mo | $310,000 | $127 | 58 |
| 153 Hinman Ave | 0.59mi | 5/2.0 (-1) | 2,152 (-4%) | 8mo | $150,000 | $70 | 55 |
| 46 Pullman Ave | 0.70mi | 6/2.0 | 2,336 (+4%) | 8mo | $320,000 | $137 | 53 |
| 310 Kinsey Ave | 0.56mi | 5/2.0 (-1) | 2,122 (-5%) | 8mo | $320,000 | $151 | 53 |
| 378 Wabash Ave | 0.66mi | 5/2.0 (-1) | 2,299 (+3%) | 13mo | $285,000 | $124 | 49 |
| 30 Pullman Ave | 0.68mi | 6/2.0 | 2,314 (+4%) | 18mo | $225,000 | $97 | 47 |
| 204 Euclid Ave | 0.57mi | 6/2.0 | 1,908 (-15%) | 20mo | $340,000 | $178 | 32 |
Match score weights: distance 35% · size 25% · config 20% · recency 20%. Top-matched comps best support the ARV.
Projected returns pro-forma
-3.0% appreciation · 8.0% rent growth · sell at horizon
- IRR
- -1.1%
- Equity multiple
- 0.96×
- Total profit
- $-3,305
- Equity at exit
- $40,243
- IRR
- 13.9%
- Equity multiple
- 2.41×
- Total profit
- $106,708
- Equity at exit
- $23,336
Cash invested: $75,572 (down + closing). Projections, not guarantees.
Landlord ↔ Tenant lean methodology
- Overall (STATE)
- 15 Strongly Tenant-Friendly
- State New York
- 15 Strongly Tenant-Friendly · D+10
- County
- — inherits STATE
- City
- — inherits STATE
ZIP-level market 14217
- Home prices YoY
- -34.3%
- Rents YoY
- 9.8%
- Active inventory
- 99
- Price-to-rent
- 20.5×
Monthly cashflow live
- Estimated rent
- $3,290 high interval (Pro) →
- Mortgage (P&I)
- −$1,415
- Tax from tax record
- −$714 /mo · $8,566/yr
- Insurance
- −$112
- HOA
- −$0
- Vacancy / Maint / Mgmt
- −$691
- Net cashflow
- $357
Break-even live
3-unit breakdown (identical units grouped — click to expand)
| Units | Beds | Baths | Est. rent |
|---|---|---|---|
| 3× units | 2 | 1 | $3,291 |
| #1 | 2 | 1 | $1,097 |
| #2 | 2 | 1 | $1,097 |
| #3 | 2 | 1 | $1,097 |
| Total (3 units) | $3,290 | ||
UW: 25.0% down · 7.5% · 30yr · 1.5% tax · 5.0% vac · 8.0% maint · 8.0% mgmt
Financing live
Cash to close
- Down payment
- $67,475
- Closing costs
- $8,097
- Reserves months
- —
- Total cash needed
- —
Loan-product check · same deal, 3 products live
Conventional
25% down · 7.5% · 30yr
- Down + closing
- —
- Monthly P&I
- —
- Monthly cashflow
- —
- DSCR
- —
- Eligible?
- —
Personal DTI + credit; lowest rate.
DSCR
20% down · 8.5% · 30yr
- Down + closing
- —
- Monthly P&I
- —
- Monthly cashflow
- —
- DSCR
- —
- Eligible?
- —
No personal income docs; deal must DSCR.
Hard money
10% down · 12.0% · 12mo
- Down + closing
- —
- Monthly P&I
- —
- Monthly cashflow
- —
- DSCR
- —
- Eligible?
- —
Short-term bridge; refi at stabilization.
Listing history 4 events
-
2026-06-07statusdays on market $269,900 Pending 4 DOM
-
2026-06-03days on market $269,900 Active 2 DOM
-
2026-06-02remarks 636-char remark
-
2026-06-02$269,900 Active 1 DOM
ⓘ Source: listings_history table (triggers on properties + properties_extension) + one-shot
backfill from property_details.listing_events for pre-trigger history.
Tax reassessment forecast NY · Partial reset (capped growth)
- Current annual tax
- $8,566 · $714/mo
- Projected year-2 tax
- $8,566 · $714/mo
- Expected delta
- $0/yr ($0/mo · 0.0%)
ⓘ Screening estimate from a state-policy table — verify with the county assessor before closing.
Climate risk First Street
- Flood 1/10 Low FEMA zone X (unshaded) · 0% chance over 30 yrs
- Wildfire 1/10 Low
- Heat 3/10 Moderate 7 d/yr ≥92°F today · 15 d/yr by 30 yrs out
- Wind 1/10 Low
- Air quality 3/10 Moderate 3 unhealthy d/yr today · 4 by 30 yrs out
Nearby sold comps map
Loading sold comps map…
Walkable amenities ~0.75 mi
Loading nearby amenities…
Taxation est. · year 1
- Rental income
- $39,480
- − Mortgage interest
- −$15,119
- − Property taxes
- −$8,566
- − Insurance
- −$1,350
- − Repairs & maintenance
- −$3,158
- − Management
- −$3,158
- − Depreciation
- −$7,852
- Taxable income
- $277
- Est. tax owed @ 24.0%
- −$66
- After-tax cash flow
- $4,222/yr
For passive investors: Depreciation is non-cash, so a rental often shows a tax loss while cash-flowing — sheltering income. Rental losses are passive: they offset passive income freely, and up to $25,000/yr can offset ordinary (W-2) income if you actively participate and your MAGI is under $100k (phasing out to $0 by $150k); unused losses carry forward. On sale, claimed depreciation is recaptured at up to 25%, and gains may owe capital-gains tax (a 1031 exchange can defer both). Figures are a year-1 estimate at your 24.0% rate — not tax advice; consult a CPA.
Schools (NCES district)
- District
- Kenmore-Tonawanda Union Free School District
- NCES district ID
- 3616230
- Math proficiency
- 44% ▼ -12.00%
- Reading proficiency
- 47% ▼ -1.00%
- Median HH income
- $51,433
- Composite
- 39.18/100
- National rank
- #4024
- State rank
- #453 of 590 in NY
Livability — Kenmore
- Score
- 80/100
- State rank
- #114
- US rank
- #1843
Category grades
Schools grade is shown separately in the Schools card above.
Census & demographics
- Census place
- Kenmore, NY
- County
- Erie County · 714,559 people
- City population
- 22,566
- Metro
- Buffalo-Cheektowaga, NY
- Population (ZIP)
- 22,471
- Household income
- $73,800
- Rent vs Own
- Severe rent burden
- 727.0
Population outlook (Erie County) Hauer SSP2
- Today (2025)
- 933,037 people
- By 2030
- 935,181 · +0.2%
- By 2040
- 928,531 · -0.5%
- By 2050
- 905,725 · -2.9%
- By 2075
- 834,037 · -10.6%
- By 2100
- 708,033 · -24.1%
Race, ethnicity, and origin ACS 2023
- Neighborhood character
- Predominantly White (82%)
- Race & ethnicity
- White 82% Two or more races 8% Hispanic / Latino 6% Black 5%
- Hispanic origin (detail)
- Puerto Rican 4%
- Common ancestry
- Romanian 13% Italian 2% Slovak 2%
- Foreign-born
- 4% · Canada
- Languages at home
- 94% English-only · Spanish 3% Arabic 1% Russian/Polish/Slavic 1%
Political lean MEDSL · Erie
- 2024 margin
- Lean D (+9.7) · D 54.8% · R 45.2%
- 2008→2024 swing
- -7.9pp toward R · 2008: 17.5pp · 2024: 9.7pp
- All cycles
- 2024: D+9.7 2020: D+14.7 2016: D+4.8 2012: D+15.6 2008: D+17.5
Not yet ingested
- Civics
- —
Market trends
- HPI YoY
- ▼ -172.52%
- Current HPI
- 330.7596
- Rent YoY
- ▲ 9.76%
- Metro
- Buffalo-Cheektowaga, NY
- State GDP YoY
- ▲ 2.60%
- F500 in state
- 92
Industry mix (Fortune 500 HQ in NY)
| Industry | F500 HQs | Revenue |
|---|---|---|
| Financial Services | 10 | $950B |
|
||
| Consumer Goods | 9 | $162B |
|
||
| Insurance | 4 | $225B |
|
||
| Telecommunications | 2 | $144B |
|
||
| Pharmaceuticals | 2 | $112B |
|
||
| Media / Entertainment | 2 | $69B |
|
||
Price history
+241.6% since first listed6 events — show timeline
- 2026-06-01 Listed $269,900 WNYREIS
- 2016-10-18 Sold (MLS) $96,000 WNYREIS
- 2016-10-12 Pending — WNYREIS
- 2016-09-01 Contingent — WNYREIS
- 2016-06-14 Listed $99,900 WNYREIS
- 2001-09-28 Sold (Public Records) $79,000 Public Records
Property tax history
+5.1%/yrLatest (2025): $8,566 · +2.3% YoY. Source: county tax records.
Cash-flow waterfall
monthlySold comps — $/sqft
last 12 mo · ≤1 miLoading sold comps…