5666 Middleton Ct · Columbia, SC
Flood risk 1/10 · Minimal
- FEMA flood zone
- X (unshaded)
- Chance of flooding over 30 yrs
- 0.0%
- Est. flood insurance / yr
- $507 – $1,088
Fire risk 3/10 · Minor
- Est. fire insurance / yr
- $783 – $1,453
Heat risk 6/10 · Moderate
- Hot days now (above 108°F)
- 7 days/yr
- Hot days in 30 yrs
- 15 days/yr
Wind risk 6/10 · Moderate
- Chance of severe wind over 30 yrs
- 69.0%
Air-quality risk 3/10 · Minor
- Unhealthy air days now
- 2 days/yr
- Unhealthy air days in 30 yrs
- 2 days/yr
Risk factors via First Street. Map © Google.
Why this score? — see what drove the F grade
The composite is a weighted blend of 9 inputs, each scored 0–100. Each bar is that input's sub-score; the figure is the points it added to the 100-point composite (weight × sub-score).
- ARV discount +7.5/15.0
- Cash flow +7.2/30.0
- Appreciation +5.0/10.0
- Livability +3.9/5.0
- Schools +2.6/10.0
- Rent growth +2.5/5.0
- Condition / age +2.5/5.0
- 1% rule +1.4/10.0
- DSCR +1.4/10.0
$199,900
🖨 Deal sheet (PDF) 📄 Offer letter ✓ Due diligence
Listing remarks
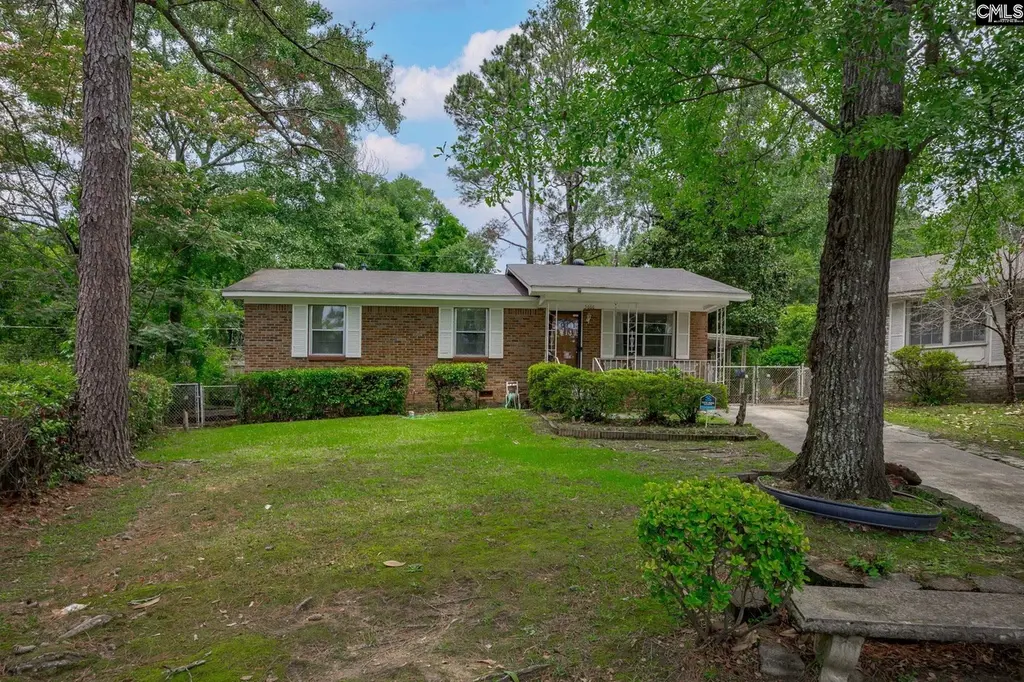
Create your own lifelong memories in this lovely all-brick bungalow nestled in a quiet cul-de-sac. Whether you are a first time homebuyer looking forward to those Pinterest moments you can create, or a retiree looking to downsize without sacrificing comfort in a quiet nice neighborhood, you should check out this home. Less than a 10 Minute drive to Columbia College, this four bedroom one and a half bath brick bungalow offers affordable single level living with peace of mind. All of the big ticket items have been replaced within the last five years, no worries about the roof, HVAC, Hot Water Heater and kitchen appliances! Inside the home features lots of original hardwood floors and a cozy,
Key facts
- Quiet cul-de-sac
- Carport
- Fenced backyard
Tags
Property features AI
Finance
- Other: Cable TV available
Exterior
- Parking: Two parking spaces; One garage space; Attached carport (main level)
- Utilities: Public sewer; Public water
- Home design: Single-story home
- Construction: Crawlspace foundation
- Exterior features: Covered front porch; Brick exterior on all sides above foundation; Rear aluminum fencing only; Paved road access; Public water
Interior
- Kitchen: Wood natural cabinets; Formica countertops; Free-standing range; Refrigerator
- Bedrooms: Master bedroom on the main level; Bedroom 2 on the main level; Bedroom 3 on the main level; Bedroom 4 on the main level
- Bathrooms: One full bath on the main level; One half bath on the main level; One full bath (total); One partial bath (total)
- Heating & cooling: Central cooling; Central heating; Gas pac heating
- Interior features: Workshop; Electric water heater; Free-standing range
- Laundry & utility: Washer and dryer included; Laundry in heated space on the main level
Neighborhood map
What this means for you Summary
Snapshot
- This is a 3-bed/2.0-bath single-family listed at $200k.
Deal economics
- At list price, monthly cash flow is $-277 ($-3k/yr) — negative.
- To cash-flow at today's rent, offer at most $151k (24.4% below list).
- To meet the 1% rule (rent ≥ 1% of price), the offer needs to be $128k (36.0% below list).
- Recommended offer: $128k (36.0% below list) — sets the bar for 1% rule.
Location & tenants
- Location reads 78/100 on livability (#18 in SC, #2,436 nationally) — a middle-class / working-renter tenant base. Strengths: amenities A+, commute A+, cost of living A+; Watch: employment D, crime F.
- Richland 01 (urban): math 26% / reading 36% proficiency, ranked #54 of 80 in SC (top 68%) — families likely to look elsewhere, expect single-tenant / working-renter base with shorter leases; 64% free/reduced lunch — lower-income household profile, screen leases tightly.
- Zoned schools: Arden Elementary (math 12% / reading 12%, grade F, #572 of 597 statewide, top 97%, 234 students, 100% FRL); Alcorn Middle (math 2% / reading 12%, grade F, #228 of 229 statewide, top 100%, 370 students, 100% FRL); C. A. Johnson High (math 34% / reading 84%, grade C+, #110 of 196 statewide, top 58%, 364 students, 100% FRL) — zoned schools average 100% FRL vs 64% district-wide (36 pts higher); higher-poverty schools than district average — tighter screening recommended.
- Market conditions: 1 active listings in the ZIP; 12 comparable units currently listed for rent nearby; rentals at typical pace (median 25d on market — plan ~3-4 weeks tenant-placement turnaround); 3,472 units permitted in Richland County in 2024 (1,096 in 5+ unit buildings).
Forward outlook
- In year one you build about $7k of equity ($1k loan paydown + $6k appreciation (3.0% local appreciation)).
- Richland County population projected at +30% by 2050 — long-run rental-demand tailwind backs the buy-and-hold thesis.
- By year 5, paydown + projected appreciation supports a ~$32k cash-out refi (75% LTV) — recoverable capital for the next deal without selling this one.
Negotiation context
- It's been on market 15 days — a 2% lower offer ($197k) is reasonable based on typical stale-listing flexibility.
Risks & watch-outs
- Climate carrying-cost: major wind risk, 69% chance of damaging wind over 30y; extreme-heat days projected 7→15/yr by 2055 (HVAC capex compounding) — expect insurance premiums to compound above CPI over the hold.
Questions for the listing agent
- What do current leases actually rent for vs. the listed asking? Can we see a recent rent roll and the last 12 months of T-12 income?
- Built in 1968 — when were the roof, HVAC, electrical panel, plumbing, and water heater last replaced?
- Is there a deadline driving the sale (1031 exchange, divorce, estate, relocation)? That informs how much negotiation room exists.
- Schools are D-rated, which usually means shorter tenancies and higher turnover. Who's the typical renter profile here, and what's been the actual vacancy rate?
- Crime grade is F in this area — have there been break-ins, vandalism, or insurance claims at this property in the last 3 years? What carrier currently insures it and at what premium?
- The area grade is low — what's the realistic commute time and amenity access for the typical tenant pool here? Any planned neighborhood developments (good or bad) we should know about?
- What's the average days-on-market for RENTAL listings here right now (not sales)? A rising rental-DOM trend means longer vacancies and softer asking-rent achievability than the comps imply.
- What's the recent tenant-quality profile in this submarket — average credit score on applications, eviction rate, late-payment / NSF rate, and stable-employment percentage? A property-management company in the area should have these aggregated.
- How much new for-sale + rental construction is in the pipeline within 1–3 miles? Heavy new supply typically softens prices + rents 12–24 months out; constrained supply supports both.
Investment metrics
- 1% rule
- 0.64% ✗
- Cap rate
- 4.63%
- Cash-on-cash
- -5.93%
- DSCR
- 0.74
- GRM
- 13.0
CMA / ARV
- ARV (on-the-fly)
- $59,032
- Comps found
- 1
Show comp detail 1 sale within ~0.75 mi
| Address | Dist | Beds/Ba | Sqft | Sold | Price | $/sf | Match |
|---|---|---|---|---|---|---|---|
| 5600 Holmes Ave | 0.15mi | 3/1.0 | 1,200 (-4%) | 24mo | $56,300 | $47 | 62 |
Match score weights: distance 35% · size 25% · config 20% · recency 20%. Top-matched comps best support the ARV.
Projected returns pro-forma
3.0% appreciation · 3.0% rent growth · sell at horizon
- IRR
- 2.0%
- Equity multiple
- 1.11×
- Total profit
- $6,429
- Equity at exit
- $89,884
- IRR
- 5.6%
- Equity multiple
- 1.85×
- Total profit
- $47,549
- Equity at exit
- $138,521
Cash invested: $55,972 (down + closing). Projections, not guarantees.
Landlord ↔ Tenant lean methodology
- Overall (STATE)
- 90 Strongly Landlord-Friendly
- State South Carolina
- 90 Strongly Landlord-Friendly · R+6
- County
- — inherits STATE
- City
- — inherits STATE
ZIP-level market 29203-6152
- Active inventory
- 1
- Price-to-rent
- 13.0×
Monthly cashflow live
- Estimated rent
- $1,280 high interval (Pro) →
- Mortgage (P&I)
- −$1,048
- Tax from tax record
- −$156 /mo · $1,871/yr
- Insurance
- −$83
- HOA
- −$0
- Vacancy / Maint / Mgmt
- −$269
- Net cashflow
- $-277
Break-even live
Sensitivity live
| Price | -10% $-163 | -5% $-220 | +0% $-277 | +5% $-333 | +10% $-390 |
|---|---|---|---|---|---|
| Rent | -10% $-378 | -5% $-327 | +0% $-277 | +5% $-226 | +10% $-175 |
| Rate | -1.0pp $-176 | -0.5pp $-226 | base $-277 | +0.5pp $-328 | +1.0pp $-381 |
UW: 25.0% down · 7.5% · 30yr · 1.5% tax · 5.0% vac · 8.0% maint · 8.0% mgmt
Financing live
Cash to close
- Down payment
- $49,975
- Closing costs
- $5,997
- Reserves months
- —
- Total cash needed
- —
Loan-product check · same deal, 3 products live
Conventional
25% down · 7.5% · 30yr
- Down + closing
- —
- Monthly P&I
- —
- Monthly cashflow
- —
- DSCR
- —
- Eligible?
- —
Personal DTI + credit; lowest rate.
DSCR
20% down · 8.5% · 30yr
- Down + closing
- —
- Monthly P&I
- —
- Monthly cashflow
- —
- DSCR
- —
- Eligible?
- —
No personal income docs; deal must DSCR.
Hard money
10% down · 12.0% · 12mo
- Down + closing
- —
- Monthly P&I
- —
- Monthly cashflow
- —
- DSCR
- —
- Eligible?
- —
Short-term bridge; refi at stabilization.
Rent comps 12 comps
| Address | Beds | Baths | Sqft | Rent | $/sqft | DOM | Units | Dist |
|---|---|---|---|---|---|---|---|---|
| 1063 Prescott Rd Columbia, SC | 2.0 | 1.5 | 1210 | $1,200 | $0.99 | 15d | 1 | 0.38mi |
| 5779 Ames Rd Unit 13B Columbia, SC | 2.0 | 1.0 | 895 | $1,000 | $1.12 | 12d | 1 | 0.38mi |
| 5779 Ames Rd Columbia, SC | 2.0 | 1.0 | 895 | $1,000 | $1.12 | 15d | 1 | 0.38mi |
| 1506 Charlton St Columbia, SC | 3.0 | 2.0 | 1491 | $1,500 | $1.01 | 25d | 1 | 0.92mi |
| 3015 English Ave Columbia, SC | 2.0 | 1.0 | 981 | $1,250 | $1.27 | 12d | 1 | 0.98mi |
| 3145 Bronx Rd Columbia, SC | 3.0 | 1.5 | 1207 | $1,511 | $1.25 | 25d | 1 | 1.04mi |
| 27 Bethune Ct Columbia, SC | 3.0 | 2.0 | 1523 | $1,625 | $1.07 | 25d | 1 | 1.08mi |
| 1931 Chaney St Columbia, SC | 2.0 | 1.0 | 1034 | $1,600 | $1.55 | 25d | 1 | 1.09mi |
| 2928 English Ave Unit NA Columbia, SC | 3.0 | 1.0 | 1320 | $1,590 | $1.20 | 12d | 1 | 1.11mi |
| 2308 Manse St Columbia, SC | 3.0 | 1.0 | 999 | $1,300 | $1.30 | 15d | 1 | 1.22mi |
| 209 Christian St Columbia, SC | 3.0 | 3.0 | 1585 | $800 | $0.50 | 25d | 1 | 1.29mi |
| 1115 Carter St Columbia, SC | 1.0–2.0 | 1.0 | 854 | $1,405 | $1.65 | 25d | 1 | 1.35mi |
Listing history 11 events
-
2026-06-21days on market $199,900 Active 15 DOM
-
2026-06-18days on market $199,900 Active 12 DOM
-
2026-06-17days on market $199,900 Active 11 DOM
-
2026-06-16days on market $199,900 Active 10 DOM
-
2026-06-15days on market $199,900 Active 9 DOM
-
2026-06-14days on market $199,900 Active 7 DOM
-
2026-06-10days on market $199,900 Active 4 DOM
-
2026-06-09days on market $199,900 Active 3 DOM
-
2026-06-08days on market $199,900 Active 2 DOM
-
2026-06-07remarks 699-char remark
-
2026-06-07$199,900 Active 1 DOM
ⓘ Source: listings_history table (triggers on properties + properties_extension) + one-shot
backfill from property_details.listing_events for pre-trigger history.
Tax reassessment forecast SC · Resets to sale price
- Current annual tax
- $1,871 · $156/mo
- Projected year-2 tax
- $1,871 · $156/mo
- Expected delta
- $0/yr ($0/mo · -0.0%)
ⓘ Screening estimate from a state-policy table — verify with the county assessor before closing.
Climate risk First Street
- Flood 1/10 Low FEMA zone X (unshaded) · 0% chance over 30 yrs
- Wildfire 3/10 Moderate
- Heat 6/10 Major 7 d/yr ≥108°F today · 15 d/yr by 30 yrs out
- Wind 6/10 Major 69% chance of damaging wind over 30 yrs
- Air quality 3/10 Moderate 2 unhealthy d/yr today · 2 by 30 yrs out
Nearby sold comps map
Loading sold comps map…
Walkable amenities ~0.75 mi
Loading nearby amenities…
Taxation est. · year 1
- Rental income
- $15,356
- − Mortgage interest
- −$11,198
- − Property taxes
- −$1,871
- − Insurance
- −$1,000
- − Repairs & maintenance
- −$1,229
- − Management
- −$1,229
- − Depreciation
- −$5,815
- Taxable loss
- −$6,984
- Est. tax savings @ 24.0%
- +$1,676
- After-tax cash flow
- $-1,642/yr
For passive investors: Depreciation is non-cash, so a rental often shows a tax loss while cash-flowing — sheltering income. Rental losses are passive: they offset passive income freely, and up to $25,000/yr can offset ordinary (W-2) income if you actively participate and your MAGI is under $100k (phasing out to $0 by $150k); unused losses carry forward. On sale, claimed depreciation is recaptured at up to 25%, and gains may owe capital-gains tax (a 1031 exchange can defer both). Figures are a year-1 estimate at your 24.0% rate — not tax advice; consult a CPA.
Schools (NCES district)
- District
- Richland 01
- NCES district ID
- 4503360
- Math proficiency
- 26% ▼ -7.00%
- Reading proficiency
- 36% ▼ -5.00%
- Median HH income
- $38,931
- Composite
- 25.94/100
- National rank
- #7335
- State rank
- #54 of 80 in SC
Livability — Columbia
- Score
- 78/100
- State rank
- #18
- US rank
- #2436
Category grades
Schools grade is shown separately in the Schools card above.
Census & demographics
- Census place
- Columbia, SC
Population outlook (Richland County) Hauer SSP2
- Today (2025)
- 459,667 people
- By 2030
- 487,524 · +6.1%
- By 2040
- 542,035 · +17.9%
- By 2050
- 595,371 · +29.5%
- By 2075
- 732,998 · +59.5%
- By 2100
- 820,415 · +78.5%
Not yet ingested
- Political lean
- —
- Race & ethnicity
- —
- Common origin
- —
- Civics
- —
Market trends
- HPI YoY
- —
- Current HPI
- —
- Rent YoY
- —
- Metro
- —
- State GDP YoY
- ▲ 4.51%
- F500 in state
- 2
Industry mix (Fortune 500 HQ in SC)
| Industry | F500 HQs | Revenue |
|---|---|---|
| Packaging | 1 | $7B |
|
||
Price history
1 event — show timeline
- 2026-06-06 Listed $199,900 Consolidated MLS
Property tax history
+11.0%/yrLatest (2025): $1,871 · +2.1% YoY. Source: county tax records.
Cash-flow waterfall
monthlySold comps — $/sqft
last 12 mo · ≤1 miLoading sold comps…