34912 Hawkiowa Rd · Ridge Manor, FL
Flood risk 4/10 · Minor
- FEMA flood zone
- X (unshaded)
- Chance of flooding over 30 yrs
- 0.22%
- Est. flood insurance / yr
- $507 – $1,088
Fire risk 6/10 · Moderate
- Est. fire insurance / yr
- $947 – $1,759
Heat risk 8/10 · Major
- Hot days now (above 108°F)
- 7 days/yr
- Hot days in 30 yrs
- 24 days/yr
Wind risk 9/10 · Severe
- Chance of severe wind over 30 yrs
- 99.0%
Air-quality risk 1/10 · Minimal
- Unhealthy air days now
- 0 days/yr
- Unhealthy air days in 30 yrs
- 0 days/yr
Risk factors via First Street. Map © Google.
Why this score? — see what drove the A grade
The composite is a weighted blend of 9 inputs, each scored 0–100. Each bar is that input's sub-score; the figure is the points it added to the 100-point composite (weight × sub-score).
- Cash flow +30.0/30.0
- ARV discount +15.0/15.0
- 1% rule +10.0/10.0
- DSCR +10.0/10.0
- Appreciation +10.0/10.0
- Schools +4.2/10.0
- Livability +3.2/5.0
- Rent growth +2.5/5.0
- Condition / age +2.5/5.0
$45,000
🖨 Deal sheet (PDF) 📄 Offer letter ✓ Due diligence
Listing remarks
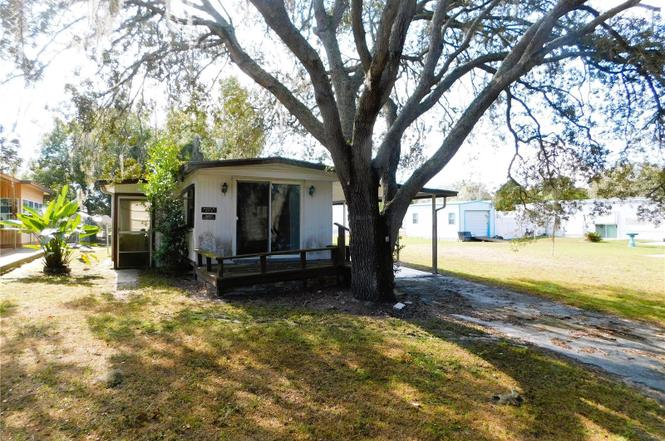
Investor or Handyman Special! Opportunity knocks in this 55+ community where you own the land and enjoy the freedom of low monthly costs. This mobile home is ready for someone with vision to bring it back to life. Floors will need replacement, and the metal roof requires attention. A/C status is unknown. Water is currently on. With some TLC, this property has great potential as a cozy winter retreat or comfortable year-round residence. A spacious Florida room adds valuable bonus living space—perfect for relaxing, hobbies, or entertaining once updated. If you're looking for an affordable project with solid upside in a desirable 55+ community, this is the one. Bring your tools and ima
Key facts
- Florida room
- Bonus living space
- 5,503 sq ft lot
Tags
Property features AI
Finance
- Other: Total annual fees $150
- HOA & community: Has optional HOA (monthly fee $12.50); Association amenities include clubhouse and shuffleboard court; Association fee covers recreational facilities; Senior community; Pets allowed; Golf carts allowed; Association recreation owned
Exterior
- Parking: Carport with 2 spaces
- Utilities: Public water; Public sewer; Broadband/High-Speed internet available; Cable available
- Home design: Mobile home (single wide); One story; Faces north; Property listed as residential, fixer condition
- Construction: Metal siding; Metal roof; Crawlspace foundation; Built on a single-wide body type
- Exterior features: Deck; Sliding doors; Storage shed(s); Mature landscaping; Public maintained paved/asphalt road access
Interior
- Kitchen: Range; Refrigerator
- Bedrooms: 1 bedroom
- Flooring: Carpet; Linoleum
- Bathrooms: 1 full bathroom
- Heating & cooling: Central heating; Central air conditioning
- Interior features: Ceiling fans; Living room / dining room combo; Florida room
- Laundry & utility: Washer; Dryer; Laundry located outside
Neighborhood map
What this means for you Summary
Snapshot
- This is a 2-bed/2.0-bath manufactured listed at $45k.
Deal economics
- At list price, monthly cash flow is $595 ($7k/yr) — positive.
- The deal already cash-flows at list — no discount required.
- Meets the 1% rule at list price ($1k rent vs $45k).
- Recommended offer: $40k (12.0% below list) — sets the bar for market timing.
Location & tenants
- Location reads 63/100 on livability (#736 in FL) — a middle-class / working-renter tenant base. Strengths: cost of living A+, housing A+, crime B+; Watch: health & safety C-, employment D, amenities F.
- Hernando (suburban): math 50% / reading 50% proficiency, ranked #38 of 73 in FL (top 52%) — acceptable for families but not a draw, mixed tenant base, ~2y average lease.
- Zoned schools: Eastside Elementary School (math 37% / reading 32%, grade F, #1,709 of 2,144 statewide, top 81%, 737 students, 73% FRL); D. S. Parrott Middle School (math 40% / reading 40%, grade F, #368 of 571 statewide, top 65%, 835 students, 67% FRL).
- Zoned-school proficiency averages 37% at this address vs 50% district-wide (-13 pts) — the specific schools serving this property underperform the Hernando average; the district grade overstates school quality for this exact location.
- Market conditions: 295 active listings in the ZIP; 2,505 units permitted in Hernando County in 2024 (318 in 5+ unit buildings).
Forward outlook
- In year one you build about $5k of equity ($311 loan paydown + $4k appreciation (10.0% local appreciation)).
- Hernando County population projected at +11% by 2050 — modest demand growth; plan on rents tracking national, not racing it.
- At projected returns (10.0% appreciation + 3.0% rent growth), your $13k cash investment doubles in ~2 years — after that, you're playing with house money.
- By year 7, paydown + projected appreciation supports a ~$35k cash-out refi (75% LTV) — recoverable capital for the next deal without selling this one.
Negotiation context
- It's been on market 194 days — a 12% lower offer ($40k) is reasonable based on typical stale-listing flexibility.
- 2 sale attempts since 2y ago; this cycle's ask has dropped $10k (18%) from the opening price — seller is motivated, your offer sets the floor, not the list.
- Current owner paid $28k; list at $45k implies a 58% gain — meaningful room to come down on a strong offer.
Risks & watch-outs
- Watch-outs: property tax is 2.5% of price.
Questions for the listing agent
- It's been on market 194 days. Have you received any prior offers? Is the seller open to a 12% concession, seller financing, or rate buy-down credit?
- Built in 1973 — when were the roof, HVAC, electrical panel, plumbing, and water heater last replaced?
- Property tax is high relative to price — has the assessment been appealed recently, and will the sale trigger a re-assessment?
- What does the HOA fee cover, when was the last increase, and are there any pending special assessments or reserve-fund shortfalls?
- Why hasn't it sold? Are there any deal-killer items the seller is aware of (foundation, flood, title, zoning, code violations)?
- Is there a deadline driving the sale (1031 exchange, divorce, estate, relocation)? That informs how much negotiation room exists.
- Schools are F-rated, which usually means shorter tenancies and higher turnover. Who's the typical renter profile here, and what's been the actual vacancy rate?
- What's the average days-on-market for RENTAL listings here right now (not sales)? A rising rental-DOM trend means longer vacancies and softer asking-rent achievability than the comps imply.
- What's the recent tenant-quality profile in this submarket — average credit score on applications, eviction rate, late-payment / NSF rate, and stable-employment percentage? A property-management company in the area should have these aggregated.
- How much new for-sale + rental construction is in the pipeline within 1–3 miles? Heavy new supply typically softens prices + rents 12–24 months out; constrained supply supports both.
Investment metrics
- 1% rule
- 2.69% ✓
- Cap rate
- 22.15%
- Cash-on-cash
- 56.63%
- DSCR
- 3.52
- GRM
- 3.1
CMA / ARV
- ARV (on-the-fly)
- $84,096
- Comps found
- 2
Show comp detail 2 sales within ~0.75 mi
| Address | Dist | Beds/Ba | Sqft | Sold | Price | $/sf | Match |
|---|---|---|---|---|---|---|---|
| 35004 Hawkiowa Rd | 0.18mi | 2/1.5 | 648 (+12%) | 3mo | $85,000 | $131 | 66 |
| 34925 Emily Dr | 0.27mi | 2/1.0 | 644 (+12%) | 4mo | $94,300 | $146 | 61 |
Match score weights: distance 35% · size 25% · config 20% · recency 20%. Top-matched comps best support the ARV.
Projected returns pro-forma
10.0% appreciation · 3.0% rent growth · sell at horizon
- IRR
- 69.3%
- Equity multiple
- 5.95×
- Total profit
- $62,431
- Equity at exit
- $40,540
- IRR
- 63.0%
- Equity multiple
- 13.24×
- Total profit
- $154,162
- Equity at exit
- $87,425
Cash invested: $12,600 (down + closing). Projections, not guarantees.
Landlord ↔ Tenant lean methodology
- Overall (STATE)
- 87 Strongly Landlord-Friendly
- State Florida
- 87 Strongly Landlord-Friendly · R+3
- County
- — inherits STATE
- City
- — inherits STATE
ZIP-level market 33523
- Home prices YoY
- 3.8%
- Active inventory
- 295
- Price-to-rent
- 3.1×
Monthly cashflow live
- Estimated rent
- $1,210 medium interval (Pro) →
- Mortgage (P&I)
- −$236
- Tax from tax record
- −$94 /mo · $1,131/yr
- Insurance
- −$19
- HOA
- −$12
- Vacancy / Maint / Mgmt
- −$254
- Net cashflow
- $595
Break-even live
Sensitivity live
| Price | -10% $620 | -5% $607 | +0% $595 | +5% $582 | +10% $569 |
|---|---|---|---|---|---|
| Rent | -10% $499 | -5% $547 | +0% $595 | +5% $642 | +10% $690 |
| Rate | -1.0pp $617 | -0.5pp $606 | base $595 | +0.5pp $583 | +1.0pp $571 |
UW: 25.0% down · 7.5% · 30yr · 1.5% tax · 5.0% vac · 8.0% maint · 8.0% mgmt
Financing live
Cash to close
- Down payment
- $11,250
- Closing costs
- $1,350
- Reserves months
- —
- Total cash needed
- —
Loan-product check · same deal, 3 products live
Conventional
25% down · 7.5% · 30yr
- Down + closing
- —
- Monthly P&I
- —
- Monthly cashflow
- —
- DSCR
- —
- Eligible?
- —
Personal DTI + credit; lowest rate.
DSCR
20% down · 8.5% · 30yr
- Down + closing
- —
- Monthly P&I
- —
- Monthly cashflow
- —
- DSCR
- —
- Eligible?
- —
No personal income docs; deal must DSCR.
Hard money
10% down · 12.0% · 12mo
- Down + closing
- —
- Monthly P&I
- —
- Monthly cashflow
- —
- DSCR
- —
- Eligible?
- —
Short-term bridge; refi at stabilization.
HOA detail
- Monthly dues
- $12 · $144/yr
- Likely covers
- water
Listing history 21 events
-
2026-06-21days on market $45,000 Active 194 DOM
-
2026-06-18days on market $45,000 Active 191 DOM
-
2026-06-17days on market $45,000 Active 190 DOM
-
2026-06-16days on market $45,000 Active 189 DOM
-
2026-06-15days on market $45,000 Active 188 DOM
-
2026-06-13days on market $45,000 Active 186 DOM
-
2026-06-13days on market $45,000 Active 185 DOM
-
2026-06-09days on market $45,000 Active 182 DOM
-
2026-06-08days on market $45,000 Active 181 DOM
-
2026-06-07days on market $45,000 Active 180 DOM
-
2026-06-04days on market $45,000 Active 177 DOM
-
2026-06-03days on market $45,000 Active 176 DOM
-
2026-06-02days on market $45,000 Active 175 DOM
-
2026-06-02pricedays on market $45,000 Active 174 DOM
-
2026-04-18price $48,000
-
2025-12-05$55,000 Active
-
2024-09-30historical
-
2024-04-17price $69,000
-
2024-03-08$72,000 Active
-
2002-07-24soldstatus $28,500
-
1980-01-01soldstatus $5,300
ⓘ Source: listings_history table (triggers on properties + properties_extension) + one-shot
backfill from property_details.listing_events for pre-trigger history.
Tax reassessment forecast FL · Resets to sale price
- Current annual tax
- $1,131 · $94/mo
- Projected year-2 tax
- $1,131 · $94/mo
- Expected delta
- $0/yr ($0/mo · 0.0%)
ⓘ Screening estimate from a state-policy table — verify with the county assessor before closing.
Climate risk First Street
- Flood 4/10 Moderate FEMA zone X (unshaded) · 22% chance over 30 yrs
- Wildfire 6/10 Major
- Heat 8/10 Severe 7 d/yr ≥108°F today · 24 d/yr by 30 yrs out
- Wind 9/10 Extreme 99% chance of damaging wind over 30 yrs
- Air quality 1/10 Low 0 unhealthy d/yr today · 0 by 30 yrs out
Nearby sold comps map
Loading sold comps map…
Walkable amenities ~0.75 mi
Loading nearby amenities…
Taxation est. · year 1
- Rental income
- $14,516
- − Mortgage interest
- −$2,521
- − Property taxes
- −$1,131
- − Insurance
- −$225
- − Repairs & maintenance
- −$1,161
- − Management
- −$1,161
- − HOA
- −$144
- − Depreciation
- −$1,309
- Taxable income
- $6,864
- Est. tax owed @ 24.0%
- −$1,647
- After-tax cash flow
- $5,489/yr
For passive investors: Depreciation is non-cash, so a rental often shows a tax loss while cash-flowing — sheltering income. Rental losses are passive: they offset passive income freely, and up to $25,000/yr can offset ordinary (W-2) income if you actively participate and your MAGI is under $100k (phasing out to $0 by $150k); unused losses carry forward. On sale, claimed depreciation is recaptured at up to 25%, and gains may owe capital-gains tax (a 1031 exchange can defer both). Figures are a year-1 estimate at your 24.0% rate — not tax advice; consult a CPA.
Schools (NCES district)
- District
- Hernando
- NCES district ID
- 1200810
- Math proficiency
- 50% ▼ -8.00%
- Reading proficiency
- 50% ▼ -4.00%
- Median HH income
- $41,985
- Composite
- 42.03/100
- National rank
- #3329
- State rank
- #38 of 73 in FL
Livability — Ridge Manor
- Score
- 63/100
- State rank
- #736
- US rank
- #15912
Category grades
Schools grade is shown separately in the Schools card above.
Census & demographics
- Census place
- Ridge Manor, FL
- City population
- 21,077
- Population (ZIP)
- 19,296
Population outlook (Hernando County) Hauer SSP2
- Today (2025)
- 189,218 people
- By 2030
- 194,367 · +2.7%
- By 2040
- 203,398 · +7.5%
- By 2050
- 209,589 · +10.8%
- By 2075
- 218,452 · +15.4%
- By 2100
- 205,923 · +8.8%
Race, ethnicity, and origin ACS 2023
- Neighborhood character
- Diverse neighborhood (Simpson 0.59)
- Race & ethnicity
- White 57% Hispanic / Latino 28% Black 10% Two or more races 10% Native American 3% Asian 1%
- Hispanic origin (detail)
- Mexican 21% Puerto Rican 2% Cuban 2%
- Common ancestry
- Lithuanian 5% Slovak 1% Romanian 1%
- Foreign-born
- 13% · Canada, China, Jamaica
- Languages at home
- 75% English-only · Spanish 21% Other Indo-European 2% Chinese 1%
Political lean MEDSL · Hernando
- 2024 margin
- Solid R (+37.0) · D 31.1% · R 68.2%
- 2008→2024 swing
- -33.5pp toward R · 2008: -3.6pp · 2024: -37.0pp
- All cycles
- 2024: R+37.0 2020: R+30.2 2016: R+29.0 2012: R+8.5 2008: R+3.6
Not yet ingested
- Civics
- —
Market trends
- HPI YoY
- ▲ 16.36%
- Current HPI
- 448.7
- Rent YoY
- —
- Metro
- —
- State GDP YoY
- ▲ 3.28%
- F500 in state
- 36
Industry mix (Fortune 500 HQ in FL)
| Industry | F500 HQs | Revenue |
|---|---|---|
| Industrial Technology | 2 | $29B |
|
||
| Insurance | 2 | $17B |
|
||
| Retail | 1 | $60B |
|
||
| Technology Distribution | 1 | $58B |
|
||
| Homebuilding | 1 | $35B |
|
||
| Technology Manufacturing | 1 | $35B |
|
||
Price history
+805.7% since first listed7 events — show timeline
- 2026-04-18 Price Changed $48,000 Stellar MLS as Distributed by MLS Grid
- 2025-12-05 Listed $55,000 Stellar MLS as Distributed by MLS Grid
- 2024-09-30 Listing Removed — Stellar MLS as Distributed by MLS Grid
- 2024-04-17 Price Changed $69,000 Stellar MLS as Distributed by MLS Grid
- 2024-03-08 Listed $72,000 Stellar MLS as Distributed by MLS Grid
- 2002-07-24 Sold (Public Records) $28,500 Public Records
- 1980-01-01 Sold (Public Records) $5,300 Public Records
Property tax history
+6.2%/yrLatest (2025): $1,131 · +1.1% YoY. Source: county tax records.
Cash-flow waterfall
monthlySold comps — $/sqft
last 12 mo · ≤1 miLoading sold comps…