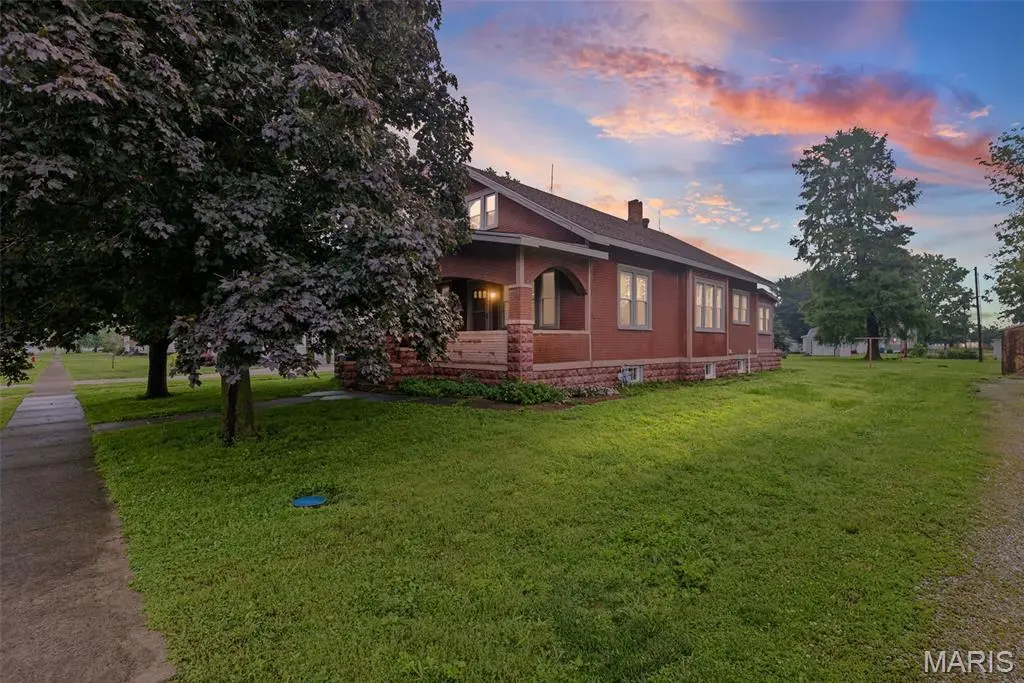
150 N Park St · Hoyleton, IL
Flood risk 1/10 · Minimal
- FEMA flood zone
- —
- Chance of flooding over 30 yrs
- 0.0%
- Est. flood insurance / yr
- —
Fire risk 1/10 · Minimal
- Est. fire insurance / yr
- $804 – $1,492
Heat risk 5/10 · Moderate
- Hot days now (above 105°F)
- 7 days/yr
- Hot days in 30 yrs
- 21 days/yr
Wind risk 2/10 · Minimal
- Chance of severe wind over 30 yrs
- 2.0%
Air-quality risk 4/10 · Minor
- Unhealthy air days now
- 3 days/yr
- Unhealthy air days in 30 yrs
- 5 days/yr
Risk factors via First Street. Map © Google.
Why this score? — see what drove the B grade
The composite is a weighted blend of 9 inputs, each scored 0–100. Each bar is that input's sub-score; the figure is the points it added to the 100-point composite (weight × sub-score).
- Cash flow +30.0/30.0
- DSCR +10.0/10.0
- 1% rule +9.0/10.0
- ARV discount +7.5/15.0
- Appreciation +5.9/10.0
- Livability +3.6/5.0
- Schools +2.9/10.0
- Rent growth +2.5/5.0
- Condition / age +2.5/5.0
$90,000
🖨 Deal sheet 📄 Offer letter ✓ Due diligence
Listing remarks
What an OPPORTUNITY to invest in sturdy house on a quiet street in the charming town of Hoyleton - all at an affordable price! Tucked behind two big, beautiful maple trees, this craftsman style home welcomes you with its large front porch. Inside, discover tall ceilings, wide trim molding, and original double pocket doors. The windows have all been updated for efficiency within the last 3 years. Other updates have included a new roof in 2021, Furnace 2012, AC 2025, and water heater 2020. The deep lot offers plenty of options for building a large garage or simply enjoying the big backyard. Bring your imagination to visualize all the possibilities!
Key facts
- Wide trim molding
- Craftsman style home
- Large front porch
Tags
Property features AI
Exterior
- Parking: Off-street parking; 1-car garage; 1-car carport; 2 parking spaces total
- Utilities: Public water; Public sewer; Electricity (Ameren); Electricity connected; Sewer connected
- Home design: Single family residence; One and one-half levels; Residential property
- Construction: Brick and frame construction
- Exterior features: Covered, enclosed front porch; Rear porch; Back yard; Front yard; Few trees; Level lot
Interior
- Kitchen: Range; Free-standing refrigerator
- Bedrooms: 3 bedrooms total (2 on main level, 1 on upper level)
- Bathrooms: 1 full bathroom
- Heating & cooling: Forced air heating; Central air conditioning
- Interior features: Stacked washer/dryer; Range; Free-standing refrigerator; Full basement
- Laundry & utility: Stacked washer/dryer
Neighborhood map
What this means for you Summary
Snapshot
- This is a 3-bed/1.0-bath single-family listed at $90k.
Deal economics
- At list price, monthly cash flow is $389 ($5k/yr) — positive.
- The deal already cash-flows at list — no discount required.
- Meets the 1% rule at list price ($1k rent vs $90k).
- Recommended offer: $89k (1.5% below list) — sets the bar for market timing.
Location & tenants
- Location reads 72/100 on livability (#311 in IL) — a middle-class / working-renter tenant base. Strengths: cost of living A+, housing A+, employment B+; Watch: commute D, crime D-, amenities F.
- Nashville Chsd 99 (town): math 30% / reading 30% proficiency, ranked #480 of 919 in IL (top 52%) — families likely to look elsewhere, expect single-tenant / working-renter base with shorter leases.
- Zoned schools: Nashville Comm High School (math 12% / reading 32%, grade F, #319 of 693 statewide, top 50%, 411 students, 0% FRL).
- Market conditions: 3 active listings in the ZIP; 17 units permitted in Washington County in 2024 (0 in 5+ unit buildings).
Forward outlook
- In year one you build about $2k of equity ($622 loan paydown + $2k appreciation (1.8% local appreciation)).
- Washington County population projected at -24% by 2050 — secular population decline; favor cash flow + early exit over multi-decade hold.
- At projected returns (1.8% appreciation + 3.0% rent growth), your $25k cash investment doubles in ~4 years — after that, you're playing with house money.
Negotiation context
- It's been on market 15 days — a 2% lower offer ($89k) is reasonable based on typical stale-listing flexibility.
Risks & watch-outs
- Watch-outs: built in 1912 — expect roof / HVAC / electrical / plumbing capex.
- Climate carrying-cost: extreme-heat days projected 7→21/yr by 2055 (HVAC capex compounding) — expect insurance premiums to compound above CPI over the hold.
Questions for the listing agent
- Built in 1912 — when were the roof, HVAC, electrical panel, plumbing, and water heater last replaced?
- Is there a deadline driving the sale (1031 exchange, divorce, estate, relocation)? That informs how much negotiation room exists.
- Crime grade is D in this area — have there been break-ins, vandalism, or insurance claims at this property in the last 3 years? What carrier currently insures it and at what premium?
- What's the average days-on-market for RENTAL listings here right now (not sales)? A rising rental-DOM trend means longer vacancies and softer asking-rent achievability than the comps imply.
- What's the recent tenant-quality profile in this submarket — average credit score on applications, eviction rate, late-payment / NSF rate, and stable-employment percentage? A property-management company in the area should have these aggregated.
- How much new for-sale + rental construction is in the pipeline within 1–3 miles? Heavy new supply typically softens prices + rents 12–24 months out; constrained supply supports both.
Investment metrics
- 1% rule
- 1.40% ✓
- Cap rate
- 11.48%
- Cash-on-cash
- 18.53%
- DSCR
- 1.82
- GRM
- 5.9
CMA / ARV
- ARV (on-the-fly)
- $208,608
- Comps found
- 2
Show comp detail 2 sales within ~0.75 mi
| Address | Dist | Beds/Ba | Sqft | Sold | Price | $/sf | Match |
|---|---|---|---|---|---|---|---|
| 165 S Park St | 0.25mi | 3/1.5 | 2,489 (-2%) | 9mo | $199,900 | $80 | 75 |
| 172 W Saint Louis St | 0.28mi | 3/4.0 | 2,442 (-4%) | 10mo | $199,900 | $82 | 60 |
Match score weights: distance 35% · size 25% · config 20% · recency 20%. Top-matched comps best support the ARV.
Projected returns pro-forma
1.81% appreciation · 3.0% rent growth · sell at horizon
- IRR
- 22.4%
- Equity multiple
- 2.19×
- Total profit
- $30,101
- Equity at exit
- $34,575
- IRR
- 24.5%
- Equity multiple
- 4.16×
- Total profit
- $79,686
- Equity at exit
- $49,089
Cash invested: $25,200 (down + closing). Projections, not guarantees.
Landlord ↔ Tenant lean methodology
- Overall (STATE)
- 43 Moderately Tenant-Leaning
- State Illinois
- 43 Moderately Tenant-Leaning · D+7
- County
- — inherits STATE
- City
- — inherits STATE
ZIP-level market 62803
- Home prices YoY
- 1.2%
- Active inventory
- 3
- Price-to-rent
- 5.9×
Monthly cashflow live
- Estimated rent
- $1,264 medium interval (Pro) →
- Mortgage (P&I)
- −$472
- Tax from tax record
- −$100 /mo · $1,199/yr
- Insurance
- −$38
- HOA
- −$0
- Vacancy / Maint / Mgmt
- −$265
- Net cashflow
- $389
Break-even live
UW: 25.0% down · 7.5% · 30yr · 1.5% tax · 5.0% vac · 8.0% maint · 8.0% mgmt
Financing live
Cash to close
- Down payment
- $22,500
- Closing costs
- $2,700
- Reserves months
- —
- Total cash needed
- —
Loan-product check · same deal, 3 products live
Conventional
25% down · 7.5% · 30yr
- Down + closing
- —
- Monthly P&I
- —
- Monthly cashflow
- —
- DSCR
- —
- Eligible?
- —
Personal DTI + credit; lowest rate.
DSCR
20% down · 8.5% · 30yr
- Down + closing
- —
- Monthly P&I
- —
- Monthly cashflow
- —
- DSCR
- —
- Eligible?
- —
No personal income docs; deal must DSCR.
Hard money
10% down · 12.0% · 12mo
- Down + closing
- —
- Monthly P&I
- —
- Monthly cashflow
- —
- DSCR
- —
- Eligible?
- —
Short-term bridge; refi at stabilization.
Listing history 14 events
-
2026-06-18days on market $90,000 Active 15 DOM
-
2026-06-18price $90,000 Active 14 DOM
-
2026-06-17days on market $95,000 Active 14 DOM
-
2026-06-17status $95,000 Active 13 DOM
-
2026-06-16days on market $95,000 Active Under Contract 13 DOM
-
2026-06-15days on market $95,000 Active Under Contract 12 DOM
-
2026-06-13days on market $95,000 Active Under Contract 10 DOM
-
2026-06-12days on market $95,000 Active Under Contract 9 DOM
-
2026-06-09days on market $95,000 Active Under Contract 6 DOM
-
2026-06-08statusdays on market $95,000 Active Under Contract 5 DOM
-
2026-06-07days on market $95,000 Active 4 DOM
-
2026-06-05days on market $95,000 Active 2 DOM
-
2026-06-04remarks 654-char remark
-
2026-06-04$95,000 Active 1 DOM
ⓘ Source: listings_history table (triggers on properties + properties_extension) + one-shot
backfill from property_details.listing_events for pre-trigger history.
Tax reassessment forecast IL · Partial reset (capped growth)
- Current annual tax
- $1,199 · $100/mo
- Projected year-2 tax
- $1,621 · $135/mo
- Expected delta
- +$422/yr (+$35/mo · 35.2%)
ⓘ Screening estimate from a state-policy table — verify with the county assessor before closing.
Climate risk First Street
- Flood 1/10 Low 0% chance over 30 yrs
- Wildfire 1/10 Low
- Heat 5/10 Major 7 d/yr ≥105°F today · 21 d/yr by 30 yrs out
- Wind 2/10 Low 2% chance of damaging wind over 30 yrs
- Air quality 4/10 Moderate 3 unhealthy d/yr today · 5 by 30 yrs out
Nearby sold comps map
Loading sold comps map…
Walkable amenities ~0.75 mi
Loading nearby amenities…
Taxation est. · year 1
- Rental income
- $15,168
- − Mortgage interest
- −$5,041
- − Property taxes
- −$1,199
- − Insurance
- −$450
- − Repairs & maintenance
- −$1,213
- − Management
- −$1,213
- − Depreciation
- −$2,618
- Taxable income
- $3,433
- Est. tax owed @ 24.0%
- −$824
- After-tax cash flow
- $3,846/yr
For passive investors: Depreciation is non-cash, so a rental often shows a tax loss while cash-flowing — sheltering income. Rental losses are passive: they offset passive income freely, and up to $25,000/yr can offset ordinary (W-2) income if you actively participate and your MAGI is under $100k (phasing out to $0 by $150k); unused losses carry forward. On sale, claimed depreciation is recaptured at up to 25%, and gains may owe capital-gains tax (a 1031 exchange can defer both). Figures are a year-1 estimate at your 24.0% rate — not tax advice; consult a CPA.
Schools (NCES district)
- District
- Nashville Chsd 99
- NCES district ID
- 1727740
- Math proficiency
- 30% ▼ -10.00%
- Reading proficiency
- 30% ▬ 0.00%
- Median HH income
- $52,187
- Composite
- 29.25/100
- National rank
- #11849
- State rank
- #480 of 919 in IL
Livability — Hoyleton
- Score
- 72/100
- State rank
- #311
- US rank
- #6127
Category grades
Schools grade is shown separately in the Schools card above.
Census & demographics
- Census place
- Hoyleton, IL
- Population (ZIP)
- 1,138
Population outlook (Washington County) Hauer SSP2
- Today (2025)
- 13,333 people
- By 2030
- 12,743 · -4.4%
- By 2040
- 11,441 · -14.2%
- By 2050
- 10,114 · -24.1%
- By 2075
- 7,372 · -44.7%
- By 2100
- 5,000 · -62.5%
Race, ethnicity, and origin ACS 2023
- Neighborhood character
- Predominantly White (94%)
- Race & ethnicity
- White 94% Hispanic / Latino 3% Black 2%
- Common ancestry
- Italian 3% Romanian 3% Lithuanian 1%
- Foreign-born
- 1% · Canada
- Languages at home
- 98% English-only · Spanish 2%
Political lean MEDSL · Washington
- 2024 margin
- Solid R (+57.2) · D 20.7% · R 77.9% · Other 1.4%
- 2008→2024 swing
- -43.0pp toward R · 2008: -14.3pp · 2024: -57.2pp
- All cycles
- 2024: R+57.2 2020: R+56.5 2016: R+55.9 2012: R+31.6 2008: R+14.3
Not yet ingested
- Civics
- —
Market trends
- HPI YoY
- ▲ 1.81%
- Current HPI
- 147.7905
- Rent YoY
- —
- Metro
- —
- State GDP YoY
- ▲ 1.59%
- F500 in state
- 60
Industry mix (Fortune 500 HQ in IL)
| Industry | F500 HQs | Revenue |
|---|---|---|
| Insurance | 4 | $201B |
|
||
| Consumer Goods | 4 | $87B |
|
||
| Industrial Machinery | 3 | $64B |
|
||
| Healthcare | 2 | $55B |
|
||
| Retail / Pharmacy | 1 | $148B |
|
||
| Agriculture / Food | 1 | $86B |
|
||
Price history
1 event — show timeline
- 2026-06-03 Listed $95,000 MARIS as Distributed by MLS Grid
Property tax history
-1.3%/yrLatest (2024): $1,199 · -0.6% YoY. Source: county tax records.
Cash-flow waterfall
monthlySold comps — $/sqft
last 12 mo · ≤1 miLoading sold comps…