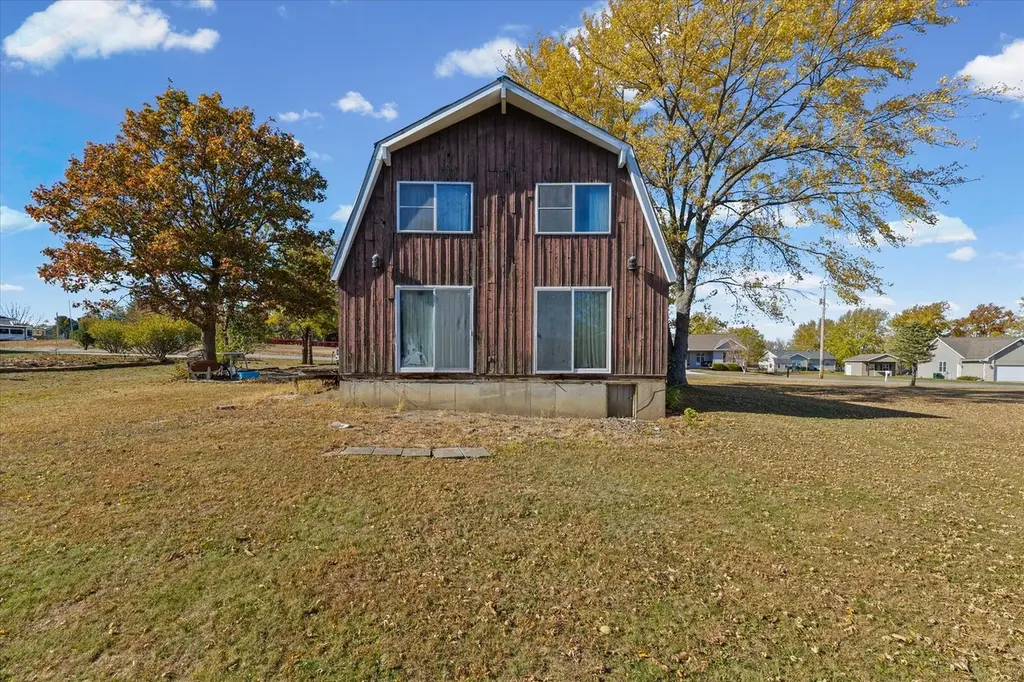
144 Pawnee Dr · Loda, IL
Flood risk 1/10 · Minimal
- FEMA flood zone
- X (unshaded)
- Chance of flooding over 30 yrs
- 0.0%
- Est. flood insurance / yr
- $507 – $1,088
Fire risk 3/10 · Minor
- Est. fire insurance / yr
- $804 – $1,492
Heat risk 3/10 · Minor
- Hot days now (above 104°F)
- 7 days/yr
- Hot days in 30 yrs
- 17 days/yr
Wind risk 2/10 · Minimal
- Chance of severe wind over 30 yrs
- 1.0%
Air-quality risk 2/10 · Minimal
- Unhealthy air days now
- 1 days/yr
- Unhealthy air days in 30 yrs
- 1 days/yr
Risk factors via First Street. Map © Google.
Why this score? — see what drove the B- grade
The composite is a weighted blend of 9 inputs, each scored 0–100. Each bar is that input's sub-score; the figure is the points it added to the 100-point composite (weight × sub-score).
- Cash flow +30.0/30.0
- 1% rule +10.0/10.0
- DSCR +10.0/10.0
- ARV discount +7.5/15.0
- Livability +2.9/5.0
- Schools +2.7/10.0
- Rent growth +2.5/5.0
- Condition / age +2.5/5.0
- Appreciation +0.0/10.0
$65,000
🖨 Deal sheet 📄 Offer letter ✓ Due diligence
Listing remarks
Here's your chance to enjoy lake life at Lake Iroquois! This property is a blank slate - ready for an investor, flipper, or handy buyer to make it their own and build instant equity. The home offers a solid start with endless potential for updates or a complete redesign to fit your vision. Ownership includes access to all Lake Iroquois amenities, including the lake, beach, pool, playgrounds, and more. Whether you're looking for a weekend getaway or your next project, this is an affordable way to get your foot in the door to lake living.
Key facts
- Beach
- Playgrounds
- Pool
Tags
Property features AI
Finance
- Other: Property assessed/area information sourced from assessor; Property age listed as 51–60 years
- HOA & community: Association fee $2,500 annually (includes other services)
Exterior
- Parking: 2 parking spaces; Asphalt parking surface
- Utilities: Public water; Public sewer
- Home design: Detached single-family home; 1.5-story design; Fee simple ownership; Built before 1978
- Construction: Cedar construction
- Exterior features: Lot dimensions approximately 155 x 122 x 140 x 125; Less than 0.25 acre lot; Zoned single-family
Interior
- Kitchen: Refrigerator; Range
- Bedrooms: 3 bedrooms (Master bedroom located on the second level; additional bedrooms on the main level: 14 x 13 and 13 x 9)
- Bathrooms: 1 full bathroom
- Heating & cooling: Natural gas heating
- Interior features: 6 total rooms; Crawl space basement
- Laundry & utility: Dedicated laundry room
Neighborhood map
What this means for you Summary
Snapshot
- This is a 3-bed/1.0-bath single-family listed at $65k.
Deal economics
- At list price, monthly cash flow is $255 ($3k/yr) — positive.
- The deal already cash-flows at list — no discount required.
- Meets the 1% rule at list price ($1k rent vs $65k).
- Recommended offer: $63k (3.0% below list) — sets the bar for market timing.
Location & tenants
- Location reads 58/100 on livability (#1,122 in IL) — a working-class tenant base; expect higher turnover. Strengths: cost of living A+, housing A+; Watch: crime D, schools F, amenities F.
- Paxton-Buckley-Loda CUD 10 (town): math 33% / reading 29% proficiency, ranked #232 of 620 in IL (top 37%) — families likely to look elsewhere, expect single-tenant / working-renter base with shorter leases.
- Market conditions: 21 active listings in the ZIP; 14 units permitted in Iroquois County in 2024 (0 in 5+ unit buildings).
Forward outlook
- Local home prices are declining (-3.0%/yr); year-one equity from $449 of loan paydown is wiped out by about $2k of value loss. Plan a longer hold.
- Iroquois County population projected at -20% by 2050 — secular population decline; favor cash flow + early exit over multi-decade hold.
- At projected returns (-3.0% appreciation + 3.0% rent growth), your $18k cash investment doubles in ~8 years — after that, you're playing with house money.
Negotiation context
- It's been on market 55 days — a 3% lower offer ($63k) is reasonable based on typical stale-listing flexibility.
- 4 sale attempts since 22y ago with the ask held roughly flat each time — persistent listings suggest the price (not the market) is what's stuck; bring a comps-based counter.
- Current owner paid $48k; 35% above their basis — modest negotiation headroom, anchor on the comps not their cost.
Questions for the listing agent
- It's been on market 55 days. Have you received any prior offers? Is the seller open to a 3% concession, seller financing, or rate buy-down credit?
- Built in 1974 — when were the roof, HVAC, electrical panel, plumbing, and water heater last replaced?
- What does the HOA fee cover, when was the last increase, and are there any pending special assessments or reserve-fund shortfalls?
- Is there a deadline driving the sale (1031 exchange, divorce, estate, relocation)? That informs how much negotiation room exists.
- Schools are F-rated, which usually means shorter tenancies and higher turnover. Who's the typical renter profile here, and what's been the actual vacancy rate?
- Crime grade is D in this area — have there been break-ins, vandalism, or insurance claims at this property in the last 3 years? What carrier currently insures it and at what premium?
- What's the average days-on-market for RENTAL listings here right now (not sales)? A rising rental-DOM trend means longer vacancies and softer asking-rent achievability than the comps imply.
- What's the recent tenant-quality profile in this submarket — average credit score on applications, eviction rate, late-payment / NSF rate, and stable-employment percentage? A property-management company in the area should have these aggregated.
- How much new for-sale + rental construction is in the pipeline within 1–3 miles? Heavy new supply typically softens prices + rents 12–24 months out; constrained supply supports both.
Investment metrics
- 1% rule
- 1.79% ✓
- Cap rate
- 11.00%
- Cash-on-cash
- 16.80%
- DSCR
- 1.75
- GRM
- 4.7
CMA / ARV
- ARV (median comp)
- $223,535
- List price
- $65,000
- Delta
- -70.92%
- Verdict
- UNDERPRICED
- Comps
- 20 within 1.0 mi
Show comp detail 4 sales within ~0.75 mi
| Address | Dist | Beds/Ba | Sqft | Sold | Price | $/sf | Match |
|---|---|---|---|---|---|---|---|
| 148 Pawnee Dr | 0.03mi | 3/2.0 | 1,452 (+9%) | 11mo | $184,500 | $127 | 71 |
| 134 Chippewa Dr | 0.69mi | 3/1.0 | 1,200 (-10%) | 15mo | $129,000 | $108 | 38 |
| 118 Cayuga Ln | 0.61mi | 2/2.0 (-1) | 1,272 (-5%) | 20mo | $325,000 | $256 | 38 |
| 613 Skyline Dr | 0.52mi | 4/4.0 (+1) | 1,480 (+11%) | 9mo | $496,000 | $335 | 33 |
Match score weights: distance 35% · size 25% · config 20% · recency 20%. Top-matched comps best support the ARV.
Projected returns pro-forma
-3.0% appreciation · 3.0% rent growth · sell at horizon
- IRR
- 8.2%
- Equity multiple
- 1.32×
- Total profit
- $5,846
- Equity at exit
- $9,692
- IRR
- 17.6%
- Equity multiple
- 2.46×
- Total profit
- $26,595
- Equity at exit
- $5,620
Cash invested: $18,200 (down + closing). Projections, not guarantees.
Landlord ↔ Tenant lean methodology
- Overall (STATE)
- 43 Moderately Tenant-Leaning
- State Illinois
- 43 Moderately Tenant-Leaning · D+7
- County
- — inherits STATE
- City
- — inherits STATE
ZIP-level market 60948
- Home prices YoY
- -5.8%
- Active inventory
- 21
- Price-to-rent
- 4.7×
Monthly cashflow live
- Estimated rent
- $1,162 medium interval (Pro) →
- Mortgage (P&I)
- −$341
- Tax from tax record
- −$87 /mo · $1,049/yr
- Insurance
- −$27
- HOA
- −$208
- Vacancy / Maint / Mgmt
- −$244
- Net cashflow
- $255
Break-even live
UW: 25.0% down · 7.5% · 30yr · 1.5% tax · 5.0% vac · 8.0% maint · 8.0% mgmt
Financing live
Cash to close
- Down payment
- $16,250
- Closing costs
- $1,950
- Reserves months
- —
- Total cash needed
- —
Loan-product check · same deal, 3 products live
Conventional
25% down · 7.5% · 30yr
- Down + closing
- —
- Monthly P&I
- —
- Monthly cashflow
- —
- DSCR
- —
- Eligible?
- —
Personal DTI + credit; lowest rate.
DSCR
20% down · 8.5% · 30yr
- Down + closing
- —
- Monthly P&I
- —
- Monthly cashflow
- —
- DSCR
- —
- Eligible?
- —
No personal income docs; deal must DSCR.
Hard money
10% down · 12.0% · 12mo
- Down + closing
- —
- Monthly P&I
- —
- Monthly cashflow
- —
- DSCR
- —
- Eligible?
- —
Short-term bridge; refi at stabilization.
HOA detail
- Monthly dues
- $208 · $2,496/yr
- Likely covers
- landscapingpool
Listing history 30 events
-
2026-06-18days on market $65,000 Active 55 DOM
-
2026-06-17days on market $65,000 Active 54 DOM
-
2026-06-16days on market $65,000 Active 53 DOM
-
2026-06-15days on market $65,000 Active 52 DOM
-
2026-06-14days on market $65,000 Active 50 DOM
-
2026-06-13days on market $65,000 Active 49 DOM
-
2026-06-10days on market $65,000 Active 47 DOM
-
2026-06-09days on market $65,000 Active 46 DOM
-
2026-06-08days on market $65,000 Active 45 DOM
-
2026-06-07days on market $65,000 Active 44 DOM
-
2026-06-05days on market $65,000 Active 41 DOM
-
2026-06-02days on market $65,000 Active 39 DOM
-
2026-06-01days on market $65,000 Active 38 DOM
-
2026-05-31days on market $65,000 Active 37 DOM
-
2026-05-30days on market $65,000 Active 36 DOM
-
2026-04-24historical
-
2026-04-24$65,000 Active 543-char remark
-
2026-01-02price
-
2025-11-18price
-
2024-04-26soldstatus $48,000
-
2011-04-08soldstatus $36,000
-
2011-04-08soldstatus $36,000
-
2011-03-17historical
-
2010-09-21
-
2009-04-17historical
-
2008-05-17
-
2007-04-01soldstatus $75,000
-
2004-10-01soldstatus $60,000
-
2004-10-01soldstatus $60,000
-
2004-04-28$75,000
ⓘ Source: listings_history table (triggers on properties + properties_extension) + one-shot
backfill from property_details.listing_events for pre-trigger history.
Tax reassessment forecast IL · Partial reset (capped growth)
- Current annual tax
- $1,049 · $87/mo
- Projected year-2 tax
- $1,262 · $105/mo
- Expected delta
- +$213/yr (+$18/mo · 20.3%)
ⓘ Screening estimate from a state-policy table — verify with the county assessor before closing.
Climate risk First Street
- Flood 1/10 Low FEMA zone X (unshaded) · 0% chance over 30 yrs
- Wildfire 3/10 Moderate
- Heat 3/10 Moderate 7 d/yr ≥104°F today · 17 d/yr by 30 yrs out
- Wind 2/10 Low 100% chance of damaging wind over 30 yrs
- Air quality 2/10 Low 1 unhealthy d/yr today · 1 by 30 yrs out
Nearby sold comps map
Loading sold comps map…
Walkable amenities ~0.75 mi
Loading nearby amenities…
Taxation est. · year 1
- Rental income
- $13,948
- − Mortgage interest
- −$3,641
- − Property taxes
- −$1,049
- − Insurance
- −$325
- − Repairs & maintenance
- −$1,116
- − Management
- −$1,116
- − HOA
- −$2,496
- − Depreciation
- −$1,891
- Taxable income
- $2,314
- Est. tax owed @ 24.0%
- −$555
- After-tax cash flow
- $2,503/yr
For passive investors: Depreciation is non-cash, so a rental often shows a tax loss while cash-flowing — sheltering income. Rental losses are passive: they offset passive income freely, and up to $25,000/yr can offset ordinary (W-2) income if you actively participate and your MAGI is under $100k (phasing out to $0 by $150k); unused losses carry forward. On sale, claimed depreciation is recaptured at up to 25%, and gains may owe capital-gains tax (a 1031 exchange can defer both). Figures are a year-1 estimate at your 24.0% rate — not tax advice; consult a CPA.
Schools (NCES district)
- District
- Paxton-Buckley-Loda CUD 10
- NCES district ID
- 1707650
- Math proficiency
- 33% ▼ -5.00%
- Reading proficiency
- 29% ▼ -10.00%
- Median HH income
- $52,233
- Composite
- 27.27/100
- National rank
- #7007
- State rank
- #232 of 620 in IL
Livability — Loda
- Score
- 58/100
- State rank
- #1122
- US rank
- #21191
Category grades
Schools grade is shown separately in the Schools card above.
Census & demographics
- City population
- 1,838
- Population (ZIP)
- 1,838
Population outlook (Iroquois County) Hauer SSP2
- Today (2025)
- 26,826 people
- By 2030
- 25,771 · -3.9%
- By 2040
- 23,589 · -12.1%
- By 2050
- 21,523 · -19.8%
- By 2075
- 17,998 · -32.9%
- By 2100
- 14,979 · -44.2%
Race, ethnicity, and origin ACS 2023
- Neighborhood character
- Predominantly White (97%)
- Race & ethnicity
- White 97% Two or more races 2%
- Common ancestry
- Iranian 4% Lithuanian 3% Serbian 2%
- Foreign-born
- 0%
Political lean MEDSL · Iroquois
- 2024 margin
- Solid R (+57.3) · D 20.6% · R 78.0% · Other 1.4%
- 2008→2024 swing
- -27.5pp toward R · 2008: -29.8pp · 2024: -57.3pp
- All cycles
- 2024: R+57.3 2020: R+56.7 2016: R+56.0 2012: R+44.7 2008: R+29.8
Not yet ingested
- Civics
- —
Market trends
- HPI YoY
- ▼ -12.88%
- Current HPI
- 209.5548
- Rent YoY
- —
- Metro
- —
- State GDP YoY
- ▲ 1.59%
- F500 in state
- 60
Industry mix (Fortune 500 HQ in IL)
| Industry | F500 HQs | Revenue |
|---|---|---|
| Insurance | 4 | $201B |
|
||
| Consumer Goods | 4 | $87B |
|
||
| Industrial Machinery | 3 | $64B |
|
||
| Healthcare | 2 | $55B |
|
||
| Retail / Pharmacy | 1 | $148B |
|
||
| Agriculture / Food | 1 | $86B |
|
||
Price history
-13.3% since first listed15 events — show timeline
- 2026-04-24 Listed $65,000 MRED as Distributed by MLS Grid
- 2026-04-24 Listing Removed — MRED as Distributed by MLS Grid
- 2026-01-02 Price Changed — MRED as Distributed by MLS Grid
- 2025-11-18 Price Changed — MRED as Distributed by MLS Grid
- 2024-04-26 Sold (Public Records) $48,000 Public Records
- 2011-04-08 Sold (Public Records) $36,000 Public Records
- 2011-04-08 Sold (Public Records) $36,000 Public Records
- 2011-03-17 Listing Removed — MRED as Distributed by MLS Grid
- 2010-09-21 Listed — MRED as Distributed by MLS Grid
- 2009-04-17 Listing Removed — MRED as Distributed by MLS Grid
- 2008-05-17 Listed — MRED as Distributed by MLS Grid
- 2007-04-01 Sold (Public Records) $75,000 Public Records
- 2004-10-01 Sold (MLS) $60,000 MRED as Distributed by MLS Grid
- 2004-10-01 Sold (Public Records) $60,000 Public Records
- 2004-04-28 Listed $75,000 MRED as Distributed by MLS Grid
Property tax history
+9.4%/yrLatest (2024): $1,049 · +13.0% YoY. Source: county tax records.
Cash-flow waterfall
monthlySold comps — $/sqft
last 12 mo · ≤1 miLoading sold comps…