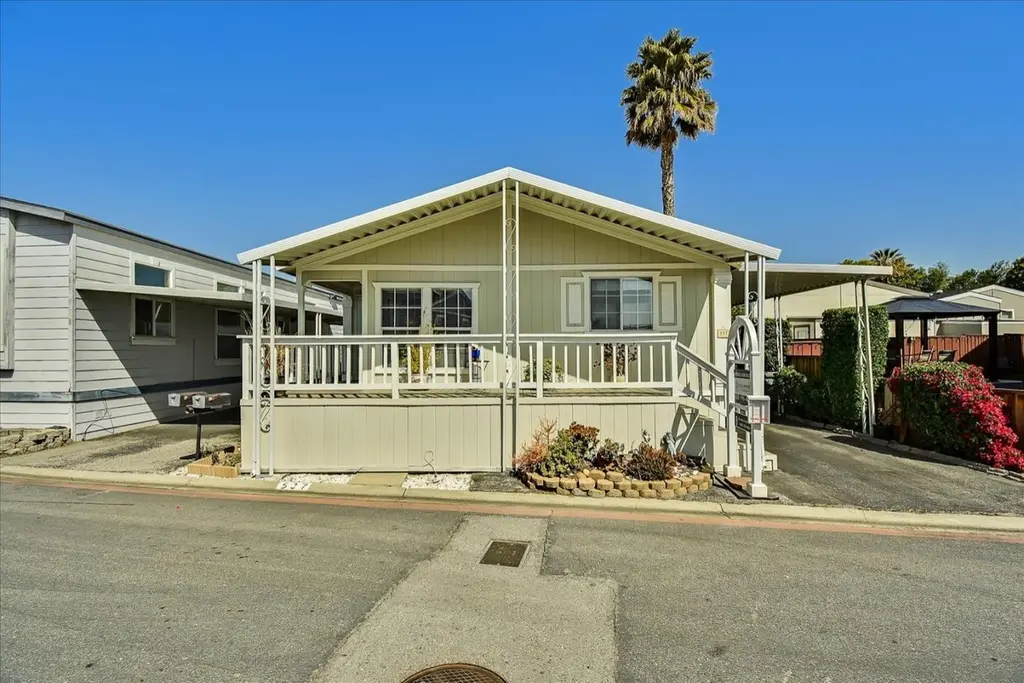
1085 TASMAN DR, SPC 537 · Sunnyvale, CA
Flood risk 1/10 · Minimal
- FEMA flood zone
- AE
- Chance of flooding over 30 yrs
- 0.0%
- Est. flood insurance / yr
- $1,737 – $8,500
Fire risk 1/10 · Minimal
- Est. fire insurance / yr
- $659 – $1,223
Heat risk 5/10 · Moderate
- Hot days now (above 91°F)
- 8 days/yr
- Hot days in 30 yrs
- 16 days/yr
Wind risk 1/10 · Minimal
- Chance of severe wind over 30 yrs
- —
Air-quality risk 7/10 · Major
- Unhealthy air days now
- 13 days/yr
- Unhealthy air days in 30 yrs
- 13 days/yr
Risk factors via First Street. Map © Google.
Why this score? — see what drove the B+ grade
The composite is a weighted blend of 9 inputs, each scored 0–100. Each bar is that input's sub-score; the figure is the points it added to the 100-point composite (weight × sub-score).
- Cash flow +30.0/30.0
- 1% rule +10.0/10.0
- DSCR +10.0/10.0
- ARV discount +9.8/15.0
- Schools +5.3/10.0
- Livability +4.1/5.0
- Appreciation +3.2/10.0
- Rent growth +3.2/5.0
- Condition / age +2.5/5.0
$299,998
🖨 Deal sheet (PDF) 📄 Offer letter ✓ Due diligence
Listing remarks MLS
Charming Bungalow offers 2 bedrooms and 2 full bathrooms plus a Den! Enjoy a bright light filled kitchen. Recently painted two tone cabinets, tile counter tops, and full tile backsplash are just a few of the upgrade amenities this home offers. Formal dining room, perfect for entertaining and family dinners. Spacious primary bedroom suite offers a walk in closet and spa like bathroom including a jetted tub. Convenient indoor laundry room with extra storage cabinets and laundry tub, perfect for washing the dog! Outdoor amenities include 3 car parking carport, new shed, wrap around porch, and patio area. This home has a one year old roof, and has been recently painted. Located close to major freeways, shopping, and light rail.
Key facts
- Bungalow style
- Private patio area
- Wraparound porch
Tags
Property features AI
Finance
- Other: Urban community setting
- Financial info: Assessments: Unknown — buyer to verify
- HOA & community: Land lease community (Casa de Amigos Mobile Park); Monthly land lease: $1,455.78; Manager approval required
Exterior
- Parking: Located in Casa de Amigos Mobile Park
- Utilities: Public sewer; District/public water
- Home design: Mobile home (model 5562F); Single-story; Entry level: 1
- Construction: Mobile width 26 ft, length 56 ft; Year built per builder
- Exterior features: Back yard; Community pool
Interior
- Bathrooms: 2 full bathrooms
- Interior features: One-level home with front entry; Entry located at the front
- Laundry & utility: Washer/dryer hookup inside
Neighborhood map
What this means for you Summary
Snapshot
- This is a 2-bed/2.0-bath manufactured listed at $300k.
Deal economics
- At list price, monthly cash flow is $1k ($13k/yr) — positive.
- The deal already cash-flows at list — no discount required.
- Meets the 1% rule at list price ($5k rent vs $300k).
- Cap rate 12.3% vs local median 1.2% in Sunnyvale — top-decile yield for the area; either an underpriced asset or a hidden risk that comps aren't pricing in. Stress-test before assuming the spread holds.
Location & tenants
- Location reads 82/100 on livability (#37 in CA, #1,258 nationally) — a professional / high-income tenant draw. Strengths: amenities A+, commute A+, employment A+; Watch: cost of living F.
- Santa Clara Unified (urban): math 49% / reading 66% proficiency, ranked #75 of 517 in CA (top 14%) — acceptable for families but not a draw, mixed tenant base, ~2y average lease.
- Market conditions: Rents rising (+2.6%/yr); 68 active listings in the ZIP; 14 comparable units currently listed for rent nearby; rentals leasing fast (median 0d on market — plan ~1-2 weeks tenant-placement turnaround); high-income renter base; 3,838 units permitted in Santa Clara County in 2024 (1,886 in 5+ unit buildings).
- This rent runs 34% of the median local income ($158k/yr) — at the standard rent-burdened threshold; future hikes will face affordability resistance.
Forward outlook
- Local home prices are declining (-3.0%/yr); year-one equity from $2k of loan paydown is wiped out by about $9k of value loss. Plan a longer hold.
- Santa Clara County population projected at +24% by 2050 — long-run rental-demand tailwind backs the buy-and-hold thesis.
- At projected returns (-3.0% appreciation + 2.6% rent growth), your $84k cash investment doubles in ~8 years — after that, you're playing with house money.
Negotiation context
- Only 3 days on market — expect competitive offers; lowballing is unlikely to land.
- 3 sale attempts since 20y ago with the ask held roughly flat each time — persistent listings suggest the price (not the market) is what's stuck; bring a comps-based counter.
Risks & watch-outs
- Watch-outs: flood insurance adds $427/mo.
- Climate carrying-cost: in FEMA flood zone AE (mandatory federal flood insurance); extreme-heat days projected 8→16/yr by 2055 (HVAC capex compounding) — expect insurance premiums to compound above CPI over the hold.
Questions for the listing agent
- What's the actual annual flood-insurance premium (NFIP or private), and is the property in a SFHA with mandatory coverage?
- Is there a deadline driving the sale (1031 exchange, divorce, estate, relocation)? That informs how much negotiation room exists.
- Schools are B-rated — typically a magnet for longer-tenancy family renters. What's the average tenant stay here, and is there a school-zone premium baked into asking?
- What's the average days-on-market for RENTAL listings here right now (not sales)? A rising rental-DOM trend means longer vacancies and softer asking-rent achievability than the comps imply.
- What's the recent tenant-quality profile in this submarket — average credit score on applications, eviction rate, late-payment / NSF rate, and stable-employment percentage? A property-management company in the area should have these aggregated.
- How much new for-sale + rental construction is in the pipeline within 1–3 miles? Heavy new supply typically softens prices + rents 12–24 months out; constrained supply supports both.
Investment metrics
- 1% rule
- 1.51% ✓
- Cap rate
- 12.30%
- Cash-on-cash
- 21.44%
- DSCR
- 1.95
- GRM
- 5.5
CMA / ARV
- ARV (on-the-fly)
- $315,952
- Comps found
- 12
Show comp detail 12 sales within ~0.75 mi
| Address | Dist | Beds/Ba | Sqft | Sold | Price | $/sf | Match |
|---|---|---|---|---|---|---|---|
| 1085 Tasman Dr #708 | 0.00mi | 3/2.0 (+1) | 1,440 (-1%) | 1mo | $313,000 | $217 | 93 |
| 1085 Tasman Dr #413 | 0.11mi | 2/2.0 | 1,440 (-1%) | 3mo | $225,000 | $156 | 90 |
| 1225 Vienna Dr #370 | 0.30mi | 2/2.0 | 1,440 (-1%) | 2mo | $210,000 | $146 | 83 |
| 1225 Vienna Dr #925 | 0.28mi | 2/2.0 | 1,490 (+2%) | 1mo | $305,000 | $205 | 82 |
| 690 Persian Dr #61 | 0.46mi | 2/2.0 | 1,464 (+0%) | 2mo | $229,500 | $157 | 76 |
| 1225 Vienna Dr #150 | 0.28mi | 3/2.0 (+1) | 1,521 (+4%) | 3mo | $374,000 | $246 | 72 |
| 1225 Vienna Dr #938 | 0.20mi | 2/2.0 | 1,296 (-11%) | 1mo | $245,500 | $189 | 72 |
| 1225 Vienna Dr #114 | 0.20mi | 3/2.0 (+1) | 1,600 (+10%) | 2mo | $380,000 | $238 | 68 |
| 1225 Vienna Dr #44 | 0.28mi | 3/2.0 (+1) | 1,658 (+14%) | 1mo | $349,000 | $210 | 58 |
| 1220 Tasman Dr #142 | 0.42mi | 3/2.0 (+1) | 1,590 (+9%) | 3mo | $355,000 | $223 | 58 |
| 1220 Tasman Dr #124 | 0.52mi | 3/2.0 (+1) | 1,336 (-8%) | 2mo | $320,000 | $240 | 55 |
| 600 E Weddell Dr #192 | 0.73mi | 3/2.0 (+1) | 1,248 (-14%) | 2mo | $300,000 | $240 | 35 |
Match score weights: distance 35% · size 25% · config 20% · recency 20%. Top-matched comps best support the ARV.
Projected returns pro-forma
-3.0% appreciation · 2.63% rent growth · sell at horizon
- IRR
- 5.7%
- Equity multiple
- 1.22×
- Total profit
- $18,459
- Equity at exit
- $44,731
- IRR
- 14.8%
- Equity multiple
- 2.17×
- Total profit
- $98,682
- Equity at exit
- $25,938
Cash invested: $83,999 (down + closing). Projections, not guarantees.
Landlord ↔ Tenant lean methodology
- Overall (STATE)
- 18 Strongly Tenant-Friendly
- State California
- 18 Strongly Tenant-Friendly · D+13
- County
- — inherits STATE
- City
- — inherits STATE
ZIP-level market 94089
- Home prices YoY
- -1.1%
- Rents YoY
- 2.6%
- Active inventory
- 68
- Price-to-rent
- 5.5×
Monthly cashflow live
- Estimated rent
- $4,524 high interval (Pro) →
- Mortgage (P&I)
- −$1,573
- Tax est. 1.5%
- −$375 /mo · $4,500/yr
- Insurance
- −$125
- Flood insurance flood zone
- −$427 /mo · $5,118/yr
- HOA
- −$0
- Vacancy / Maint / Mgmt
- −$950
- Net cashflow
- $1,074
Break-even live
Sensitivity live
| Price | -10% $1,282 | -5% $1,178 | +0% $1,074 | +5% $971 | +10% $867 |
|---|---|---|---|---|---|
| Rent | -10% $717 | -5% $896 | +0% $1,074 | +5% $1,253 | +10% $1,432 |
| Rate | -1.0pp $1,225 | -0.5pp $1,151 | base $1,074 | +0.5pp $997 | +1.0pp $917 |
UW: 25.0% down · 7.5% · 30yr · 1.5% tax · 5.0% vac · 8.0% maint · 8.0% mgmt
Financing live
Cash to close
- Down payment
- $75,000
- Closing costs
- $9,000
- Reserves months
- —
- Total cash needed
- —
Loan-product check · same deal, 3 products live
Conventional
25% down · 7.5% · 30yr
- Down + closing
- —
- Monthly P&I
- —
- Monthly cashflow
- —
- DSCR
- —
- Eligible?
- —
Personal DTI + credit; lowest rate.
DSCR
20% down · 8.5% · 30yr
- Down + closing
- —
- Monthly P&I
- —
- Monthly cashflow
- —
- DSCR
- —
- Eligible?
- —
No personal income docs; deal must DSCR.
Hard money
10% down · 12.0% · 12mo
- Down + closing
- —
- Monthly P&I
- —
- Monthly cashflow
- —
- DSCR
- —
- Eligible?
- —
Short-term bridge; refi at stabilization.
Rent comps 14 comps
| Address | Beds | Baths | Sqft | Rent | $/sqft | DOM | Units | Dist |
|---|---|---|---|---|---|---|---|---|
| 1271 Lawrence Station Rd Sunnyvale, CA | 1.0–2.0 | 1.0–2.5 | 1417 | $5,307 | $3.74 | 0d | 6 | 0.25mi |
| 1220 N Fair Oaks Ave Sunnyvale, CA | 1.0–2.0 | 1.0–2.0 | 887 | $4,780 | $5.39 | 0d | 3 | 0.47mi |
| 621 Tasman Dr Sunnyvale, CA | 1.0–2.0 | 1.0–2.0 | 959 | $4,557 | $4.75 | 3d | 9 | 0.50mi |
| 550 E Weddell Dr Sunnyvale, CA | 1.0–3.0 | 1.0–2.0 | 1255 | $4,849 | $3.86 | 0d | 10 | 0.84mi |
| 1160 Morse Ave Sunnyvale, CA | 1.0–2.0 | 1.0–2.0 | 1025 | $4,853 | $4.73 | 0d | 5 | 0.87mi |
| 1063 Morse Ave Sunnyvale, CA | 1.0–2.0 | 1.0–2.0 | 844 | $5,147 | $6.10 | 0d | 14 | 0.98mi |
| 725 San Simeon St #1617 Sunnyvale, CA | 3.0 | 2.0 | 1008 | $5,400 | $5.36 | 0d | 1 | 1.01mi |
| 1235 Wildwood Ave Sunnyvale, CA | 1.0–3.0 | 1.0–2.0 | 910 | $3,228 | $3.55 | 3d | 12 | 1.06mi |
| 785 N Fair Oaks Ave #8 Sunnyvale, CA | 2.0 | 1.0 | 926 | $3,300 | $3.56 | 12d | 1 | 1.17mi |
| 781 N Fair Oaks Ave #6 Sunnyvale, CA | 3.0 | 2.0 | 1134 | $3,795 | $3.35 | 17d | 1 | 1.19mi |
| 676 Johanna Ave Unit 2 Sunnyvale, CA | 2.0 | 1.0 | 892 | $2,650 | $2.97 | 3d | 1 | 1.19mi |
| 1250 Lakeside Dr Sunnyvale, CA | 2.0 | 1.0–2.0 | 934 | $5,447 | $5.83 | 0d | 8 | 1.20mi |
| 1257 Lakeside Dr Sunnyvale, CA | 3.0 | 1.0–3.0 | 903 | $4,598 | $5.09 | 0d | 1 | 1.21mi |
| 1030 Indian Wells Ave Sunnyvale, CA | 1.0–2.0 | 1.0–2.0 | 1001 | $6,915 | $6.90 | 0d | 33 | 1.34mi |
Listing history 8 events
-
2026-06-21days on market $299,998 Active 3 DOM
-
2026-06-18statusdays on market $299,998 Active 1 DOM
-
2026-06-17days on market $299,998 Coming Soon 6 DOM
-
2026-06-16days on market $299,998 Coming Soon 5 DOM
-
2026-06-15days on market $299,998 Coming Soon 4 DOM
-
2026-06-13days on market $299,998 Coming Soon 2 DOM
-
2026-06-13remarks 699-char remark
-
2026-06-13$299,998 Coming Soon 1 DOM
ⓘ Source: listings_history table (triggers on properties + properties_extension) + one-shot
backfill from property_details.listing_events for pre-trigger history.
Climate risk First Street
- Flood 1/10 Low FEMA zone AE · 0% chance over 30 yrs
- Wildfire 1/10 Low
- Heat 5/10 Major 8 d/yr ≥91°F today · 16 d/yr by 30 yrs out
- Wind 1/10 Low
- Air quality 7/10 Severe 13 unhealthy d/yr today · 13 by 30 yrs out
Nearby sold comps map
Loading sold comps map…
Walkable amenities ~0.75 mi
Loading nearby amenities…
Taxation est. · year 1
- Rental income
- $54,289
- − Mortgage interest
- −$16,805
- − Property taxes
- −$4,500
- − Insurance
- −$6,618
- − Repairs & maintenance
- −$4,343
- − Management
- −$4,343
- − Depreciation
- −$8,727
- Taxable income
- $8,952
- Est. tax owed @ 24.0%
- −$2,149
- After-tax cash flow
- $10,742/yr
For passive investors: Depreciation is non-cash, so a rental often shows a tax loss while cash-flowing — sheltering income. Rental losses are passive: they offset passive income freely, and up to $25,000/yr can offset ordinary (W-2) income if you actively participate and your MAGI is under $100k (phasing out to $0 by $150k); unused losses carry forward. On sale, claimed depreciation is recaptured at up to 25%, and gains may owe capital-gains tax (a 1031 exchange can defer both). Figures are a year-1 estimate at your 24.0% rate — not tax advice; consult a CPA.
Schools (NCES district)
- District
- Santa Clara Unified
- NCES district ID
- 0635430
- Math proficiency
- 49% ▼ -3.00%
- Reading proficiency
- 66% ▲ 4.00%
- Median HH income
- $97,320
- Composite
- 53.46/100
- National rank
- #1459
- State rank
- #75 of 517 in CA
Livability — Sunnyvale
- Score
- 82/100
- State rank
- #37
- US rank
- #1258
Category grades
Schools grade is shown separately in the Schools card above.
Census & demographics
- Census place
- Sunnyvale, CA
- County
- Santa Clara County · 1,806,974 people
- City population
- 154,236
- Metro
- San Jose-Sunnyvale-Santa Clara, CA
- Population (ZIP)
- 22,699
- Household income
- $158,304
- Rent vs Own
- Severe rent burden
- 558.0
Population outlook (Santa Clara County) Hauer SSP2
- Today (2025)
- 2,179,074 people
- By 2030
- 2,301,297 · +5.6%
- By 2040
- 2,528,195 · +16.0%
- By 2050
- 2,712,135 · +24.5%
- By 2075
- 2,998,701 · +37.6%
- By 2100
- 2,931,429 · +34.5%
Race, ethnicity, and origin ACS 2023
- Neighborhood character
- Diverse neighborhood (Simpson 0.68)
- Race & ethnicity
- Asian 45% White 24% Hispanic / Latino 24% Two or more races 9% Black 2%
- Hispanic origin (detail)
- Mexican 17%
- Common ancestry
- Scotch-Irish 2% Lithuanian 1% Estonian 1%
- Foreign-born
- 51% · Canada, China, Vietnam
- Languages at home
- 40% English-only · Spanish 18% Chinese 12% Other Asian/Pacific 8%
Political lean MEDSL · Santa Clara
- 2024 margin
- Solid D (+40.0) · D 68.1% · R 28.1% · Other 3.8%
- 2008→2024 swing
- -0.9pp no change · 2008: 40.9pp · 2024: 40.0pp
- All cycles
- 2024: D+40.0 2020: D+47.4 2016: D+52.5 2012: D+42.1 2008: D+40.9
Not yet ingested
- Civics
- —
Market trends
- HPI YoY
- ▼ -3.70%
- Current HPI
- 338.6935
- Rent YoY
- ▲ 2.63%
- Metro
- San Jose-Sunnyvale-Santa Clara, CA
- State GDP YoY
- ▲ 3.21%
- F500 in state
- 116
Industry mix (Fortune 500 HQ in CA)
| Industry | F500 HQs | Revenue |
|---|---|---|
| Technology | 27 | $1,492B |
|
||
| Financial Services | 3 | $174B |
|
||
| Retail | 3 | $44B |
|
||
| Insurance | 3 | $26B |
|
||
| Media / Entertainment | 2 | $115B |
|
||
| Pharmaceuticals / Biotech | 2 | $62B |
|
||
Price history
+167.9% since first listed11 events — show timeline
- 2026-06-12 Coming Soon $299,998 CRMLS
- 2022-06-01 Sold (MLS) $305,000 MLSListings
- 2022-05-25 Pending — MLSListings
- 2022-04-19 Contingent — MLSListings
- 2022-04-08 Listed $299,000 MLSListings
- 2008-07-18 Sold (MLS) $120,000 MLSListings
- 2008-06-14 Listing Removed — MLSListings
- 2008-05-22 Listed $124,000 MLSListings
- 2006-08-11 Listing Removed — MLSListings
- 2006-06-27 Sold (MLS) $104,000 MLSListings
- 2006-05-16 Listed $112,000 MLSListings
Property tax history
-3.6%/yrLatest (2011): $374 · -24.8% YoY. Source: county tax records.
Cash-flow waterfall
monthlySold comps — $/sqft
last 12 mo · ≤1 miLoading sold comps…