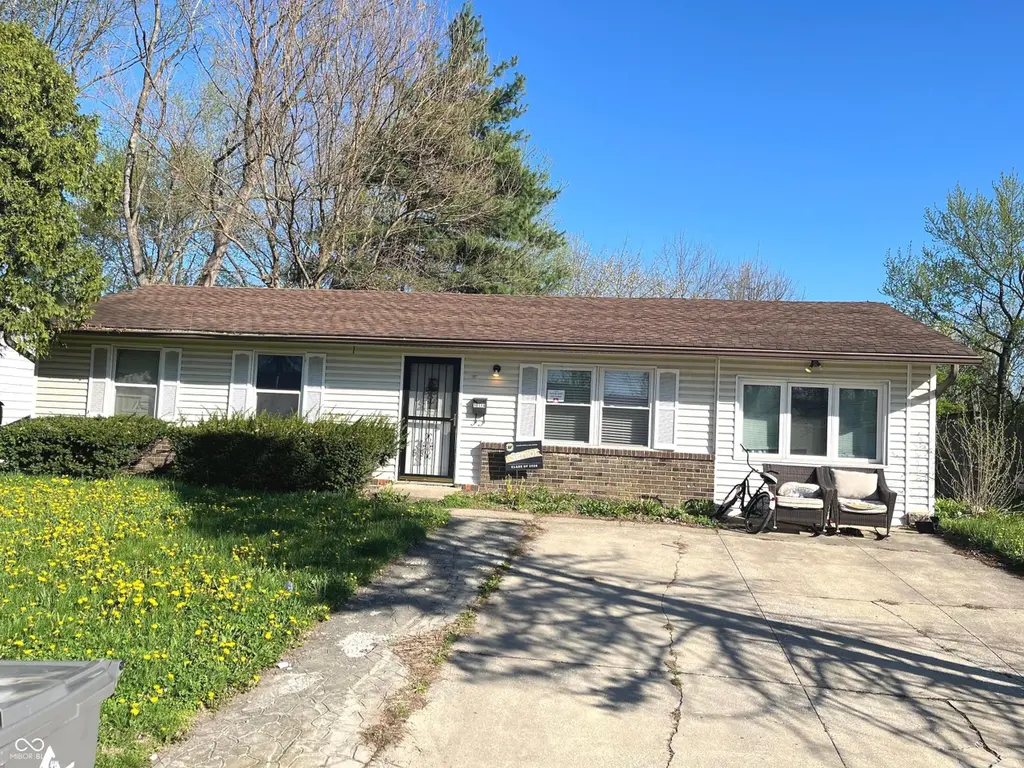
10114 E 33rd St · Indianapolis city (balance), IN
Flood risk 1/10 · Minimal
- FEMA flood zone
- X (unshaded)
- Chance of flooding over 30 yrs
- 0.0%
- Est. flood insurance / yr
- $507 – $1,088
Fire risk 1/10 · Minimal
- Est. fire insurance / yr
- $717 – $1,331
Heat risk 3/10 · Minor
- Hot days now (above 101°F)
- 7 days/yr
- Hot days in 30 yrs
- 18 days/yr
Wind risk 2/10 · Minimal
- Chance of severe wind over 30 yrs
- 1.0%
Air-quality risk 3/10 · Minor
- Unhealthy air days now
- 3 days/yr
- Unhealthy air days in 30 yrs
- 4 days/yr
Risk factors via First Street. Map © Google.
Why this score? — see what drove the C grade
The composite is a weighted blend of 9 inputs, each scored 0–100. Each bar is that input's sub-score; the figure is the points it added to the 100-point composite (weight × sub-score).
- Cash flow +23.4/30.0
- ARV discount +12.2/15.0
- DSCR +7.5/10.0
- 1% rule +6.5/10.0
- Rent growth +3.1/5.0
- Livability +2.5/5.0
- Condition / age +2.5/5.0
- Schools +1.4/10.0
- Appreciation +0.0/10.0
$139,000
🖨 Deal sheet 📄 Offer letter ✓ Due diligence
Listing remarks MLS
It's affordable! 3-Bedroom with a family room, & living room with a Large fenced yard. Currently a rental home, with a tenant @ $900. per month. Great Investment home to rent or make it your home. No Money down option.
Key facts
- 8,146 sq ft lot
- Built 1972
- Listed 105 days
Neighborhood map
What this means for you Summary
Snapshot
- This is a 3-bed/1.0-bath single-family listed at $139k.
Deal economics
- At list price, monthly cash flow is $256 ($3k/yr) — positive.
- The deal already cash-flows at list — no discount required.
- Meets the 1% rule at list price ($2k rent vs $139k).
- Recommended offer: $126k (9.0% below list) — sets the bar for market timing.
- Cap rate 8.5% vs local median 4.4% in Indianapolis city (balance) — top-decile yield for the area; either an underpriced asset or a hidden risk that comps aren't pricing in. Stress-test before assuming the spread holds.
Location & tenants
- Location reads: area grade C — affects rentability + tenant quality, not the cash-flow math above.
- Indianapolis Public Schools (urban): math 14% / reading 20% proficiency, ranked #286 of 301 in IN (top 95%) — low school quality limits family demand, transient renter base, plan for 1-2y turnover; 77% free/reduced lunch — lower-income household profile, screen leases tightly.
- Market conditions: Rents rising (+2.6%/yr); 54 active listings in the ZIP; 21 comparable units currently listed for rent nearby; rentals at typical pace (median 18d on market — plan ~3-4 weeks tenant-placement turnaround); 1,906 units permitted in Marion County in 2024 (621 in 5+ unit buildings).
- This rent runs 32% of the median local income ($59k/yr) — at the standard rent-burdened threshold; future hikes will face affordability resistance.
Forward outlook
- Local home prices are declining (-3.0%/yr); year-one equity from $961 of loan paydown is wiped out by about $4k of value loss. Plan a longer hold.
- Marion County population projected at +18% by 2050 — long-run rental-demand tailwind backs the buy-and-hold thesis.
Negotiation context
- It's been on market 105 days — a 9% lower offer ($126k) is reasonable based on typical stale-listing flexibility.
- 3 sale attempts since 10y ago; this cycle's ask has dropped $36k (21%) from the opening price — seller is motivated, your offer sets the floor, not the list.
- Current owner paid $64k; list at $139k implies a 116% gain — meaningful room to come down on a strong offer.
Questions for the listing agent
- It's been on market 105 days. Have you received any prior offers? Is the seller open to a 9% concession, seller financing, or rate buy-down credit?
- Built in 1972 — when were the roof, HVAC, electrical panel, plumbing, and water heater last replaced?
- Why hasn't it sold? Are there any deal-killer items the seller is aware of (foundation, flood, title, zoning, code violations)?
- Is there a deadline driving the sale (1031 exchange, divorce, estate, relocation)? That informs how much negotiation room exists.
- What's the average days-on-market for RENTAL listings here right now (not sales)? A rising rental-DOM trend means longer vacancies and softer asking-rent achievability than the comps imply.
- What's the recent tenant-quality profile in this submarket — average credit score on applications, eviction rate, late-payment / NSF rate, and stable-employment percentage? A property-management company in the area should have these aggregated.
- How much new for-sale + rental construction is in the pipeline within 1–3 miles? Heavy new supply typically softens prices + rents 12–24 months out; constrained supply supports both.
Investment metrics
- 1% rule
- 1.15% ✓
- Cap rate
- 8.50%
- Cash-on-cash
- 7.89%
- DSCR
- 1.35
- GRM
- 7.3
CMA / ARV
- ARV (median comp)
- $155,054
- List price
- $139,000
- Delta
- -10.35%
- Verdict
- UNDERPRICED
- Comps
- 20 within 1.0 mi
Show comp detail 12 sales within ~0.75 mi
| Address | Dist | Beds/Ba | Sqft | Sold | Price | $/sf | Match |
|---|---|---|---|---|---|---|---|
| 10013 Ridgefield Dr | 0.07mi | 3/1.0 | 1,225 (0%) | 4mo | $145,000 | $118 | 94 |
| 3601 Luewan Dr | 0.56mi | 3/2.0 | 1,284 (+5%) | 7mo | $110,000 | $86 | 56 |
| 3817 Strathmore Dr | 0.73mi | 3/1.0 | 1,236 (+1%) | 11mo | $150,000 | $121 | 55 |
| 3814 Strathmore Dr | 0.72mi | 4/1.0 (+1) | 1,225 (0%) | 9mo | $185,000 | $151 | 54 |
| 10113 Catalina Dr | 0.74mi | 3/1.5 | 1,176 (-4%) | 6mo | $151,500 | $129 | 51 |
| 9961 Catalina Dr | 0.71mi | 3/1.0 | 1,236 (+1%) | 20mo | $135,000 | $109 | 49 |
| 3717 Lacebark Dr | 0.73mi | 3/1.5 | 1,320 (+8%) | 4mo | $205,000 | $155 | 48 |
| 10119 Catalina Dr | 0.75mi | 3/1.0 | 1,176 (-4%) | 15mo | $140,000 | $119 | 46 |
| 3514 Jerome Ct | 0.70mi | 3/1.0 | 1,107 (-10%) | 10mo | $79,000 | $71 | 43 |
| 3734 Lacebark Dr | 0.73mi | 3/1.5 | 1,320 (+8%) | 11mo | $219,900 | $167 | 42 |
| 3525 Luewan Ct | 0.74mi | 4/1.0 (+1) | 1,107 (-10%) | 5mo | $120,000 | $108 | 40 |
| 3682 Lace Bark Dr | 0.69mi | 3/2.0 | 1,368 (+12%) | 12mo | $140,000 | $102 | 35 |
Match score weights: distance 35% · size 25% · config 20% · recency 20%. Top-matched comps best support the ARV.
Projected returns pro-forma
-3.0% appreciation · 2.56% rent growth · sell at horizon
- IRR
- -4.8%
- Equity multiple
- 0.82×
- Total profit
- $-6,873
- Equity at exit
- $20,725
- IRR
- 4.4%
- Equity multiple
- 1.32×
- Total profit
- $12,355
- Equity at exit
- $12,018
Cash invested: $38,920 (down + closing). Projections, not guarantees.
Landlord ↔ Tenant lean methodology
- Overall (STATE)
- 90 Strongly Landlord-Friendly
- State Indiana
- 90 Strongly Landlord-Friendly · R+11
- County
- — inherits STATE
- City
- — inherits STATE
ZIP-level market 46235
- Home prices YoY
- -4.3%
- Rents YoY
- 2.6%
- Active inventory
- 54
- Price-to-rent
- 7.3×
Monthly cashflow live
- Estimated rent
- $1,595 high interval (Pro) →
- Mortgage (P&I)
- −$729
- Tax from tax record
- −$217 /mo · $2,604/yr
- Insurance
- −$58
- HOA
- −$0
- Vacancy / Maint / Mgmt
- −$335
- Net cashflow
- $256
Break-even live
UW: 25.0% down · 7.5% · 30yr · 1.5% tax · 5.0% vac · 8.0% maint · 8.0% mgmt
Financing live
Cash to close
- Down payment
- $34,750
- Closing costs
- $4,170
- Reserves months
- —
- Total cash needed
- —
Loan-product check · same deal, 3 products live
Conventional
25% down · 7.5% · 30yr
- Down + closing
- —
- Monthly P&I
- —
- Monthly cashflow
- —
- DSCR
- —
- Eligible?
- —
Personal DTI + credit; lowest rate.
DSCR
20% down · 8.5% · 30yr
- Down + closing
- —
- Monthly P&I
- —
- Monthly cashflow
- —
- DSCR
- —
- Eligible?
- —
No personal income docs; deal must DSCR.
Hard money
10% down · 12.0% · 12mo
- Down + closing
- —
- Monthly P&I
- —
- Monthly cashflow
- —
- DSCR
- —
- Eligible?
- —
Short-term bridge; refi at stabilization.
Rent comps 21 comps
| Address | Beds | Baths | Sqft | Rent | $/sqft | DOM | Units | Dist |
|---|---|---|---|---|---|---|---|---|
| 3645 Wingate Ct Indianapolis, IN | 3.0 | 1.0–2.0 | 774 | $1,500 | $1.94 | 23d | 6 | 0.61mi |
| 3519 Jerome Ct Indianapolis, IN | 4.0 | 1.0 | 1107 | $1,995 | $1.80 | 23d | 1 | 0.66mi |
| 3525 Luewan Ct Indianapolis, IN | 4.0 | 1.0 | 1107 | $1,750 | $1.58 | 23d | 1 | 0.71mi |
| 9962 Catalina Dr Indianapolis, IN | 3.0 | 1.0 | 1236 | $1,600 | $1.29 | 3d | 1 | 0.72mi |
| 3665 Coneflower Way Indianapolis, IN | 3.0 | 2.0 | 1030 | $1,375 | $1.33 | 43d | 1 | 0.85mi |
| 9226 E 36th Pl Indianapolis, IN | 3.0 | 1.0 | 1073 | $1,250 | $1.16 | 7d | 1 | 0.88mi |
| 3747 Ireland Dr Indianapolis, IN | 4.0 | 1.5 | 1400 | $1,700 | $1.21 | 23d | 1 | 0.89mi |
| 10101 Montery Rd Indianapolis, IN | 2.0 | 1.0 | 627 | $1,439 | $2.30 | 1d | 10 | 0.91mi |
| 3962 Strathmore Dr Indianapolis, IN | 3.0 | 1.0 | 925 | $1,250 | $1.35 | 23d | 1 | 0.94mi |
| 9949 Ellis Dr Indianapolis, IN | 4.0 | 2.0 | 1421 | $1,580 | $1.11 | 2d | 1 | 0.99mi |
| 9438 Conried Dr Indianapolis, IN | 3.0 | 1.0 | 1094 | $1,445 | $1.32 | 4d | 1 | 1.14mi |
| 9060 E 39th Pl Indianapolis, IN | 1.0–2.0 | 1.0–1.5 | 820 | $1,040 | $1.27 | 23d | 1 | 1.27mi |
| 3631 Decamp Dr Indianapolis, IN | 3.0 | 1.0 | 1000 | $1,335 | $1.33 | 23d | 1 | 1.29mi |
| 3540 Dubarry Ct Indianapolis, IN | 3.0 | 2.0 | 1297 | $1,400 | $1.08 | 23d | 1 | 1.30mi |
| 8862 Bel Air Ct Indianapolis, IN | 3.0 | 1.0 | 1073 | $1,264 | $1.18 | 17d | 1 | 1.43mi |
| 3809 Biscayne Rd Indianapolis, IN | 2.0 | 1.5 | 992 | $1,020 | $1.03 | 14d | 1 | 1.43mi |
| 3815 Biscayne Rd Indianapolis, IN | 3.0 | 1.5 | 1188 | $1,220 | $1.03 | 14d | 1 | 1.43mi |
| 3821 Biscayne Rd Indianapolis, IN | 4.0 | 1.5 | 1188 | $1,325 | $1.12 | 14d | 1 | 1.44mi |
| 3823 Biscayne Rd Indianapolis, IN | 4.0 | 1.5 | 1188 | $1,320 | $1.11 | 14d | 1 | 1.44mi |
| 3829 Biscayne Rd Indianapolis, IN | 4.0 | 1.5 | 1188 | $1,320 | $1.11 | 14d | 1 | 1.45mi |
| 8914 Elmonte Dr Indianapolis, IN | 3.0 | 1.5 | 1500 | $1,600 | $1.07 | 23d | 1 | 1.46mi |
Listing history 10 events
-
2026-05-07price $139,000 231-char remark
Show marketing remark (231 chars)
It's affordable! 3-Bedroom with a family room, & living room with a Large fenced yard. Currently a rental home, with a tenant @ $900. per month. Great Investment home to rent or make it your home. No Money down option.
-
2026-03-18price $145,000 231-char remark
Show marketing remark (231 chars)
It's affordable! 3-Bedroom with a family room, & living room with a Large fenced yard. Currently a rental home, with a tenant @ $900. per month. Great Investment home to rent or make it your home. No Money down option.
-
2026-02-13price $160,000 231-char remark
Show marketing remark (231 chars)
It's affordable! 3-Bedroom with a family room, & living room with a Large fenced yard. Currently a rental home, with a tenant @ $900. per month. Great Investment home to rent or make it your home. No Money down option.
-
2026-02-09$175,000 Active 231-char remark
Show marketing remark (231 chars)
It's affordable! 3-Bedroom with a family room, & living room with a Large fenced yard. Currently a rental home, with a tenant @ $900. per month. Great Investment home to rent or make it your home. No Money down option.
-
2017-04-06soldstatus $64,500 Sold 306-char remark
Show marketing remark (306 chars)
Property is tenant occupied. Current rent is $825.00 per month. Lease ends 12/31/2017. Proof of funds or Preapproval is required to be provided prior to scheduling any showing. 24 hour notice to show required. All the work has been done for you- from rehab to placing your tenant. Outstanding opportunity!
-
2017-03-06historical Active with Contingency 306-char remark
Show marketing remark (306 chars)
Property is tenant occupied. Current rent is $825.00 per month. Lease ends 12/31/2017. Proof of funds or Preapproval is required to be provided prior to scheduling any showing. 24 hour notice to show required. All the work has been done for you- from rehab to placing your tenant. Outstanding opportunity!
-
2017-03-03$67,500 Active 306-char remark
Show marketing remark (306 chars)
Property is tenant occupied. Current rent is $825.00 per month. Lease ends 12/31/2017. Proof of funds or Preapproval is required to be provided prior to scheduling any showing. 24 hour notice to show required. All the work has been done for you- from rehab to placing your tenant. Outstanding opportunity!
-
2016-09-14soldstatus $35,000 Sold
-
2016-08-08historical Active with Contingency
-
2016-06-23$35,000 Active
ⓘ Source: listings_history table (triggers on properties + properties_extension) + one-shot
backfill from property_details.listing_events for pre-trigger history.
Tax reassessment forecast IN · Partial reset (capped growth)
- Current annual tax
- $2,604 · $217/mo
- Projected year-2 tax
- $2,604 · $217/mo
- Expected delta
- $0/yr ($0/mo · 0.0%)
ⓘ Screening estimate from a state-policy table — verify with the county assessor before closing.
Climate risk First Street
- Flood 1/10 Low FEMA zone X (unshaded) · 0% chance over 30 yrs
- Wildfire 1/10 Low
- Heat 3/10 Moderate 7 d/yr ≥101°F today · 18 d/yr by 30 yrs out
- Wind 2/10 Low 100% chance of damaging wind over 30 yrs
- Air quality 3/10 Moderate 3 unhealthy d/yr today · 4 by 30 yrs out
Nearby sold comps map
Loading sold comps map…
Walkable amenities ~0.75 mi
Loading nearby amenities…
Taxation est. · year 1
- Rental income
- $19,137
- − Mortgage interest
- −$7,786
- − Property taxes
- −$2,604
- − Insurance
- −$695
- − Repairs & maintenance
- −$1,531
- − Management
- −$1,531
- − Depreciation
- −$4,044
- Taxable income
- $946
- Est. tax owed @ 24.0%
- −$227
- After-tax cash flow
- $2,845/yr
For passive investors: Depreciation is non-cash, so a rental often shows a tax loss while cash-flowing — sheltering income. Rental losses are passive: they offset passive income freely, and up to $25,000/yr can offset ordinary (W-2) income if you actively participate and your MAGI is under $100k (phasing out to $0 by $150k); unused losses carry forward. On sale, claimed depreciation is recaptured at up to 25%, and gains may owe capital-gains tax (a 1031 exchange can defer both). Figures are a year-1 estimate at your 24.0% rate — not tax advice; consult a CPA.
Schools (NCES district)
- District
- Indianapolis Public Schools
- NCES district ID
- 1804770
- Math proficiency
- 14% ▼ -7.00%
- Reading proficiency
- 20% ▼ -3.00%
- Median HH income
- $32,034
- Composite
- 13.69/100
- National rank
- #9499
- State rank
- #286 of 301 in IN
Livability — Indianapolis city (balance)
No livability data for this city. (Only ~50 U.S. cities are tracked.)
Census & demographics
- Census place
- Indianapolis city (balance), IN
- County
- Marion County · 998,460 people
- City population
- 881,119
- Metro
- Indianapolis-Carmel-Anderson, IN
- Population (ZIP)
- 36,317
- Household income
- $58,951
- Rent vs Own
- Severe rent burden
- 1901.0
Population outlook (Marion County) Hauer SSP2
- Today (2025)
- 1,025,572 people
- By 2030
- 1,065,727 · +3.9%
- By 2040
- 1,141,577 · +11.3%
- By 2050
- 1,208,920 · +17.9%
- By 2075
- 1,367,288 · +33.3%
- By 2100
- 1,438,201 · +40.2%
Race, ethnicity, and origin ACS 2023
- Neighborhood character
- Diverse neighborhood (Simpson 0.62)
- Race & ethnicity
- Black 57% White 18% Hispanic / Latino 17% Two or more races 11%
- Hispanic origin (detail)
- Mexican 11% Puerto Rican 2%
- Common ancestry
- Hispanic 3% Slovak 1% Romanian 1%
- Foreign-born
- 11% · Canada
- Languages at home
- 80% English-only · Spanish 15% French/Haitian/Cajun 4%
Political lean MEDSL · Marion
- 2024 margin
- Strong D (+27.7) · D 63.0% · R 35.3% · Other 1.7%
- 2008→2024 swing
- -0.7pp no change · 2008: 28.4pp · 2024: 27.7pp
- All cycles
- 2024: D+27.7 2020: D+29.1 2016: D+22.8 2012: D+22.2 2008: D+28.4
Not yet ingested
- Civics
- —
Market trends
- HPI YoY
- ▼ -12.41%
- Current HPI
- 275.1505
- Rent YoY
- ▲ 2.56%
- Metro
- Indianapolis-Carmel-Anderson, IN
- State GDP YoY
- ▲ 2.90%
- F500 in state
- 18
Industry mix (Fortune 500 HQ in IN)
| Industry | F500 HQs | Revenue |
|---|---|---|
| Industrial Machinery | 2 | $37B |
|
||
| Healthcare | 1 | $177B |
|
||
| Pharmaceuticals | 1 | $45B |
|
||
| Metals / Steel | 1 | $18B |
|
||
| Agriculture | 1 | $17B |
|
||
| Packaging | 1 | $12B |
|
||
Price history
+297.1% since first listed10 events — show timeline
- 2026-05-07 Price Changed $139,000 MIBOR as Distributed by MLS Grid
- 2026-03-18 Price Changed $145,000 MIBOR as Distributed by MLS Grid
- 2026-02-13 Price Changed $160,000 MIBOR as Distributed by MLS Grid
- 2026-02-09 Listed $175,000 MIBOR as Distributed by MLS Grid
- 2017-04-06 Sold (MLS) $64,500 MIBOR as Distributed by MLS Grid
- 2017-03-06 Contingent — MIBOR as Distributed by MLS Grid
- 2017-03-03 Listed $67,500 MIBOR as Distributed by MLS Grid
- 2016-09-14 Sold (MLS) $35,000 MIBOR as Distributed by MLS Grid
- 2016-08-08 Contingent — MIBOR as Distributed by MLS Grid
- 2016-06-23 Listed $35,000 MIBOR as Distributed by MLS Grid
Property tax history
+35.2%/yrLatest (2025): $2,604 · +24.9% YoY. Source: county tax records.
Cash-flow waterfall
monthlySold comps — $/sqft
last 12 mo · ≤1 miLoading sold comps…