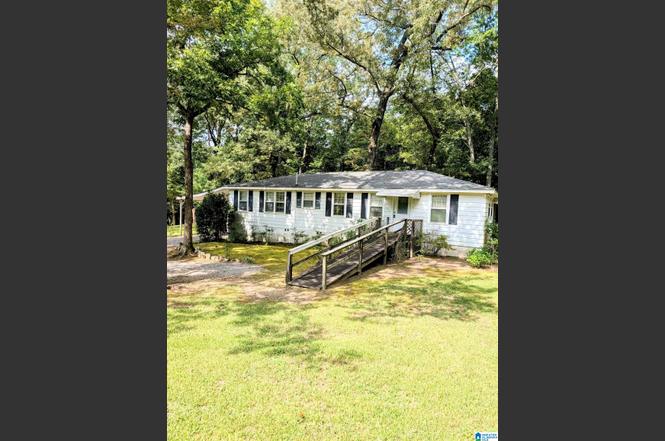
790 Leslie Ln · Gardendale, AL
Flood risk 1/10 · Minimal
- FEMA flood zone
- X (unshaded)
- Chance of flooding over 30 yrs
- 0.0%
- Est. flood insurance / yr
- $507 – $1,088
Fire risk 3/10 · Minor
- Est. fire insurance / yr
- $916 – $1,700
Heat risk 6/10 · Moderate
- Hot days now (above 106°F)
- 7 days/yr
- Hot days in 30 yrs
- 19 days/yr
Wind risk 6/10 · Moderate
- Chance of severe wind over 30 yrs
- 27.0%
Air-quality risk 5/10 · Moderate
- Unhealthy air days now
- 9 days/yr
- Unhealthy air days in 30 yrs
- 10 days/yr
Risk factors via First Street. Map © Google.
Why this score? — see what drove the B grade
The composite is a weighted blend of 9 inputs, each scored 0–100. Each bar is that input's sub-score; the figure is the points it added to the 100-point composite (weight × sub-score).
- Cash flow +28.7/30.0
- ARV discount +15.0/15.0
- DSCR +10.0/10.0
- 1% rule +6.7/10.0
- Livability +3.3/5.0
- Rent growth +2.5/5.0
- Condition / age +2.5/5.0
- Schools +1.8/10.0
- Appreciation +0.0/10.0
$159,000
🖨 Deal sheet 📄 Offer letter ✓ Due diligence
Listing remarks
Opportunity awaits in Gardendale! Just off Hwy 31, this 2-bedroom, 1-bath home sits on 4 acres of land—offering space, privacy, and endless potential. Whether you're looking to renovate for resale, build equity through sweat investment, or create a custom homestead, this property is a blank canvas ready for your vision. Please note - The home is being sold As-Is. No repairs or upgrades will be made by the seller.
Key facts
- Privacy
- Blank canvas
- 4 acres of land
Tags
Neighborhood map
What this means for you Summary
Snapshot
- This is a 3-bed/1.0-bath single-family listed at $159k.
Deal economics
- At list price, monthly cash flow is $528 ($6k/yr) — positive.
- The deal already cash-flows at list — no discount required.
- Meets the 1% rule at list price ($2k rent vs $159k).
- Recommended offer: $157k (1.5% below list) — sets the bar for market timing.
- Cap rate 10.3% vs local median 5.5% in Gardendale — top-decile yield for the area; either an underpriced asset or a hidden risk that comps aren't pricing in. Stress-test before assuming the spread holds.
Location & tenants
- Location reads 66/100 on livability (#113 in AL) — a middle-class / working-renter tenant base. Strengths: cost of living A+, housing A+, employment A-; Watch: amenities F, commute F, health & safety F.
- Jefferson County (suburban): math 9% / reading 32% proficiency, ranked #104 of 129 in AL (top 81%) — low school quality limits family demand, transient renter base, plan for 1-2y turnover.
- Zoned schools: Gardendale Elementary School (math 20% / reading 56%, grade F, #263 of 627 statewide, top 42%, 677 students, 48% FRL); Gardendale High School (math 21% / reading 28%, grade F, #118 of 305 statewide, top 45%, 1,047 students, 48% FRL) — zoned schools at 48% FRL track the district average.
- Market conditions: 97 active listings in the ZIP; 9 comparable units currently listed for rent nearby; rentals at typical pace (median 14d on market — plan ~3-4 weeks tenant-placement turnaround); solid renter incomes; 2,114 units permitted in Jefferson County in 2024 (556 in 5+ unit buildings).
Forward outlook
- Local home prices are declining (-3.0%/yr); year-one equity from $1k of loan paydown is wiped out by about $5k of value loss. Plan a longer hold.
- Jefferson County population projected to shrink 4% by 2050 — rents likely to lag national; underwrite the cash flow, not the appreciation.
- At projected returns (-3.0% appreciation + 3.0% rent growth), your $45k cash investment doubles in ~9 years — after that, you're playing with house money.
Negotiation context
- It's been on market 25 days — a 2% lower offer ($157k) is reasonable based on typical stale-listing flexibility.
Risks & watch-outs
- Watch-outs: built in 1954 — expect roof / HVAC / electrical / plumbing capex.
- Climate carrying-cost: major wind risk, 27% chance of damaging wind over 30y; extreme-heat days projected 7→19/yr by 2055 (HVAC capex compounding) — expect insurance premiums to compound above CPI over the hold.
Questions for the listing agent
- Built in 1954 — when were the roof, HVAC, electrical panel, plumbing, and water heater last replaced?
- Is there a deadline driving the sale (1031 exchange, divorce, estate, relocation)? That informs how much negotiation room exists.
- What's the average days-on-market for RENTAL listings here right now (not sales)? A rising rental-DOM trend means longer vacancies and softer asking-rent achievability than the comps imply.
- What's the recent tenant-quality profile in this submarket — average credit score on applications, eviction rate, late-payment / NSF rate, and stable-employment percentage? A property-management company in the area should have these aggregated.
- How much new for-sale + rental construction is in the pipeline within 1–3 miles? Heavy new supply typically softens prices + rents 12–24 months out; constrained supply supports both.
Investment metrics
- 1% rule
- 1.17% ✓
- Cap rate
- 10.28%
- Cash-on-cash
- 14.24%
- DSCR
- 1.63
- GRM
- 7.1
CMA / ARV
- ARV (on-the-fly)
- $231,984
- Comps found
- 12
Show comp detail 12 sales within ~0.75 mi
| Address | Dist | Beds/Ba | Sqft | Sold | Price | $/sf | Match |
|---|---|---|---|---|---|---|---|
| 257 Flint Ave | 0.10mi | 4/2.0 (+1) | 1,281 (-1%) | 5mo | $186,000 | $145 | 80 |
| 220 Honeysuckle Ln | 0.08mi | 3/2.0 | 1,235 (-5%) | 10mo | $185,000 | $150 | 76 |
| 313 Twin Lawn Dr | 0.65mi | 3/2.0 | 1,276 (-2%) | 6mo | $193,000 | $151 | 58 |
| 4051 Fulton Springs Ln | 0.65mi | 3/2.0 | 1,325 (+2%) | 6mo | $245,000 | $185 | 57 |
| 537 Tambay Dr | 0.66mi | 3/2.0 | 1,380 (+6%) | 1mo | $251,500 | $182 | 54 |
| 133 Lark St | 0.20mi | 3/1.5 | 1,109 (-14%) | 16mo | $139,900 | $126 | 52 |
| 1804 Frankfort Ln | 0.63mi | 3/2.0 | 1,200 (-7%) | 6mo | $215,000 | $179 | 49 |
| 4078 Fulton Springs Ln | 0.63mi | 2/2.0 (-1) | 1,210 (-7%) | 5mo | $235,000 | $194 | 46 |
| 233 Powell Dr | 0.67mi | 3/1.0 | 1,144 (-12%) | 6mo | $99,000 | $87 | 45 |
| 4086 Fulton Springs Ln | 0.62mi | 2/2.0 (-1) | 1,210 (-7%) | 10mo | $244,900 | $202 | 42 |
| 4029 Fulton Springs Ln | 0.68mi | 3/2.0 | 1,430 (+10%) | 8mo | $260,000 | $182 | 40 |
| 1810 Frankfort Ln | 0.65mi | 3/1.5 | 1,134 (-12%) | 12mo | $190,000 | $168 | 37 |
Match score weights: distance 35% · size 25% · config 20% · recency 20%. Top-matched comps best support the ARV.
Projected returns pro-forma
-3.0% appreciation · 3.0% rent growth · sell at horizon
- IRR
- 4.5%
- Equity multiple
- 1.18×
- Total profit
- $7,804
- Equity at exit
- $23,707
- IRR
- 14.0%
- Equity multiple
- 2.12×
- Total profit
- $49,828
- Equity at exit
- $13,747
Cash invested: $44,520 (down + closing). Projections, not guarantees.
Landlord ↔ Tenant lean methodology
- Overall (STATE)
- 90 Strongly Landlord-Friendly
- State Alabama
- 90 Strongly Landlord-Friendly · R+15
- County
- — inherits STATE
- City
- — inherits STATE
ZIP-level market 35071
- Home prices YoY
- -21.1%
- Active inventory
- 97
- Price-to-rent
- 7.1×
Monthly cashflow live
- Estimated rent
- $1,859 high interval (Pro) →
- Mortgage (P&I)
- −$834
- Tax from tax record
- −$40 /mo · $481/yr
- Insurance
- −$66
- HOA
- −$0
- Vacancy / Maint / Mgmt
- −$390
- Net cashflow
- $528
Break-even live
UW: 25.0% down · 7.5% · 30yr · 1.5% tax · 5.0% vac · 8.0% maint · 8.0% mgmt
Financing live
Cash to close
- Down payment
- $39,750
- Closing costs
- $4,770
- Reserves months
- —
- Total cash needed
- —
Loan-product check · same deal, 3 products live
Conventional
25% down · 7.5% · 30yr
- Down + closing
- —
- Monthly P&I
- —
- Monthly cashflow
- —
- DSCR
- —
- Eligible?
- —
Personal DTI + credit; lowest rate.
DSCR
20% down · 8.5% · 30yr
- Down + closing
- —
- Monthly P&I
- —
- Monthly cashflow
- —
- DSCR
- —
- Eligible?
- —
No personal income docs; deal must DSCR.
Hard money
10% down · 12.0% · 12mo
- Down + closing
- —
- Monthly P&I
- —
- Monthly cashflow
- —
- DSCR
- —
- Eligible?
- —
Short-term bridge; refi at stabilization.
Rent comps 9 comps
| Address | Beds | Baths | Sqft | Rent | $/sqft | DOM | Units | Dist |
|---|---|---|---|---|---|---|---|---|
| 359 Jamestown Manor Dr Gardendale, AL | 2.0 | 1.5 | 1098 | $1,199 | $1.09 | 14d | 1 | 0.49mi |
| 335 Jamestown Manor Dr Gardendale, AL | 3.0 | 2.5 | 1252 | $1,453 | $1.16 | 14d | 1 | 0.50mi |
| 387 Jamestown Manor Dr Gardendale, AL | 2.0 | 1.5 | 1104 | $1,323 | $1.20 | 11d | 1 | 0.52mi |
| 3186 Sayers Rd Fultondale, AL | 3.0 | 2.0 | 1700 | $2,000 | $1.18 | 19d | 1 | 0.66mi |
| 236 Garrison Rd Gardendale, AL | 3.0 | 2.0 | 1680 | $1,900 | $1.13 | 43d | 1 | 0.87mi |
| 1041 Georgetown Ln Birmingham, AL | 3.0 | 2.0 | 1262 | $1,691 | $1.34 | 1d | 1 | 0.91mi |
| 235 Odum Rd Gardendale, AL | 3.0 | 2.0 | 1526 | $2,185 | $1.43 | 23d | 1 | 0.91mi |
| 716 Brookview Dr Gardendale, AL | 3.0 | 2.0 | 1700 | $1,873 | $1.10 | 1d | 1 | 0.94mi |
| 757 Main St Unit 757-D Gardendale, AL | 2.0 | 1.0 | 900 | $1,130 | $1.26 | 23d | 1 | 1.06mi |
Listing history 2 events
-
2025-09-18status Pending
-
2025-08-24$159,000 Active
ⓘ Source: listings_history table (triggers on properties + properties_extension) + one-shot
backfill from property_details.listing_events for pre-trigger history.
Tax reassessment forecast AL · Resets to sale price
- Current annual tax
- $481 · $40/mo
- Projected year-2 tax
- $652 · $54/mo
- Expected delta
- +$171/yr (+$14/mo · 35.5%)
ⓘ Screening estimate from a state-policy table — verify with the county assessor before closing.
Climate risk First Street
- Flood 1/10 Low FEMA zone X (unshaded) · 0% chance over 30 yrs
- Wildfire 3/10 Moderate
- Heat 6/10 Major 7 d/yr ≥106°F today · 19 d/yr by 30 yrs out
- Wind 6/10 Major 27% chance of damaging wind over 30 yrs
- Air quality 5/10 Major 9 unhealthy d/yr today · 10 by 30 yrs out
Nearby sold comps map
Loading sold comps map…
Walkable amenities ~0.75 mi
Loading nearby amenities…
Taxation est. · year 1
- Rental income
- $22,303
- − Mortgage interest
- −$8,906
- − Property taxes
- −$481
- − Insurance
- −$795
- − Repairs & maintenance
- −$1,784
- − Management
- −$1,784
- − Depreciation
- −$4,625
- Taxable income
- $3,927
- Est. tax owed @ 24.0%
- −$942
- After-tax cash flow
- $5,395/yr
For passive investors: Depreciation is non-cash, so a rental often shows a tax loss while cash-flowing — sheltering income. Rental losses are passive: they offset passive income freely, and up to $25,000/yr can offset ordinary (W-2) income if you actively participate and your MAGI is under $100k (phasing out to $0 by $150k); unused losses carry forward. On sale, claimed depreciation is recaptured at up to 25%, and gains may owe capital-gains tax (a 1031 exchange can defer both). Figures are a year-1 estimate at your 24.0% rate — not tax advice; consult a CPA.
Schools (NCES district)
- District
- Jefferson County
- NCES district ID
- 0101920
- Math proficiency
- 9% ▼ -24.00%
- Reading proficiency
- 32% ▼ -5.00%
- Median HH income
- $51,712
- Composite
- 18.4/100
- National rank
- #8937
- State rank
- #104 of 129 in AL
Livability — Gardendale
- Score
- 66/100
- State rank
- #113
- US rank
- #12225
Category grades
Schools grade is shown separately in the Schools card above.
Census & demographics
- Census place
- Gardendale, AL
- County
- Jefferson County · 527,445 people
- City population
- 17,288
- Metro
- Birmingham-Hoover, AL
- Population (ZIP)
- 17,288
- Household income
- $82,074
- Rent vs Own
- Severe rent burden
- 151.0
Population outlook (Jefferson County) Hauer SSP2
- Today (2025)
- 669,185 people
- By 2030
- 669,694 · +0.1%
- By 2040
- 661,388 · -1.2%
- By 2050
- 643,086 · -3.9%
- By 2075
- 577,267 · -13.7%
- By 2100
- 474,758 · -29.1%
Race, ethnicity, and origin ACS 2023
- Neighborhood character
- Predominantly White (69%)
- Race & ethnicity
- White 69% Black 21% Two or more races 4% Hispanic / Latino 2% Asian 1%
- Common ancestry
- Slovak 3% Serbian 2% Italian 2%
- Foreign-born
- 1% · Canada
- Languages at home
- 98% English-only · Spanish 1%
Political lean MEDSL · Jefferson
- 2024 margin
- D (+10.4) · D 54.6% · R 44.2% · Other 1.2%
- 2008→2024 swing
- +5.4pp toward D · 2008: 5.1pp · 2024: 10.4pp
- All cycles
- 2024: D+10.4 2020: D+13.2 2016: D+7.2 2012: D+6.0 2008: D+5.1
Not yet ingested
- Civics
- —
Market trends
- HPI YoY
- ▼ -55.29%
- Current HPI
- 206.7447
- Rent YoY
- —
- Metro
- Birmingham-Hoover, AL
- State GDP YoY
- ▲ 2.94%
- F500 in state
- 4
Industry mix (Fortune 500 HQ in AL)
| Industry | F500 HQs | Revenue |
|---|---|---|
| Financial Services | 1 | $8B |
|
||
| Healthcare | 1 | $5B |
|
||
Price history
2 events — show timeline
- 2025-09-18 Pending — Greater Alabama MLS
- 2025-08-24 Listed $159,000 Greater Alabama MLS
Cash-flow waterfall
monthlySold comps — $/sqft
last 12 mo · ≤1 miLoading sold comps…