3308 Fern Dr · Tucker, GA
Flood risk 1/10 · Minimal
- FEMA flood zone
- X (unshaded)
- Chance of flooding over 30 yrs
- 0.0%
- Est. flood insurance / yr
- $507 – $1,088
Fire risk 1/10 · Minimal
- Est. fire insurance / yr
- $963 – $1,789
Heat risk 5/10 · Moderate
- Hot days now (above 103°F)
- 7 days/yr
- Hot days in 30 yrs
- 18 days/yr
Wind risk 4/10 · Minor
- Chance of severe wind over 30 yrs
- 17.0%
Air-quality risk 5/10 · Moderate
- Unhealthy air days now
- 6 days/yr
- Unhealthy air days in 30 yrs
- 8 days/yr
Risk factors via First Street. Map © Google.
Why this score? — see what drove the D grade
The composite is a weighted blend of 9 inputs, each scored 0–100. Each bar is that input's sub-score; the figure is the points it added to the 100-point composite (weight × sub-score).
- ARV discount +15.0/15.0
- Cash flow +10.5/30.0
- 1% rule +4.5/10.0
- DSCR +3.0/10.0
- Livability +2.5/5.0
- Condition / age +2.5/5.0
- Rent growth +2.3/5.0
- Schools +2.1/10.0
- Appreciation +0.0/10.0
$200,000
🖨 Deal sheet (PDF) 📄 Offer letter ✓ Due diligence
Listing remarks MLS
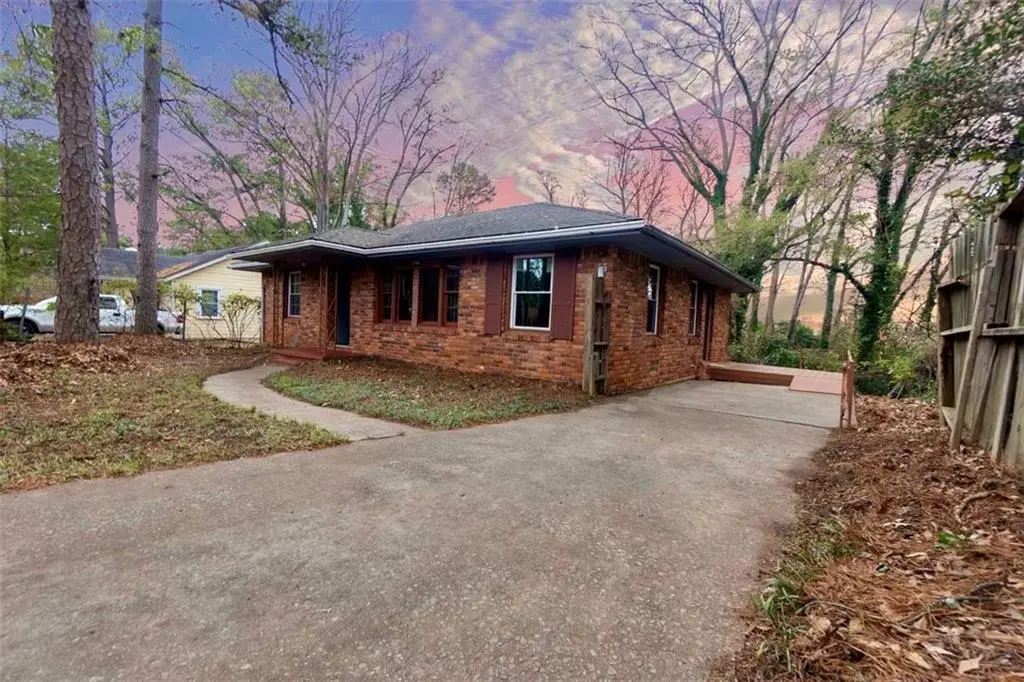
Solid brick ranch featuring 3 bedrooms and 1 bathroom, perfect for a first-time buyer wanting to build sweat equity or an investor looking for a reliable rental. This home has great bones and only needs minor TLC and cosmetic updates to reach its full potential. The roof was replaced in 2023. It's a fantastic opportunity to stop renting and customize your own space or add this property to your portfolio in a high-demand area. Property is being sold "as-is"
Key facts
- 0.45 acre lot
- Built 1961
- Listed 13 days
Neighborhood map
What this means for you Summary
Snapshot
- This is a 3-bed/1.0-bath single-family listed at $200k.
Deal economics
- At list price, monthly cash flow is $-101 ($-1k/yr) — negative.
- To cash-flow at today's rent, offer at most $182k (8.9% below list).
- To meet the 1% rule (rent ≥ 1% of price), the offer needs to be $191k (4.7% below list).
- Recommended offer: $182k (8.9% below list) — sets the bar for cash-flow.
- Cap rate 5.7% vs local median 3.4% in Tucker — top-decile yield for the area; either an underpriced asset or a hidden risk that comps aren't pricing in. Stress-test before assuming the spread holds.
Location & tenants
- Location reads: area grade D — affects rentability + tenant quality, not the cash-flow math above.
- Dekalb County (suburban): math 19% / reading 28% proficiency, ranked #125 of 174 in GA (top 72%) — low school quality limits family demand, transient renter base, plan for 1-2y turnover; 68% free/reduced lunch — lower-income household profile, screen leases tightly.
- Zoned schools: Briarlake Elementary School (math 42% / reading 47%, grade F, #336 of 1,228 statewide, top 29%, 378 students, 26% FRL); Henderson Middle School (math 23% / reading 32%, grade F, #268 of 470 statewide, top 57%, 1,411 students, 56% FRL); Lakeside High School (math 27% / reading 34%, grade F, #128 of 424 statewide, top 30%, 2,141 students, 43% FRL) — zoned schools average 42% FRL vs 68% district-wide (26 pts lower); this property's tenant base skews higher-income than the district average.
- Market conditions: Rents soft (-0.8%/yr); 221 active listings in the ZIP; 29 comparable units currently listed for rent nearby; rentals leasing fast (median 7d on market — plan ~1-2 weeks tenant-placement turnaround); solid renter incomes; 1,240 units permitted in DeKalb County in 2024 (385 in 5+ unit buildings).
Forward outlook
- Local home prices are declining (-3.0%/yr); year-one equity from $1k of loan paydown is wiped out by about $6k of value loss. Plan a longer hold.
- DeKalb County population projected at +28% by 2050 — long-run rental-demand tailwind backs the buy-and-hold thesis.
Negotiation context
- Only 13 days on market — expect competitive offers; lowballing is unlikely to land.
- 7 sale attempts since 19y ago with the ask held roughly flat each time — persistent listings suggest the price (not the market) is what's stuck; bring a comps-based counter.
- Current owner paid $107k; list at $200k implies a 87% gain — meaningful room to come down on a strong offer.
Risks & watch-outs
- Watch-outs: property tax is 2.9% of price.
- Climate carrying-cost: extreme-heat days projected 7→18/yr by 2055 (HVAC capex compounding) — expect insurance premiums to compound above CPI over the hold.
Questions for the listing agent
- What do current leases actually rent for vs. the listed asking? Can we see a recent rent roll and the last 12 months of T-12 income?
- Built in 1961 — when were the roof, HVAC, electrical panel, plumbing, and water heater last replaced?
- Property tax is high relative to price — has the assessment been appealed recently, and will the sale trigger a re-assessment?
- Is there a deadline driving the sale (1031 exchange, divorce, estate, relocation)? That informs how much negotiation room exists.
- The area grade is low — what's the realistic commute time and amenity access for the typical tenant pool here? Any planned neighborhood developments (good or bad) we should know about?
- What's the average days-on-market for RENTAL listings here right now (not sales)? A rising rental-DOM trend means longer vacancies and softer asking-rent achievability than the comps imply.
- What's the recent tenant-quality profile in this submarket — average credit score on applications, eviction rate, late-payment / NSF rate, and stable-employment percentage? A property-management company in the area should have these aggregated.
- How much new for-sale + rental construction is in the pipeline within 1–3 miles? Heavy new supply typically softens prices + rents 12–24 months out; constrained supply supports both.
Investment metrics
- 1% rule
- 0.95% ✗
- Cap rate
- 5.69%
- Cash-on-cash
- -2.16%
- DSCR
- 0.90
- GRM
- 8.7
CMA / ARV
- ARV (median comp)
- $388,229
- List price
- $200,000
- Delta
- -48.48%
- Verdict
- UNDERPRICED
- Comps
- 20 within 1.0 mi
Show comp detail 12 sales within ~0.75 mi
| Address | Dist | Beds/Ba | Sqft | Sold | Price | $/sf | Match |
|---|---|---|---|---|---|---|---|
| 3031 Wilson Rd | 0.61mi | 3/2.0 | 1,262 (-1%) | 1mo | $180,000 | $143 | 66 |
| 1564 Delia Dr | 0.49mi | 4/2.0 (+1) | 1,314 (+4%) | 1mo | $432,750 | $329 | 61 |
| 1444 Juneau Ct | 0.57mi | 3/1.5 | 1,293 (+2%) | 10mo | $348,000 | $269 | 60 |
| 3060 Wilson Rd | 0.60mi | 3/2.0 | 1,350 (+6%) | 1mo | $434,000 | $321 | 57 |
| 3166 Lindmoor Dr | 0.61mi | 3/1.0 | 1,344 (+6%) | 6mo | $260,000 | $193 | 56 |
| 1552 Delia Dr | 0.53mi | 3/1.5 | 1,196 (-6%) | 11mo | $391,000 | $327 | 55 |
| 3119 Medley Rdg | 0.74mi | 3/2.0 | 1,288 (+2%) | 9mo | $396,500 | $308 | 51 |
| 1340 Juneau Ct | 0.70mi | 3/2.0 | 1,228 (-3%) | 9mo | $365,000 | $297 | 51 |
| 1693 Montreal Rd | 0.36mi | 3/1.5 | 1,080 (-15%) | 8mo | $269,000 | $249 | 50 |
| 3232 Valaire Dr | 0.70mi | 2/2.0 (-1) | 1,280 (+1%) | 10mo | $420,000 | $328 | 48 |
| 3194 Rehoboth Dr | 0.52mi | 2/1.5 (-1) | 1,452 (+14%) | 9mo | $410,625 | $283 | 37 |
| 3237 Burgundy Rd | 0.67mi | 3/1.5 | 1,080 (-15%) | 9mo | $400,000 | $370 | 34 |
Match score weights: distance 35% · size 25% · config 20% · recency 20%. Top-matched comps best support the ARV.
Projected returns pro-forma
-3.0% appreciation · 0.0% rent growth · sell at horizon
- IRR
- -23.8%
- Equity multiple
- 0.21×
- Total profit
- $-44,259
- Equity at exit
- $29,821
- IRR
- -33.2%
- Equity multiple
- -0.21×
- Total profit
- $-67,737
- Equity at exit
- $17,292
Cash invested: $56,000 (down + closing). Projections, not guarantees.
Landlord ↔ Tenant lean methodology
- Overall (STATE)
- 90 Strongly Landlord-Friendly
- State Georgia
- 90 Strongly Landlord-Friendly · R+3
- County
- — inherits STATE
- City
- — inherits STATE
ZIP-level market 30084
- Rents YoY
- -0.8%
- Active inventory
- 221
- Price-to-rent
- 8.7×
Monthly cashflow live
- Estimated rent
- $1,907 high interval (Pro) →
- Mortgage (P&I)
- −$1,049
- Tax from tax record
- −$475 /mo · $5,703/yr
- Insurance
- −$83
- HOA
- −$0
- Vacancy / Maint / Mgmt
- −$400
- Net cashflow
- $-101
Break-even live
Sensitivity live
| Price | -10% $12 | -5% $-44 | +0% $-101 | +5% $-158 | +10% $-214 |
|---|---|---|---|---|---|
| Rent | -10% $-252 | -5% $-176 | +0% $-101 | +5% $-26 | +10% $50 |
| Rate | -1.0pp $0 | -0.5pp $-50 | base $-101 | +0.5pp $-153 | +1.0pp $-205 |
UW: 25.0% down · 7.5% · 30yr · 1.5% tax · 5.0% vac · 8.0% maint · 8.0% mgmt
Financing live
Cash to close
- Down payment
- $50,000
- Closing costs
- $6,000
- Reserves months
- —
- Total cash needed
- —
Loan-product check · same deal, 3 products live
Conventional
25% down · 7.5% · 30yr
- Down + closing
- —
- Monthly P&I
- —
- Monthly cashflow
- —
- DSCR
- —
- Eligible?
- —
Personal DTI + credit; lowest rate.
DSCR
20% down · 8.5% · 30yr
- Down + closing
- —
- Monthly P&I
- —
- Monthly cashflow
- —
- DSCR
- —
- Eligible?
- —
No personal income docs; deal must DSCR.
Hard money
10% down · 12.0% · 12mo
- Down + closing
- —
- Monthly P&I
- —
- Monthly cashflow
- —
- DSCR
- —
- Eligible?
- —
Short-term bridge; refi at stabilization.
Rent comps 29 comps
| Address | Beds | Baths | Sqft | Rent | $/sqft | DOM | Units | Dist |
|---|---|---|---|---|---|---|---|---|
| 1200 Montreal Rd Tucker, GA | 1.0–2.0 | 1.0–2.0 | 986 | $1,860 | $1.89 | 3d | 16 | 0.58mi |
| 2501 Lawrenceville Hwy Decatur, GA | 1.0–2.0 | 1.0–1.5 | 875 | $1,328 | $1.52 | 0d | 2 | 0.72mi |
| 1480 Edinburgh Dr Tucker, GA | 3.0 | 2.0 | 1488 | $2,640 | $1.77 | 26d | 1 | 0.81mi |
| 3085 Piper Dr Decatur, GA | 3.0 | 2.0 | 1845 | $2,421 | $1.31 | 45d | 1 | 0.84mi |
| 3642 Marlborough Dr Tucker, GA | 3.0 | 1.5 | 1833 | $2,300 | $1.25 | 14d | 1 | 0.88mi |
| 2902 Delcourt Dr Decatur, GA | 4.0 | 2.5 | 1296 | $2,800 | $2.16 | 7d | 1 | 0.98mi |
| 1086 Montreal Rd Clarkston, GA | 2.0 | 1.5–2.0 | 1252 | $1,318 | $1.05 | 12d | 10 | 0.98mi |
| 3071 Francine Dr Decatur, GA | 3.0 | 2.0 | 1190 | $2,300 | $1.93 | 26d | 1 | 1.04mi |
| 1211 Robinwood Rd Decatur, GA | 2.0 | 1.0 | 1053 | $1,850 | $1.76 | 45d | 1 | 1.05mi |
| 2394 Lawrenceville Hwy Unit K Decatur, GA | 3.0 | 2.0 | 1334 | $1,900 | $1.42 | 20d | 1 | 1.13mi |
| 3145 Misty Creek Dr Decatur, GA | 1.0–2.0 | 1.0–2.0 | 990 | $1,725 | $1.74 | 5d | 8 | 1.15mi |
| 2000 Northlake Pkwy Tucker, GA | 1.0–2.0 | 1.0–1.5 | 824 | $1,450 | $1.76 | 1d | 4 | 1.16mi |
| 2340 Lawrenceville Hwy Decatur, GA | 2.0 | 1.0 | 1000 | $1,400 | $1.40 | 45d | 1 | 1.17mi |
| 2037 Weems Rd Tucker, GA | 1.0–3.0 | 1.0–2.5 | 1195 | $2,685 | $2.25 | 1d | 26 | 1.17mi |
| 2006 Northlake Pkwy Unit 2006-04 Tucker, GA | 2.0 | 1.5 | 976 | $1,250 | $1.28 | 45d | 1 | 1.18mi |
| 1000 Montreal Rd Clarkston, GA | 1.0–3.0 | 1.0–2.5 | 1250 | $1,340 | $1.07 | 1d | 17 | 1.19mi |
| 1204 Brockett Rd Clarkston, GA | 2.0 | 1.0–2.0 | 1160 | $1,375 | $1.19 | 45d | 10 | 1.20mi |
| 3800 Brockett Trl Clarkston, GA | 1.0–3.0 | 1.0–2.0 | 1192 | $1,979 | $1.66 | 1d | 15 | 1.28mi |
| 3519 W Hill St Clarkston, GA | 2.0 | 1.0–1.5 | 857 | $1,299 | $1.51 | 7d | 1 | 1.31mi |
| 1350 Brockett Pl Clarkston, GA | 2.0 | 2.0 | 1244 | $1,350 | $1.09 | 5d | 1 | 1.32mi |
| 1350 Brockett Pl Clarkston, GA | 2.0 | 2.0 | 1244 | $1,350 | $1.09 | 1d | 1 | 1.32mi |
| 1039 Verdi Way Clarkston, GA | 3.0 | 1.5 | 1053 | $1,995 | $1.89 | 7d | 1 | 1.33mi |
| 1015 Casa Dr Clarkston, GA | 4.0 | 2.0 | 1844 | $1,950 | $1.06 | 26d | 1 | 1.35mi |
| 3073 Cedar Creek Pkwy Decatur, GA | 1.0–3.0 | 1.0–2.0 | 1050 | $1,641 | $1.56 | 1d | 45 | 1.35mi |
| 1500 Post Oak Dr Clarkston, GA | 1.0–4.0 | 1.0–2.5 | 1337 | $1,698 | $1.27 | 5d | 12 | 1.41mi |
| 1250 Brockett Rd Clarkston, GA | 1.0–2.0 | 1.0–2.5 | 1100 | $1,725 | $1.57 | 1d | 15 | 1.44mi |
| 2200 Ranchwood Dr NE Atlanta, GA | 3.0 | 2.0 | 1476 | $1,976 | $1.34 | 24d | 1 | 1.45mi |
| 1740 Samaria Trl Tucker, GA | 3.0 | 2.0 | 1774 | $2,200 | $1.24 | 45d | 1 | 1.45mi |
| 3324 Valley Brook Pl Decatur, GA | 2.0 | 1.0–2.0 | 1002 | $1,368 | $1.36 | 22d | 5 | 1.46mi |
Listing history 26 events
-
2026-05-15status Back On Market 470-char remark
Show marketing remark (476 chars)
Solid brick ranch featuring 3 bedrooms and 1 bathroom, perfect for a first-time buyer wanting to build sweat equity or an investor looking for a reliable rental. This home has great bones and only needs minor TLC and cosmetic updates to reach its full potential. The roof was replaced in 2023. It’s a fantastic opportunity to stop renting and customize your own space or add this property to your portfolio in a high-demand area. Property is being sold "as-is"
-
2026-05-15status Active 476-char remark
Show marketing remark (476 chars)
Solid brick ranch featuring 3 bedrooms and 1 bathroom, perfect for a first-time buyer wanting to build sweat equity or an investor looking for a reliable rental. This home has great bones and only needs minor TLC and cosmetic updates to reach its full potential. The roof was replaced in 2023. It’s a fantastic opportunity to stop renting and customize your own space or add this property to your portfolio in a high-demand area. Property is being sold "as-is"
-
2026-04-10status Pending 476-char remark
Show marketing remark (476 chars)
Solid brick ranch featuring 3 bedrooms and 1 bathroom, perfect for a first-time buyer wanting to build sweat equity or an investor looking for a reliable rental. This home has great bones and only needs minor TLC and cosmetic updates to reach its full potential. The roof was replaced in 2023. It’s a fantastic opportunity to stop renting and customize your own space or add this property to your portfolio in a high-demand area. Property is being sold "as-is"
-
2026-04-04historical Active Under Contract 470-char remark
Show marketing remark (476 chars)
Solid brick ranch featuring 3 bedrooms and 1 bathroom, perfect for a first-time buyer wanting to build sweat equity or an investor looking for a reliable rental. This home has great bones and only needs minor TLC and cosmetic updates to reach its full potential. The roof was replaced in 2023. It’s a fantastic opportunity to stop renting and customize your own space or add this property to your portfolio in a high-demand area. Property is being sold "as-is"
-
2026-04-04historical Active Under Contract 476-char remark
Show marketing remark (476 chars)
Solid brick ranch featuring 3 bedrooms and 1 bathroom, perfect for a first-time buyer wanting to build sweat equity or an investor looking for a reliable rental. This home has great bones and only needs minor TLC and cosmetic updates to reach its full potential. The roof was replaced in 2023. It’s a fantastic opportunity to stop renting and customize your own space or add this property to your portfolio in a high-demand area. Property is being sold "as-is"
-
2026-04-01$200,000 New 470-char remark
Show marketing remark (476 chars)
Solid brick ranch featuring 3 bedrooms and 1 bathroom, perfect for a first-time buyer wanting to build sweat equity or an investor looking for a reliable rental. This home has great bones and only needs minor TLC and cosmetic updates to reach its full potential. The roof was replaced in 2023. It’s a fantastic opportunity to stop renting and customize your own space or add this property to your portfolio in a high-demand area. Property is being sold "as-is"
-
2026-04-01$200,000 Active 476-char remark
Show marketing remark (476 chars)
Solid brick ranch featuring 3 bedrooms and 1 bathroom, perfect for a first-time buyer wanting to build sweat equity or an investor looking for a reliable rental. This home has great bones and only needs minor TLC and cosmetic updates to reach its full potential. The roof was replaced in 2023. It’s a fantastic opportunity to stop renting and customize your own space or add this property to your portfolio in a high-demand area. Property is being sold "as-is"
-
2026-03-31historical
-
2026-03-31historical
-
2026-03-25price $210,000
-
2026-03-25price $210,000
-
2026-03-17price $220,000
-
2026-03-17price $220,000
-
2026-03-11price $225,000
-
2026-03-11price $225,000
-
2026-03-04price $240,000
-
2026-03-04price $240,000
-
2026-02-24price $255,000
-
2026-02-24price $255,000
-
2026-02-09price $270,000
-
2026-02-09price $270,000
-
2025-12-23$275,000 Active
-
2025-12-23$275,000 New
-
2007-10-25soldstatus $106,900
-
2007-08-20$106,900
-
2005-04-21soldstatus $150,100
ⓘ Source: listings_history table (triggers on properties + properties_extension) + one-shot
backfill from property_details.listing_events for pre-trigger history.
Tax reassessment forecast GA · Resets to sale price
- Current annual tax
- $5,703 · $475/mo
- Projected year-2 tax
- $5,703 · $475/mo
- Expected delta
- $0/yr ($0/mo · 0.0%)
ⓘ Screening estimate from a state-policy table — verify with the county assessor before closing.
Climate risk First Street
- Flood 1/10 Low FEMA zone X (unshaded) · 0% chance over 30 yrs
- Wildfire 1/10 Low
- Heat 5/10 Major 7 d/yr ≥103°F today · 18 d/yr by 30 yrs out
- Wind 4/10 Moderate 17% chance of damaging wind over 30 yrs
- Air quality 5/10 Major 6 unhealthy d/yr today · 8 by 30 yrs out
Nearby sold comps map
Loading sold comps map…
Walkable amenities ~0.75 mi
Loading nearby amenities…
Taxation est. · year 1
- Rental income
- $22,883
- − Mortgage interest
- −$11,203
- − Property taxes
- −$5,703
- − Insurance
- −$1,000
- − Repairs & maintenance
- −$1,831
- − Management
- −$1,831
- − Depreciation
- −$5,818
- Taxable loss
- −$4,503
- Est. tax savings @ 24.0%
- +$1,081
- After-tax cash flow
- $-131/yr
For passive investors: Depreciation is non-cash, so a rental often shows a tax loss while cash-flowing — sheltering income. Rental losses are passive: they offset passive income freely, and up to $25,000/yr can offset ordinary (W-2) income if you actively participate and your MAGI is under $100k (phasing out to $0 by $150k); unused losses carry forward. On sale, claimed depreciation is recaptured at up to 25%, and gains may owe capital-gains tax (a 1031 exchange can defer both). Figures are a year-1 estimate at your 24.0% rate — not tax advice; consult a CPA.
Schools (NCES district)
- District
- Dekalb County
- NCES district ID
- 1301740
- Math proficiency
- 19% ▼ -12.00%
- Reading proficiency
- 28% ▼ -7.00%
- Median HH income
- $51,448
- Composite
- 20.92/100
- National rank
- #8482
- State rank
- #125 of 174 in GA
Livability — Tucker
No livability data for this city. (Only ~50 U.S. cities are tracked.)
Census & demographics
- Census place
- Tucker, GA
- County
- Dekalb County · 782,738 people
- City population
- 38,242
- Metro
- Atlanta-Sandy Springs-Alpharetta, GA
- Population (ZIP)
- 38,242
- Household income
- $81,304
- Rent vs Own
- Severe rent burden
- 1743.0
Population outlook (DeKalb County) Hauer SSP2
- Today (2025)
- 839,977 people
- By 2030
- 891,768 · +6.2%
- By 2040
- 988,894 · +17.7%
- By 2050
- 1,074,583 · +27.9%
- By 2075
- 1,245,026 · +48.2%
- By 2100
- 1,303,135 · +55.1%
Race, ethnicity, and origin ACS 2023
- Neighborhood character
- Highly diverse neighborhood (Simpson 0.75)
- Race & ethnicity
- White 33% Black 26% Hispanic / Latino 22% Asian 15% Two or more races 10%
- Hispanic origin (detail)
- Mexican 8% Puerto Rican 1% Dominican 2%
- Common ancestry
- Italian 3% Slovak 2% Serbian 2%
- Foreign-born
- 32% · Canada, Philippines, China
- Languages at home
- 61% English-only · Spanish 18% Other Indo-European 6% Vietnamese 3%
Political lean MEDSL · DeKalb
- 2024 margin
- Solid D (+64.8) · D 81.9% · R 17.1% · Other 1.0%
- 2008→2024 swing
- +6.1pp toward D · 2008: 58.6pp · 2024: 64.8pp
- All cycles
- 2024: D+64.8 2020: D+67.4 2016: D+64.8 2012: D+56.8 2008: D+58.6
Not yet ingested
- Civics
- —
Market trends
- HPI YoY
- ▼ -271.15%
- Current HPI
- 254.5784
- Rent YoY
- ▼ -0.80%
- Metro
- Atlanta-Sandy Springs-Alpharetta, GA
- State GDP YoY
- ▲ 2.66%
- F500 in state
- 28
Industry mix (Fortune 500 HQ in GA)
| Industry | F500 HQs | Revenue |
|---|---|---|
| Paper / Packaging | 2 | $29B |
|
||
| Retail | 1 | $160B |
|
||
| Transportation / Logistics | 1 | $91B |
|
||
| Airlines | 1 | $62B |
|
||
| Consumer Goods | 1 | $47B |
|
||
| Utilities | 1 | $25B |
|
||
Price history
+33.2% since first listed26 events — show timeline
- 2026-05-15 Relisted — GAMLS
- 2026-05-15 Relisted — FMLS
- 2026-04-10 Pending — FMLS
- 2026-04-04 Contingent — GAMLS
- 2026-04-04 Contingent — FMLS
- 2026-04-01 Listed $200,000 FMLS
- 2026-04-01 Listed $200,000 GAMLS
- 2026-03-31 Listing Removed — GAMLS
- 2026-03-31 Listing Removed — FMLS
- 2026-03-25 Price Changed $210,000 GAMLS
- 2026-03-25 Price Changed $210,000 FMLS
- 2026-03-17 Price Changed $220,000 GAMLS
- 2026-03-17 Price Changed $220,000 FMLS
- 2026-03-11 Price Changed $225,000 GAMLS
- 2026-03-11 Price Changed $225,000 FMLS
- 2026-03-04 Price Changed $240,000 GAMLS
- 2026-03-04 Price Changed $240,000 FMLS
- 2026-02-24 Price Changed $255,000 GAMLS
- 2026-02-24 Price Changed $255,000 FMLS
- 2026-02-09 Price Changed $270,000 GAMLS
- 2026-02-09 Price Changed $270,000 FMLS
- 2025-12-23 Listed $275,000 GAMLS
- 2025-12-23 Listed $275,000 FMLS
- 2007-10-25 Sold (MLS) $106,900 FMLS
- 2007-08-20 Listed $106,900 FMLS
- 2005-04-21 Sold (Public Records) $150,100 Public Records
Property tax history
+4.0%/yrLatest (2025): $5,703 · +6.0% YoY. Source: county tax records.
Cash-flow waterfall
monthlySold comps — $/sqft
last 12 mo · ≤1 miLoading sold comps…