615 Church St · Neodesha, KS
Flood risk 1/10 · Minimal
- FEMA flood zone
- X (unshaded)
- Chance of flooding over 30 yrs
- 0.0%
- Est. flood insurance / yr
- $507 – $1,088
Fire risk 3/10 · Minor
- Est. fire insurance / yr
- $1,154 – $2,142
Heat risk 5/10 · Moderate
- Hot days now (above 108°F)
- 7 days/yr
- Hot days in 30 yrs
- 19 days/yr
Wind risk 2/10 · Minimal
- Chance of severe wind over 30 yrs
- 2.0%
Air-quality risk 2/10 · Minimal
- Unhealthy air days now
- 2 days/yr
- Unhealthy air days in 30 yrs
- 2 days/yr
Risk factors via First Street. Map © Google.
Why this score? — see what drove the B+ grade
The composite is a weighted blend of 9 inputs, each scored 0–100. Each bar is that input's sub-score; the figure is the points it added to the 100-point composite (weight × sub-score).
- Cash flow +30.0/30.0
- ARV discount +15.0/15.0
- DSCR +10.0/10.0
- 1% rule +8.8/10.0
- Appreciation +4.8/10.0
- Livability +3.5/5.0
- Rent growth +2.5/5.0
- Condition / age +2.5/5.0
- Schools +2.4/10.0
$94,900
🖨 Deal sheet 📄 Offer letter ✓ Due diligence
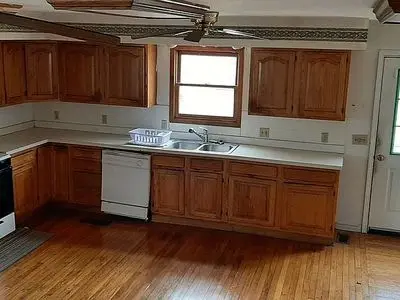
Key facts
- Wood back deck
- Central heat and air
- Front porch
Tags
Neighborhood map
What this means for you Summary
Snapshot
- This is a 4-bed/1.0-bath single-family listed at $95k.
Deal economics
- At list price, monthly cash flow is $379 ($5k/yr) — positive.
- The deal already cash-flows at list — no discount required.
- Meets the 1% rule at list price ($1k rent vs $95k).
- Recommended offer: $93k (1.5% below list) — sets the bar for market timing.
Location & tenants
- Location reads 69/100 on livability (#196 in KS) — a middle-class / working-renter tenant base. Strengths: cost of living A+, housing A+, crime A-; Watch: employment D+, schools D-, amenities F.
- Neodesha (town): math 25% / reading 30% proficiency, ranked #121 of 169 in KS (top 72%) — low school quality limits family demand, transient renter base, plan for 1-2y turnover.
- Market conditions: 22 active listings in the ZIP; 16 units permitted in Wilson County in 2024 (0 in 5+ unit buildings).
Forward outlook
- In year one you build about $263 of equity ($656 loan paydown + $-393 appreciation (-0.4% local appreciation)).
- Wilson County population projected at -25% by 2050 — secular population decline; favor cash flow + early exit over multi-decade hold.
- At projected returns (-0.4% appreciation + 3.0% rent growth), your $27k cash investment doubles in ~5 years — after that, you're playing with house money.
Negotiation context
- It's been on market 23 days — a 2% lower offer ($93k) is reasonable based on typical stale-listing flexibility.
- 2 sale attempts with the ask held roughly flat each time — persistent listings suggest the price (not the market) is what's stuck; bring a comps-based counter.
Risks & watch-outs
- Climate carrying-cost: extreme-heat days projected 7→19/yr by 2055 (HVAC capex compounding) — expect insurance premiums to compound above CPI over the hold.
Questions for the listing agent
- Is there a deadline driving the sale (1031 exchange, divorce, estate, relocation)? That informs how much negotiation room exists.
- Schools are D-rated, which usually means shorter tenancies and higher turnover. Who's the typical renter profile here, and what's been the actual vacancy rate?
- What's the average days-on-market for RENTAL listings here right now (not sales)? A rising rental-DOM trend means longer vacancies and softer asking-rent achievability than the comps imply.
- What's the recent tenant-quality profile in this submarket — average credit score on applications, eviction rate, late-payment / NSF rate, and stable-employment percentage? A property-management company in the area should have these aggregated.
- How much new for-sale + rental construction is in the pipeline within 1–3 miles? Heavy new supply typically softens prices + rents 12–24 months out; constrained supply supports both.
Investment metrics
- 1% rule
- 1.38% ✓
- Cap rate
- 11.08%
- Cash-on-cash
- 17.11%
- DSCR
- 1.76
- GRM
- 6.0
CMA / ARV
- ARV (on-the-fly)
- $124,047
- Comps found
- 6
Show comp detail 6 sales within ~0.75 mi
| Address | Dist | Beds/Ba | Sqft | Sold | Price | $/sf | Match |
|---|---|---|---|---|---|---|---|
| 516 N 8th St | 0.08mi | 4/2.0 | 2,120 (+8%) | 3mo | $133,000 | $63 | 77 |
| 704 Church St | 0.04mi | 3/2.0 (-1) | 1,953 (-1%) | 24mo | $115,000 | $59 | 68 |
| 122 N 3rd St | 0.42mi | 4/3.0 | 2,088 (+6%) | 7mo | $189,000 | $91 | 56 |
| 1520 N 8th St | 0.73mi | 4/2.0 | 2,051 (+4%) | 4mo | $205,000 | $100 | 52 |
| 540 S 5th St | 0.73mi | 4/2.0 | 2,116 (+8%) | 3mo | $73,900 | $35 | 47 |
| 915 Main St | 0.44mi | 3/2.0 (-1) | 1,821 (-8%) | 18mo | $99,000 | $54 | 43 |
Match score weights: distance 35% · size 25% · config 20% · recency 20%. Top-matched comps best support the ARV.
Projected returns pro-forma
-0.41% appreciation · 3.0% rent growth · sell at horizon
- IRR
- 15.7%
- Equity multiple
- 1.74×
- Total profit
- $19,546
- Equity at exit
- $25,608
- IRR
- 20.7%
- Equity multiple
- 3.21×
- Total profit
- $58,597
- Equity at exit
- $29,267
Cash invested: $26,572 (down + closing). Projections, not guarantees.
Landlord ↔ Tenant lean methodology
- Overall (STATE)
- 83 Strongly Landlord-Friendly
- State Kansas
- 83 Strongly Landlord-Friendly · R+10
- County
- — inherits STATE
- City
- — inherits STATE
ZIP-level market 66757
- Home prices YoY
- -0.3%
- Active inventory
- 22
- Price-to-rent
- 6.0×
Monthly cashflow live
- Estimated rent
- $1,310 medium interval (Pro) →
- Mortgage (P&I)
- −$498
- Tax est. 1.5%
- −$119 /mo · $1,424/yr
- Insurance
- −$40
- HOA
- −$0
- Vacancy / Maint / Mgmt
- −$275
- Net cashflow
- $379
Break-even live
UW: 25.0% down · 7.5% · 30yr · 1.5% tax · 5.0% vac · 8.0% maint · 8.0% mgmt
Financing live
Cash to close
- Down payment
- $23,725
- Closing costs
- $2,847
- Reserves months
- —
- Total cash needed
- —
Loan-product check · same deal, 3 products live
Conventional
25% down · 7.5% · 30yr
- Down + closing
- —
- Monthly P&I
- —
- Monthly cashflow
- —
- DSCR
- —
- Eligible?
- —
Personal DTI + credit; lowest rate.
DSCR
20% down · 8.5% · 30yr
- Down + closing
- —
- Monthly P&I
- —
- Monthly cashflow
- —
- DSCR
- —
- Eligible?
- —
No personal income docs; deal must DSCR.
Hard money
10% down · 12.0% · 12mo
- Down + closing
- —
- Monthly P&I
- —
- Monthly cashflow
- —
- DSCR
- —
- Eligible?
- —
Short-term bridge; refi at stabilization.
Listing history 23 events
-
2026-06-18days on market $94,900 Active 23 DOM
-
2026-06-17days on market $94,900 Active 22 DOM
-
2026-06-16days on market $94,900 Active 21 DOM
-
2026-06-15days on market $94,900 Active 20 DOM
-
2026-06-13days on market $94,900 Active 18 DOM
-
2026-06-12days on market $94,900 Active 17 DOM
-
2026-06-09days on market $94,900 Active 14 DOM
-
2026-06-08days on market $94,900 Active 13 DOM
-
2026-06-07days on market $94,900 Active 12 DOM
-
2026-06-05days on market $94,900 Active 10 DOM
-
2026-06-04days on market $94,900 Active 8 DOM
-
2026-06-02days on market $94,900 Active 7 DOM
-
2026-06-01days on market $94,900 Active 6 DOM
-
2026-05-31days on market $94,900 Active 5 DOM
-
2026-05-31days on market $94,900 Active 4 DOM
-
2026-05-26$94,900 Active
-
2025-12-24historical
-
2025-10-16price $93,900
-
2025-10-07price $94,900
-
2025-09-30price $98,900
-
2025-07-29price $99,800
-
2025-07-16price $107,500
-
2025-06-24$109,500 Active
ⓘ Source: listings_history table (triggers on properties + properties_extension) + one-shot
backfill from property_details.listing_events for pre-trigger history.
Climate risk First Street
- Flood 1/10 Low FEMA zone X (unshaded) · 0% chance over 30 yrs
- Wildfire 3/10 Moderate
- Heat 5/10 Major 7 d/yr ≥108°F today · 19 d/yr by 30 yrs out
- Wind 2/10 Low 2% chance of damaging wind over 30 yrs
- Air quality 2/10 Low 2 unhealthy d/yr today · 2 by 30 yrs out
Nearby sold comps map
Loading sold comps map…
Walkable amenities ~0.75 mi
Loading nearby amenities…
Taxation est. · year 1
- Rental income
- $15,718
- − Mortgage interest
- −$5,316
- − Property taxes
- −$1,424
- − Insurance
- −$474
- − Repairs & maintenance
- −$1,257
- − Management
- −$1,257
- − Depreciation
- −$2,761
- Taxable income
- $3,228
- Est. tax owed @ 24.0%
- −$775
- After-tax cash flow
- $3,772/yr
For passive investors: Depreciation is non-cash, so a rental often shows a tax loss while cash-flowing — sheltering income. Rental losses are passive: they offset passive income freely, and up to $25,000/yr can offset ordinary (W-2) income if you actively participate and your MAGI is under $100k (phasing out to $0 by $150k); unused losses carry forward. On sale, claimed depreciation is recaptured at up to 25%, and gains may owe capital-gains tax (a 1031 exchange can defer both). Figures are a year-1 estimate at your 24.0% rate — not tax advice; consult a CPA.
Schools (NCES district)
- District
- Neodesha
- NCES district ID
- 2009900
- Math proficiency
- 25% ▼ -6.00%
- Reading proficiency
- 30% ▼ -4.00%
- Median HH income
- $43,989
- Composite
- 23.54/100
- National rank
- #7863
- State rank
- #121 of 169 in KS
Livability — Neodesha
- Score
- 69/100
- State rank
- #196
- US rank
- #8894
Category grades
Schools grade is shown separately in the Schools card above.
Census & demographics
- Census place
- Neodesha, KS
- Population (ZIP)
- 3,225
Population outlook (Wilson County) Hauer SSP2
- Today (2025)
- 7,872 people
- By 2030
- 7,383 · -6.2%
- By 2040
- 6,533 · -17.0%
- By 2050
- 5,923 · -24.8%
- By 2075
- 5,134 · -34.8%
- By 2100
- 4,788 · -39.2%
Race, ethnicity, and origin ACS 2023
- Neighborhood character
- Predominantly White (89%)
- Race & ethnicity
- White 89% Two or more races 6% Hispanic / Latino 4%
- Common ancestry
- Italian 7% Lithuanian 1% Slovak 1%
- Foreign-born
- 1% · Canada
- Languages at home
- 98% English-only · Spanish 1%
Political lean MEDSL · Wilson
- 2024 margin
- Solid R (+62.4) · D 18.0% · R 80.3% · Other 1.7%
- 2008→2024 swing
- -21.6pp toward R · 2008: -40.8pp · 2024: -62.4pp
- All cycles
- 2024: R+62.4 2020: R+61.5 2016: R+63.1 2012: R+54.0 2008: R+40.8
Not yet ingested
- Civics
- —
Market trends
- HPI YoY
- ▼ -0.41%
- Current HPI
- 131.4107
- Rent YoY
- —
- Metro
- —
- State GDP YoY
- —
- F500 in state
- 0
Price history
-13.3% since first listed8 events — show timeline
- 2026-05-26 Listed $94,900 FSBO.com
- 2025-12-24 Listing Removed — Heartland MLS as Distributed by MLS Grid
- 2025-10-16 Price Changed $93,900 Heartland MLS as Distributed by MLS Grid
- 2025-10-07 Price Changed $94,900 Heartland MLS as Distributed by MLS Grid
- 2025-09-30 Price Changed $98,900 Heartland MLS as Distributed by MLS Grid
- 2025-07-29 Price Changed $99,800 Heartland MLS as Distributed by MLS Grid
- 2025-07-16 Price Changed $107,500 Heartland MLS as Distributed by MLS Grid
- 2025-06-24 Listed $109,500 Heartland MLS as Distributed by MLS Grid
Cash-flow waterfall
monthlySold comps — $/sqft
last 12 mo · ≤1 miLoading sold comps…