1907 W Flamingo #69 #69 · Nampa, ID
Flood risk 1/10 · Minimal
- FEMA flood zone
- X (unshaded)
- Chance of flooding over 30 yrs
- 0.0%
- Est. flood insurance / yr
- $507 – $1,088
Fire risk 1/10 · Minimal
- Est. fire insurance / yr
- $584 – $1,086
Heat risk 5/10 · Moderate
- Hot days now (above 98°F)
- 7 days/yr
- Hot days in 30 yrs
- 19 days/yr
Wind risk 1/10 · Minimal
- Chance of severe wind over 30 yrs
- —
Air-quality risk 8/10 · Major
- Unhealthy air days now
- 12 days/yr
- Unhealthy air days in 30 yrs
- 19 days/yr
Risk factors via First Street. Map © Google.
Why this score? — see what drove the B- grade
The composite is a weighted blend of 9 inputs, each scored 0–100. Each bar is that input's sub-score; the figure is the points it added to the 100-point composite (weight × sub-score).
- Cash flow +27.0/30.0
- ARV discount +10.9/15.0
- DSCR +9.3/10.0
- 1% rule +6.1/10.0
- Rent growth +4.1/5.0
- Schools +3.8/10.0
- Livability +3.6/5.0
- Condition / age +2.5/5.0
- Appreciation +0.0/10.0
$168,000
🖨 Deal sheet 📄 Offer letter ✓ Due diligence
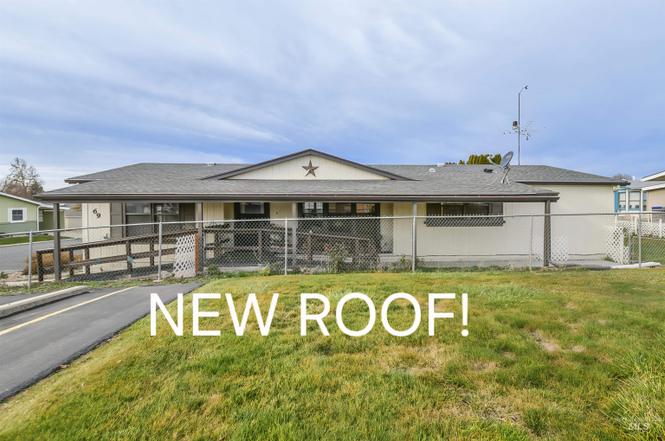
Listing remarks
NEW 30 YEAR ROOF will be installed before closing! Along with the new roof, you will enjoy your NEW heat pump/air conditioner and upgraded 200-amp electrical service installed in August 2025. This well-maintained manufactured home offers a bright, open living room and an efficient layout designed for comfort and convenience. Space rent is an exceptional value at just $407 per month and includes water, sewer, and trash and irrigation. Set on a permanent foundation and lovingly cared for, this home provides low-maintenance, worry-free living. Storage shed is filled with extra cabinets for storage and a work bench. Additional perks include extra parking, with the home located right next to the
Key facts
- Gated community
- Relaxing spa
- Clubhouse
Tags
Neighborhood map
What this means for you Summary
Snapshot
- This is a 3-bed/2.0-bath manufactured listed at $168k.
Deal economics
- At list price, monthly cash flow is $469 ($6k/yr) — positive.
- The deal already cash-flows at list — no discount required.
- Meets the 1% rule at list price ($2k rent vs $168k).
- Recommended offer: $148k (12.0% below list) — sets the bar for market timing.
- Cap rate 9.6% vs local median 3.2% in Nampa — top-decile yield for the area; either an underpriced asset or a hidden risk that comps aren't pricing in. Stress-test before assuming the spread holds.
Location & tenants
- Location reads 72/100 on livability (#47 in ID) — a middle-class / working-renter tenant base. Strengths: housing A+, health & safety A+, cost of living A-; Watch: employment C-, schools D+, amenities F.
- Vallivue School District (rural): math 34% / reading 56% proficiency, ranked #48 of 92 in ID (top 52%) — families likely to look elsewhere, expect single-tenant / working-renter base with shorter leases.
- Market conditions: Rents rising fast (+6.4%/yr); 319 active listings in the ZIP; 15 comparable units currently listed for rent nearby; rentals leasing fast (median 11d on market — plan ~1-2 weeks tenant-placement turnaround); 3,620 units permitted in Canyon County in 2024 (196 in 5+ unit buildings).
- This rent runs 32% of the median local income ($70k/yr) — at the standard rent-burdened threshold; future hikes will face affordability resistance.
Forward outlook
- Local home prices are declining (-3.0%/yr); year-one equity from $1k of loan paydown is wiped out by about $5k of value loss. Plan a longer hold.
- Canyon County population projected at +41% by 2050 — long-run rental-demand tailwind backs the buy-and-hold thesis.
- At projected returns (-3.0% appreciation + 6.4% rent growth), your $47k cash investment doubles in ~8 years — after that, you're playing with house money.
Negotiation context
- It's been on market 128 days — a 12% lower offer ($148k) is reasonable based on typical stale-listing flexibility.
- 4 sale attempts since 24y ago with the ask held roughly flat each time — persistent listings suggest the price (not the market) is what's stuck; bring a comps-based counter.
Risks & watch-outs
- Climate carrying-cost: extreme-heat days projected 7→19/yr by 2055 (HVAC capex compounding) — expect insurance premiums to compound above CPI over the hold.
Questions for the listing agent
- It's been on market 128 days. Have you received any prior offers? Is the seller open to a 12% concession, seller financing, or rate buy-down credit?
- Why hasn't it sold? Are there any deal-killer items the seller is aware of (foundation, flood, title, zoning, code violations)?
- Is there a deadline driving the sale (1031 exchange, divorce, estate, relocation)? That informs how much negotiation room exists.
- Schools are D-rated, which usually means shorter tenancies and higher turnover. Who's the typical renter profile here, and what's been the actual vacancy rate?
- What's the average days-on-market for RENTAL listings here right now (not sales)? A rising rental-DOM trend means longer vacancies and softer asking-rent achievability than the comps imply.
- What's the recent tenant-quality profile in this submarket — average credit score on applications, eviction rate, late-payment / NSF rate, and stable-employment percentage? A property-management company in the area should have these aggregated.
- How much new for-sale + rental construction is in the pipeline within 1–3 miles? Heavy new supply typically softens prices + rents 12–24 months out; constrained supply supports both.
Investment metrics
- 1% rule
- 1.11% ✓
- Cap rate
- 9.64%
- Cash-on-cash
- 11.96%
- DSCR
- 1.53
- GRM
- 7.5
CMA / ARV
- ARV (on-the-fly)
- $181,560
- Comps found
- 12
Show comp detail 12 sales within ~0.75 mi
| Address | Dist | Beds/Ba | Sqft | Sold | Price | $/sf | Match |
|---|---|---|---|---|---|---|---|
| 1907 W Flamingo #69 #69 | 0.00mi | 3/2.0 | 1,513 (0%) | 1mo | $168,000 | $111 | 100 |
| 1907 W Flamingo Ave #100 | 0.00mi | 3/2.0 | 1,508 (-0%) | 3mo | $189,000 | $125 | 97 |
| 1907 W Flamingo Ave #88 | 0.00mi | 3/2.0 | 1,600 (+6%) | 5mo | $179,800 | $112 | 86 |
| 1907 W Flamingo Ave #152 | 0.00mi | 2/2.0 (-1) | 1,452 (-4%) | 3mo | $160,000 | $110 | 86 |
| 1907 W Flamingo Ave Trlr 118 | 0.00mi | 3/2.0 | 1,570 (+4%) | 9mo | $189,000 | $120 | 86 |
| 1907 W Flamingo Ave Unit 43 | 0.00mi | 3/2.0 | 1,632 (+8%) | 2mo | $179,995 | $110 | 85 |
| 1907 W Flamingo Ave #74 | 0.00mi | 3/2.0 | 1,364 (-10%) | 0mo | $179,900 | $132 | 83 |
| 1907 Flamingo #109 | 0.00mi | 3/2.0 | 1,368 (-10%) | 3mo | $179,900 | $132 | 82 |
| 1907 W Flamingo Ave Unit 125 Unit 125 | 0.00mi | 3/2.0 | 1,404 (-7%) | 8mo | $160,000 | $114 | 82 |
| 1907 W Flamingo Ave #79 | 0.00mi | 3/2.0 | 1,348 (-11%) | 2mo | $175,000 | $130 | 80 |
| 1907 W Flamingo Ave #169 | 0.00mi | 3/2.0 | 1,348 (-11%) | 8mo | $174,900 | $130 | 76 |
| 1410 Flamingo Ave #49 | 0.38mi | 3/2.0 | 1,440 (-5%) | 2mo | $79,900 | $55 | 73 |
Match score weights: distance 35% · size 25% · config 20% · recency 20%. Top-matched comps best support the ARV.
Projected returns pro-forma
-3.0% appreciation · 6.41% rent growth · sell at horizon
- IRR
- 4.9%
- Equity multiple
- 1.19×
- Total profit
- $9,163
- Equity at exit
- $25,049
- IRR
- 17.0%
- Equity multiple
- 2.60×
- Total profit
- $75,212
- Equity at exit
- $14,526
Cash invested: $47,040 (down + closing). Projections, not guarantees.
Landlord ↔ Tenant lean methodology
- Overall (STATE)
- 91 Strongly Landlord-Friendly
- State Idaho
- 91 Strongly Landlord-Friendly · R+18
- County
- — inherits STATE
- City
- — inherits STATE
ZIP-level market 83651
- Home prices YoY
- -28.3%
- Rents YoY
- 6.4%
- Active inventory
- 319
- Price-to-rent
- 7.5×
Monthly cashflow live
- Estimated rent
- $1,862 high interval (Pro) →
- Mortgage (P&I)
- −$881
- Tax from tax record
- −$51 /mo · $615/yr
- Insurance
- −$70
- HOA
- −$0
- Vacancy / Maint / Mgmt
- −$391
- Net cashflow
- $469
Break-even live
UW: 25.0% down · 7.5% · 30yr · 1.5% tax · 5.0% vac · 8.0% maint · 8.0% mgmt
Financing live
Cash to close
- Down payment
- $42,000
- Closing costs
- $5,040
- Reserves months
- —
- Total cash needed
- —
Loan-product check · same deal, 3 products live
Conventional
25% down · 7.5% · 30yr
- Down + closing
- —
- Monthly P&I
- —
- Monthly cashflow
- —
- DSCR
- —
- Eligible?
- —
Personal DTI + credit; lowest rate.
DSCR
20% down · 8.5% · 30yr
- Down + closing
- —
- Monthly P&I
- —
- Monthly cashflow
- —
- DSCR
- —
- Eligible?
- —
No personal income docs; deal must DSCR.
Hard money
10% down · 12.0% · 12mo
- Down + closing
- —
- Monthly P&I
- —
- Monthly cashflow
- —
- DSCR
- —
- Eligible?
- —
Short-term bridge; refi at stabilization.
Rent comps 15 comps
| Address | Beds | Baths | Sqft | Rent | $/sqft | DOM | Units | Dist |
|---|---|---|---|---|---|---|---|---|
| 2084 W Bella Ln Unit 1460910P Nampa, ID | 3.0 | 2.0 | 1237 | $3,905 | $3.16 | 23d | 1 | 0.38mi |
| 1820 W Camelot Dr Nampa, ID | 3.0 | 2.0 | 1400 | $2,195 | $1.57 | 3d | 1 | 0.41mi |
| 1215 N Benewah St Nampa, ID | 3.0 | 2.0 | 1219 | $1,250 | $1.03 | 14d | 1 | 0.60mi |
| 1275 Caldwell Blvd Nampa, ID | 1.0–3.0 | 1.0–2.0 | 921 | $1,900 | $2.06 | 23d | 1 | 0.62mi |
| 15690 N Knightgate Ln Nampa, ID | 2.0–3.0 | 2.0–3.0 | 1239 | $1,825 | $1.47 | 2d | 3 | 0.68mi |
| 11130 W Ashburn Ln Nampa, ID | 2.0 | 2.0 | 1106 | $1,650 | $1.49 | 14d | 2 | 0.70mi |
| 11215 W Ashburn Ln Nampa, ID | 2.0–3.0 | 2.0–3.0 | 1176 | $1,825 | $1.55 | 2d | 2 | 0.76mi |
| 11214 W Ashburn Ln Nampa, ID | 3.0 | 3.0 | 1301 | $1,825 | $1.40 | 2d | 2 | 0.78mi |
| 2410 W Vanderbilt Ln Nampa, ID | 1.0–3.0 | 1.0–2.0 | 1029 | $2,425 | $2.36 | 2d | 30 | 0.78mi |
| 450 W Orchard Ave Nampa, ID | 1.0–3.0 | 1.0–2.0 | 1129 | $1,699 | $1.50 | 3d | 11 | 0.92mi |
| 617 Purple Sage Dr Nampa, ID | 3.0 | 2.0 | 1104 | $1,795 | $1.63 | 23d | 1 | 1.07mi |
| 16060 N Merchant Way Nampa, ID | 2.0–3.0 | 2.0 | 1115 | $1,695 | $1.52 | 2d | 1 | 1.10mi |
| 9848 W Sand Hill Dr Nampa, ID | 1.0–3.0 | 1.0–2.0 | 1008 | $1,650 | $1.64 | 23d | 1 | 1.18mi |
| 123 Trifecta Ln Nampa, ID | 3.0 | 2.5 | 1505 | $1,795 | $1.19 | 11d | 1 | 1.23mi |
| 11269 W Quartet St Nampa, ID | 3.0 | 2.0 | 1410 | $2,300 | $1.63 | 14d | 1 | 1.49mi |
Listing history 11 events
-
2026-04-22status Pending
-
2026-04-09price $168,000
-
2026-03-05price $169,000
-
2026-02-06status Active
-
2026-02-04status Pending
-
2025-12-12$175,000 Active
-
2018-08-16soldstatus Sold
-
2018-07-26historical Contingent
-
2018-07-13$99,900 Active
-
2002-05-24soldstatus
-
2002-03-06$67,500
ⓘ Source: listings_history table (triggers on properties + properties_extension) + one-shot
backfill from property_details.listing_events for pre-trigger history.
Tax reassessment forecast ID · Resets to sale price
- Current annual tax
- $615 · $51/mo
- Projected year-2 tax
- $1,159 · $97/mo
- Expected delta
- +$545/yr (+$45/mo · 88.6%)
ⓘ Screening estimate from a state-policy table — verify with the county assessor before closing.
Climate risk First Street
- Flood 1/10 Low FEMA zone X (unshaded) · 0% chance over 30 yrs
- Wildfire 1/10 Low
- Heat 5/10 Major 7 d/yr ≥98°F today · 19 d/yr by 30 yrs out
- Wind 1/10 Low
- Air quality 8/10 Severe 12 unhealthy d/yr today · 19 by 30 yrs out
Nearby sold comps map
Loading sold comps map…
Walkable amenities ~0.75 mi
Loading nearby amenities…
Taxation est. · year 1
- Rental income
- $22,342
- − Mortgage interest
- −$9,411
- − Property taxes
- −$615
- − Insurance
- −$840
- − Repairs & maintenance
- −$1,787
- − Management
- −$1,787
- − Depreciation
- −$4,887
- Taxable income
- $3,015
- Est. tax owed @ 24.0%
- −$724
- After-tax cash flow
- $4,900/yr
For passive investors: Depreciation is non-cash, so a rental often shows a tax loss while cash-flowing — sheltering income. Rental losses are passive: they offset passive income freely, and up to $25,000/yr can offset ordinary (W-2) income if you actively participate and your MAGI is under $100k (phasing out to $0 by $150k); unused losses carry forward. On sale, claimed depreciation is recaptured at up to 25%, and gains may owe capital-gains tax (a 1031 exchange can defer both). Figures are a year-1 estimate at your 24.0% rate — not tax advice; consult a CPA.
Schools (NCES district)
- District
- Vallivue School District
- NCES district ID
- 1600600
- Math proficiency
- 34% ▼ -9.00%
- Reading proficiency
- 56% ▼ -1.00%
- Median HH income
- $47,377
- Composite
- 38.3/100
- National rank
- #4229
- State rank
- #48 of 92 in ID
Livability — Nampa
- Score
- 72/100
- State rank
- #47
- US rank
- #6250
Category grades
Schools grade is shown separately in the Schools card above.
Census & demographics
- Census place
- Nampa, ID
- County
- Canyon County · 235,358 people
- City population
- 142,249
- Metro
- Boise City, ID
- Population (ZIP)
- 38,121
- Household income
- $69,914
- Rent vs Own
- Severe rent burden
- 723.0
Population outlook (Canyon County) Hauer SSP2
- Today (2025)
- 248,853 people
- By 2030
- 269,596 · +8.3%
- By 2040
- 311,081 · +25.0%
- By 2050
- 350,809 · +41.0%
- By 2075
- 441,884 · +77.6%
- By 2100
- 505,641 · +103.2%
Race, ethnicity, and origin ACS 2023
- Neighborhood character
- Predominantly White (70%)
- Race & ethnicity
- White 70% Hispanic / Latino 24% Two or more races 11%
- Hispanic origin (detail)
- Mexican 20%
- Common ancestry
- Portuguese 3% Slovak 2% Lithuanian 2%
- Foreign-born
- 8% · Canada, Vietnam
- Languages at home
- 81% English-only · Spanish 16% German/W. Germanic 1% Russian/Polish/Slavic 1%
Political lean MEDSL · Canyon
- 2024 margin
- Solid R (+46.6) · D 25.4% · R 72.0% · Other 2.5%
- 2008→2024 swing
- -11.4pp toward R · 2008: -35.2pp · 2024: -46.6pp
- All cycles
- 2024: R+46.6 2020: R+39.7 2016: R+41.8 2012: R+37.1 2008: R+35.2
Not yet ingested
- Civics
- —
Market trends
- HPI YoY
- ▼ -132.40%
- Current HPI
- 335.6717
- Rent YoY
- ▲ 6.41%
- Metro
- Boise City, ID
- State GDP YoY
- ▲ 4.51%
- F500 in state
- 6
Industry mix (Fortune 500 HQ in ID)
| Industry | F500 HQs | Revenue |
|---|---|---|
| Retail | 1 | $79B |
|
||
| Technology | 1 | $25B |
|
||
| Food / Agriculture | 1 | $6B |
|
||
Price history
+148.9% since first listed11 events — show timeline
- 2026-04-22 Pending — IMLS
- 2026-04-09 Price Changed $168,000 IMLS
- 2026-03-05 Price Changed $169,000 IMLS
- 2026-02-06 Relisted — IMLS
- 2026-02-04 Pending — IMLS
- 2025-12-12 Listed $175,000 IMLS
- 2018-08-16 Sold (MLS) — IMLS
- 2018-07-26 Contingent — IMLS
- 2018-07-13 Listed $99,900 IMLS
- 2002-05-24 Sold (MLS) — IMLS
- 2002-03-06 Listed $67,500 IMLS
Property tax history
+3.1%/yrLatest (2025): $615 · +5.2% YoY. Source: county tax records.
Cash-flow waterfall
monthlySold comps — $/sqft
last 12 mo · ≤1 miLoading sold comps…