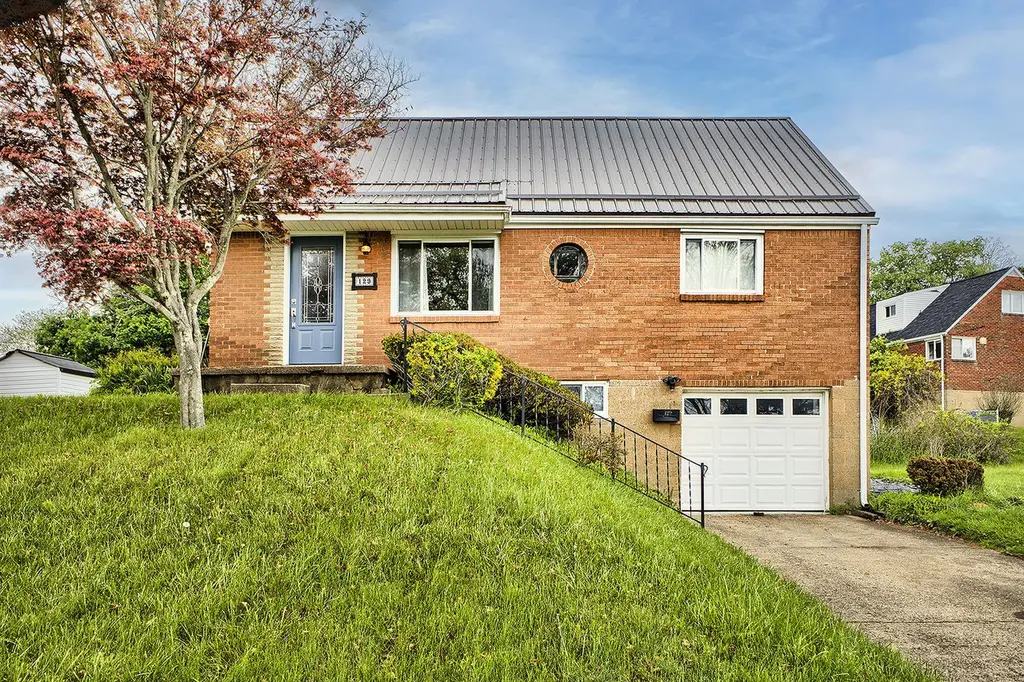
129 Ange Dr · Penn Hills, PA
Flood risk 1/10 · Minimal
- FEMA flood zone
- X (unshaded)
- Chance of flooding over 30 yrs
- 0.0%
- Est. flood insurance / yr
- $473 – $860
Fire risk 1/10 · Minimal
- Est. fire insurance / yr
- $511 – $949
Heat risk 3/10 · Minor
- Hot days now (above 96°F)
- 7 days/yr
- Hot days in 30 yrs
- 17 days/yr
Wind risk 2/10 · Minimal
- Chance of severe wind over 30 yrs
- 0.0%
Air-quality risk 4/10 · Minor
- Unhealthy air days now
- 5 days/yr
- Unhealthy air days in 30 yrs
- 7 days/yr
Risk factors via First Street. Map © Google.
Why this score? — see what drove the D grade
The composite is a weighted blend of 9 inputs, each scored 0–100. Each bar is that input's sub-score; the figure is the points it added to the 100-point composite (weight × sub-score).
- Cash flow +17.1/30.0
- ARV discount +5.4/15.0
- DSCR +5.3/10.0
- 1% rule +4.6/10.0
- Rent growth +4.4/5.0
- Livability +2.5/5.0
- Condition / age +2.5/5.0
- Schools +1.6/10.0
- Appreciation +0.0/10.0
$175,000
🖨 Deal sheet (PDF) 📄 Offer letter ✓ Due diligence
Listing remarks
This all-brick 4-bedroom, 2 full bathroom, integral garage Cape Cod home offers comfort and convenience in a great location. The first floor features a bright and welcoming living room and eat in kitchen, including a dishwasher, gas range, microwave and refrigerator. Two bedrooms and a full bath complete the main level. Upstairs, you’ll find two additional spacious bedrooms with ample closet space. The finished basement provides extra living area and includes an additional refrigerator and a washer and dryer. Enjoy convenient access to shopping, dining, major highways, and the bus line – everything you need is just minutes away.
Key facts
- Integral garage
- Eat in kitchen
- Ample closet space
Tags
Property features AI
Finance
- HOA & community: Public transportation access
Exterior
- Parking: 3 total parking spaces; Garage with door opener
- Utilities: Public water; Public sewer
- Home design: 2 stories; Resale property
- Construction: Brick construction; Shake roof; Home warranty included
- Exterior features: Lot dimensions approximately 66.165 x 109.237 x 82.91
Interior
- Kitchen: Cooktop; Stove; Microwave; Refrigerator; Dishwasher
- Bedrooms: Bedroom 2 on main level (11x9); Bedroom 3 on upper level (14x11); Bedroom 4 on upper level (11x11)
- Flooring: Carpet; Hardwood; Vinyl
- Bathrooms: 2 full bathrooms
- Heating & cooling: Central air
- Interior features: Walk-out basement; Bonus room (basement)
- Laundry & utility: Washer; Dryer; Dedicated laundry room (basement, 12x12)
Neighborhood map
What this means for you Summary
Snapshot
- This is a 4-bed/1.5-bath single-family listed at $175k.
Deal economics
- At list price, monthly cash flow is $122 ($1k/yr) — positive.
- The deal already cash-flows at list — no discount required.
- To meet the 1% rule (rent ≥ 1% of price), the offer needs to be $167k (4.4% below list).
- Recommended offer: $167k (4.4% below list) — sets the bar for 1% rule.
Location & tenants
- Location reads: area grade D — affects rentability + tenant quality, not the cash-flow math above.
- Penn Hills SD (suburban): math 13% / reading 24% proficiency, ranked #496 of 539 in PA (top 92%) — low school quality limits family demand, transient renter base, plan for 1-2y turnover.
- Zoned schools: Penn Hills El Sch (math 14% / reading 27%, grade F, #1,243 of 1,518 statewide, top 82%, 1,279 students, 100% FRL); Linton Ms (math 3% / reading 21%, grade F, #489 of 512 statewide, top 96%, 640 students, 100% FRL); Penn Hills Shs (math 34% / reading 24%, grade F, #357 of 437 statewide, top 82%, 1,107 students, 88% FRL) — zoned schools average 96% FRL vs 56% district-wide (40 pts higher); higher-poverty schools than district average — tighter screening recommended.
- Market conditions: Rents rising fast (+7.6%/yr); 129 active listings in the ZIP; 10 comparable units currently listed for rent nearby; rentals at typical pace (median 17d on market — plan ~3-4 weeks tenant-placement turnaround); 2,996 units permitted in Allegheny County in 2024 (1,588 in 5+ unit buildings).
Forward outlook
- Local home prices are declining (-3.0%/yr); year-one equity from $1k of loan paydown is wiped out by about $5k of value loss. Plan a longer hold.
- At projected returns (-3.0% appreciation + 7.6% rent growth), your $49k cash investment doubles in ~10 years — after that, you're playing with house money.
Negotiation context
- It's been on market 29 days — a 2% lower offer ($172k) is reasonable based on typical stale-listing flexibility.
Risks & watch-outs
- Watch-outs: built in 1957 — expect roof / HVAC / electrical / plumbing capex.
Questions for the listing agent
- Built in 1957 — when were the roof, HVAC, electrical panel, plumbing, and water heater last replaced?
- Is there a deadline driving the sale (1031 exchange, divorce, estate, relocation)? That informs how much negotiation room exists.
- The area grade is low — what's the realistic commute time and amenity access for the typical tenant pool here? Any planned neighborhood developments (good or bad) we should know about?
- What's the average days-on-market for RENTAL listings here right now (not sales)? A rising rental-DOM trend means longer vacancies and softer asking-rent achievability than the comps imply.
- What's the recent tenant-quality profile in this submarket — average credit score on applications, eviction rate, late-payment / NSF rate, and stable-employment percentage? A property-management company in the area should have these aggregated.
- How much new for-sale + rental construction is in the pipeline within 1–3 miles? Heavy new supply typically softens prices + rents 12–24 months out; constrained supply supports both.
Investment metrics
- 1% rule
- 0.96% ✗
- Cap rate
- 7.13%
- Cash-on-cash
- 2.98%
- DSCR
- 1.13
- GRM
- 8.7
CMA / ARV
- ARV (median comp)
- $167,079
- List price
- $175,000
- Delta
- 4.74%
- Verdict
- FAIR
- Comps
- 20 within 1.0 mi
Show comp detail 12 sales within ~0.75 mi
| Address | Dist | Beds/Ba | Sqft | Sold | Price | $/sf | Match |
|---|---|---|---|---|---|---|---|
| 129 Ange Dr | 0.00mi | 4/2.0 | 1,200 (0%) | 0mo | $193,750 | $161 | 98 |
| 1243 Universal Rd | 0.09mi | 3/1.5 (-1) | 1,163 (-3%) | 2mo | $149,000 | $128 | 84 |
| 136 Deerfield Dr | 0.30mi | 3/1.5 (-1) | 1,145 (-5%) | 1mo | $190,000 | $166 | 72 |
| 393 Collins Dr | 0.30mi | 3/3.0 (-1) | 1,238 (+3%) | 5mo | $182,000 | $147 | 65 |
| 365 Stotler Rd | 0.66mi | 3/1.5 (-1) | 1,196 (-0%) | 4mo | $190,000 | $159 | 60 |
| 156 Deerfield Dr | 0.35mi | 4/2.0 | 1,361 (+13%) | 1mo | $250,000 | $184 | 59 |
| 117 Clay Dr | 0.71mi | 3/2.0 (-1) | 1,163 (-3%) | 2mo | $194,000 | $167 | 53 |
| 356 Stotler Rd | 0.64mi | 3/1.0 (-1) | 1,306 (+9%) | 5mo | $139,000 | $106 | 45 |
| 380 Tall Tree Dr | 0.61mi | 4/2.0 | 1,341 (+12%) | 7mo | $137,500 | $103 | 44 |
| 252 Shenandoah Dr | 0.75mi | 3/2.0 (-1) | 1,288 (+7%) | 4mo | $225,000 | $175 | 43 |
| 333 Stotler Rd | 0.61mi | 3/1.0 (-1) | 1,026 (-14%) | 3mo | $201,000 | $196 | 38 |
| 369 Stotler Rd | 0.67mi | 3/1.0 (-1) | 1,026 (-14%) | 7mo | $135,000 | $132 | 32 |
Match score weights: distance 35% · size 25% · config 20% · recency 20%. Top-matched comps best support the ARV.
Projected returns pro-forma
-3.0% appreciation · 7.63% rent growth · sell at horizon
- IRR
- -6.5%
- Equity multiple
- 0.75×
- Total profit
- $-12,432
- Equity at exit
- $26,093
- IRR
- 8.0%
- Equity multiple
- 1.74×
- Total profit
- $36,080
- Equity at exit
- $15,131
Cash invested: $49,000 (down + closing). Projections, not guarantees.
Landlord ↔ Tenant lean methodology
- Overall (STATE)
- 62 Landlord-Friendly
- State Pennsylvania
- 62 Landlord-Friendly · EVEN
- County
- — inherits STATE
- City
- — inherits STATE
ZIP-level market 15235
- Home prices YoY
- -34.1%
- Rents YoY
- 7.6%
- Active inventory
- 129
- Price-to-rent
- 8.7×
Monthly cashflow live
- Estimated rent
- $1,674 high interval (Pro) →
- Mortgage (P&I)
- −$918
- Tax from tax record
- −$210 /mo · $2,518/yr
- Insurance
- −$73
- HOA
- −$0
- Vacancy / Maint / Mgmt
- −$351
- Net cashflow
- $122
Break-even live
Sensitivity live
| Price | -10% $221 | -5% $171 | +0% $122 | +5% $72 | +10% $23 |
|---|---|---|---|---|---|
| Rent | -10% $-11 | -5% $56 | +0% $122 | +5% $188 | +10% $254 |
| Rate | -1.0pp $210 | -0.5pp $166 | base $122 | +0.5pp $76 | +1.0pp $30 |
UW: 25.0% down · 7.5% · 30yr · 1.5% tax · 5.0% vac · 8.0% maint · 8.0% mgmt
Financing live
Cash to close
- Down payment
- $43,750
- Closing costs
- $5,250
- Reserves months
- —
- Total cash needed
- —
Loan-product check · same deal, 3 products live
Conventional
25% down · 7.5% · 30yr
- Down + closing
- —
- Monthly P&I
- —
- Monthly cashflow
- —
- DSCR
- —
- Eligible?
- —
Personal DTI + credit; lowest rate.
DSCR
20% down · 8.5% · 30yr
- Down + closing
- —
- Monthly P&I
- —
- Monthly cashflow
- —
- DSCR
- —
- Eligible?
- —
No personal income docs; deal must DSCR.
Hard money
10% down · 12.0% · 12mo
- Down + closing
- —
- Monthly P&I
- —
- Monthly cashflow
- —
- DSCR
- —
- Eligible?
- —
Short-term bridge; refi at stabilization.
Rent comps 10 comps
| Address | Beds | Baths | Sqft | Rent | $/sqft | DOM | Units | Dist |
|---|---|---|---|---|---|---|---|---|
| 175 Charleston Dr Pittsburgh, PA | 3.0 | 2.0 | 1163 | $1,799 | $1.55 | 25d | 1 | 0.09mi |
| 98 Stotler Rd Penn Hills, PA | 2.0–3.0 | 1.0 | 1660 | $1,400 | $0.84 | 9d | 3 | 0.26mi |
| 154 Collins Dr Pittsburgh, PA | 3.0 | 1.0 | 986 | $1,295 | $1.31 | 4d | 1 | 0.51mi |
| 279 Hazel Rd Pittsburgh, PA | 3.0 | 1.0 | 1080 | $1,732 | $1.60 | 45d | 1 | 0.61mi |
| 213 Tilford Rd Pittsburgh, PA | 4.0 | 1.5 | 1000 | $1,640 | $1.64 | 45d | 1 | 0.80mi |
| 261 Universal Rd Unit 261UNIV Pittsburgh, PA | 3.0 | 1.0 | 1100 | $1,225 | $1.11 | 5d | 1 | 0.80mi |
| 717 Jefferson Rd Pittsburgh, PA | 3.0 | 1.0 | 1152 | $1,295 | $1.12 | 16d | 1 | 0.84mi |
| 753 Jefferson Rd Pittsburgh, PA | 4.0 | 1.0 | 1152 | $1,350 | $1.17 | 6d | 1 | 0.87mi |
| 127 Stowe Dr Pittsburgh, PA | 3.0 | 1.0 | 948 | $1,495 | $1.58 | 23d | 1 | 0.93mi |
| 1160 Jefferson Rd Pittsburgh, PA | 3.0 | 1.0 | 1066 | $1,295 | $1.21 | 16d | 1 | 1.15mi |
Listing history 8 events
-
2026-06-05status $175,000 Pending 29 DOM
-
2026-06-03days on market $175,000 Contingent 29 DOM
-
2026-06-02days on market $175,000 Contingent 28 DOM
-
2026-06-01days on market $175,000 Contingent 27 DOM
-
2026-05-31days on market $175,000 Contingent 26 DOM
-
2026-05-12historical Contingent 648-char remark
-
2026-05-03$175,000 Active 648-char remark
-
2020-10-19soldstatus $90,000
ⓘ Source: listings_history table (triggers on properties + properties_extension) + one-shot
backfill from property_details.listing_events for pre-trigger history.
Tax reassessment forecast PA · Partial reset (capped growth)
- Current annual tax
- $2,518 · $210/mo
- Projected year-2 tax
- $2,642 · $220/mo
- Expected delta
- +$123/yr (+$10/mo · 4.9%)
ⓘ Screening estimate from a state-policy table — verify with the county assessor before closing.
Climate risk First Street
- Flood 1/10 Low FEMA zone X (unshaded) · 0% chance over 30 yrs
- Wildfire 1/10 Low
- Heat 3/10 Moderate 7 d/yr ≥96°F today · 17 d/yr by 30 yrs out
- Wind 2/10 Low 0% chance of damaging wind over 30 yrs
- Air quality 4/10 Moderate 5 unhealthy d/yr today · 7 by 30 yrs out
Nearby sold comps map
Loading sold comps map…
Walkable amenities ~0.75 mi
Loading nearby amenities…
Taxation est. · year 1
- Rental income
- $20,083
- − Mortgage interest
- −$9,803
- − Property taxes
- −$2,518
- − Insurance
- −$875
- − Repairs & maintenance
- −$1,607
- − Management
- −$1,607
- − Depreciation
- −$5,091
- Taxable loss
- −$1,417
- Est. tax savings @ 24.0%
- +$340
- After-tax cash flow
- $1,800/yr
For passive investors: Depreciation is non-cash, so a rental often shows a tax loss while cash-flowing — sheltering income. Rental losses are passive: they offset passive income freely, and up to $25,000/yr can offset ordinary (W-2) income if you actively participate and your MAGI is under $100k (phasing out to $0 by $150k); unused losses carry forward. On sale, claimed depreciation is recaptured at up to 25%, and gains may owe capital-gains tax (a 1031 exchange can defer both). Figures are a year-1 estimate at your 24.0% rate — not tax advice; consult a CPA.
Schools (NCES district)
- District
- Penn Hills SD
- NCES district ID
- 4218590
- Math proficiency
- 13% ▼ -6.00%
- Reading proficiency
- 24% ▼ -14.00%
- Median HH income
- $47,794
- Composite
- 16.42/100
- National rank
- #9192
- State rank
- #496 of 539 in PA
Livability — Penn Hills
No livability data for this city. (Only ~50 U.S. cities are tracked.)
Census & demographics
- County
- Allegheny County · 1,022,028 people
- Metro
- Pittsburgh, PA
- Population (ZIP)
- 33,951
- Household income
- $67,240
- Rent vs Own
- Severe rent burden
- 955.0
Population outlook (Allegheny County) Hauer SSP2
- Today (2025)
- 1,250,282 people
- By 2030
- 1,256,482 · +0.5%
- By 2040
- 1,256,318 · +0.5%
- By 2050
- 1,244,169 · -0.5%
- By 2075
- 1,197,693 · -4.2%
- By 2100
- 1,093,187 · -12.6%
Race, ethnicity, and origin ACS 2023
- Neighborhood character
- Diverse neighborhood (Simpson 0.58)
- Race & ethnicity
- White 51% Black 40% Two or more races 7% Hispanic / Latino 2%
- Common ancestry
- Romanian 5% Serbian 2% Slovak 1%
- Foreign-born
- 4% · Canada
- Languages at home
- 97% English-only · Other Indo-European 1% Spanish 1%
Political lean MEDSL · Allegheny
- 2024 margin
- Strong D (+20.3) · D 59.7% · R 39.4%
- 2008→2024 swing
- +4.8pp toward D · 2008: 15.5pp · 2024: 20.3pp
- All cycles
- 2024: D+20.3 2020: D+20.4 2016: D+16.4 2012: D+14.4 2008: D+15.5
Not yet ingested
- Civics
- —
Market trends
- HPI YoY
- ▼ -121.68%
- Current HPI
- 235.4861
- Rent YoY
- ▲ 7.63%
- Metro
- Pittsburgh, PA
- State GDP YoY
- ▲ 1.68%
- F500 in state
- 34
Industry mix (Fortune 500 HQ in PA)
| Industry | F500 HQs | Revenue |
|---|---|---|
| Healthcare | 2 | $309B |
|
||
| Insurance | 2 | $27B |
|
||
| Telecommunications / Media | 1 | $124B |
|
||
| Industrial Distribution | 1 | $22B |
|
||
| Financial Services | 1 | $20B |
|
||
| Chemicals / Materials | 1 | $18B |
|
||
Price history
+115.3% since first listed5 events — show timeline
- 2026-06-11 Sold (MLS) $193,750 West Penn MLS
- 2026-06-03 Pending — West Penn MLS
- 2026-05-12 Contingent — West Penn MLS
- 2026-05-03 Listed $175,000 West Penn MLS
- 2020-10-19 Sold (Public Records) $90,000 Public Records
Property tax history
+5.2%/yrLatest (2026): $2,518 · +0.0% YoY. Source: county tax records.
Cash-flow waterfall
monthlySold comps — $/sqft
last 12 mo · ≤1 miLoading sold comps…