 Duplex
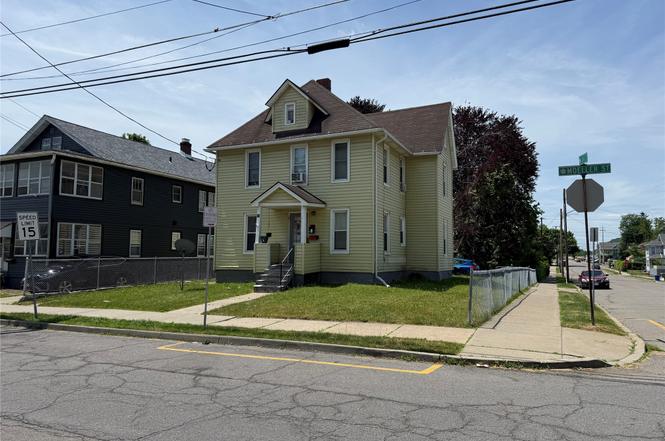
95 Moeller St · Binghamton, NY
Flood risk 6/10 · Moderate
- FEMA flood zone
- X
- Chance of flooding over 30 yrs
- 0.27%
- Est. flood insurance / yr
- $473 – $860
Fire risk 3/10 · Minor
- Est. fire insurance / yr
- $691 – $1,283
Heat risk 3/10 · Minor
- Hot days now (above 93°F)
- 8 days/yr
- Hot days in 30 yrs
- 17 days/yr
Wind risk 2/10 · Minimal
- Chance of severe wind over 30 yrs
- 1.0%
Air-quality risk 2/10 · Minimal
- Unhealthy air days now
- 0 days/yr
- Unhealthy air days in 30 yrs
- 1 days/yr
Risk factors via First Street. Map © Google.
Why this score? — see what drove the A- grade
The composite is a weighted blend of 9 inputs, each scored 0–100. Each bar is that input's sub-score; the figure is the points it added to the 100-point composite (weight × sub-score).
- Cash flow +30.0/30.0
- ARV discount +10.8/15.0
- 1% rule +10.0/10.0
- DSCR +10.0/10.0
- Appreciation +10.0/10.0
- Livability +3.9/5.0
- Schools +3.0/10.0
- Rent growth +2.5/5.0
- Condition / age +2.5/5.0
$125,000
🖨 Deal sheet (PDF) 📄 Offer letter ✓ Due diligence
Multi-family units
County records classify this as Multi-Family (2-4 Unit). Listing-text estimate: 2 units. confirmed
Listing remarks MLS
Great investment or owner occupy two family home conveniently located on Binghamton's East Side. Well kept with lots of improvements including some replacement windows, furnace, hot water heater and more. Fenced yard, off street parking and storage shed. Separate gas and electric meters.
Key facts
- 6,098 sq ft lot
- Built 1930
- Listed 6 days
Property features AI
Finance
- Other: Zoning: R1 & R2
- Financial info: Unit 1 rent: $750; Unit 2 rent: $500
Exterior
- Parking: On-street parking
- Security: No security features listed
- Utilities: Public water; Public sewer
- Home design: Residential income property (duplex)
- Construction: Aluminum siding
- Exterior features: Covered deck/patio; Level lot
Interior
- Kitchen: No specific kitchen appliances listed
- Bedrooms: Unit 1: 2 bedrooms; Unit 2: 1 bedroom
- Flooring: Carpet; Vinyl
- Bathrooms: Unit 1: 1 bathroom; Unit 2: 1 bathroom; Two full bathrooms total
- Heating & cooling: Forced air heating; No central cooling
- Interior features: Gas water heater; Carpet and vinyl flooring; Basement
- Laundry & utility: No laundry details provided
Neighborhood map
What this means for you Summary
Snapshot
- This is a 2 × 3-bed/1.0-bath units multifamily listed at $125k.
Deal economics
- At list price, monthly cash flow is $964 ($12k/yr) — positive. Per door: $482/mo.
- The deal already cash-flows at list — no discount required.
- Meets the 1% rule at list price ($3k rent vs $125k).
Location & tenants
- Location reads 78/100 on livability (#174 in NY, #2,710 nationally) — a middle-class / working-renter tenant base. Strengths: amenities A+, commute A+, cost of living A+; Watch: crime F, employment F.
- Binghamton City School District (urban): math 30% / reading 44% proficiency, ranked #557 of 590 in NY (top 94%) — families likely to look elsewhere, expect single-tenant / working-renter base with shorter leases; 61% free/reduced lunch — lower-income household profile, screen leases tightly.
- Zoned schools: Calvin Coolidge School (math 27% / reading 37%, grade F, #1,646 of 2,108 statewide, top 80%, 312 students, 72% FRL); Binghamton High School (math 71% / reading 79%, grade A-, #631 of 1,100 statewide, top 58%, 1,341 students, 69% FRL).
- Zoned-school proficiency averages 54% at this address vs 37% district-wide (+16 pts) — the actual schools serving this property are materially stronger than the Binghamton City School District average implies; a family-tenant draw the district grade alone would hide.
- Market conditions: 41 active listings in the ZIP; 6 comparable units currently listed for rent nearby; rentals lingering (median 46d on market — plan ~5-8 weeks vacancy on turnover, expect pricing pressure); 50% of comp listings sitting > 30 days — soft ceiling on asking rent; 340 units permitted in Broome County in 2024 (269 in 5+ unit buildings).
Forward outlook
- In year one you build about $13k of equity ($864 loan paydown + $12k appreciation (10.0% local appreciation)).
- Broome County population projected at -13% by 2050 — secular population decline; favor cash flow + early exit over multi-decade hold.
- At projected returns (10.0% appreciation + 3.0% rent growth), your $35k cash investment doubles in ~2 years — after that, you're playing with house money.
- By year 3, paydown + projected appreciation supports a ~$34k cash-out refi (75% LTV) — recoverable capital for the next deal without selling this one.
Negotiation context
- Only 6 days on market — expect competitive offers; lowballing is unlikely to land.
- 2 sale attempts since 6y ago with the ask held roughly flat each time — persistent listings suggest the price (not the market) is what's stuck; bring a comps-based counter.
- Current owner paid $59k; list at $125k implies a 112% gain — meaningful room to come down on a strong offer.
Risks & watch-outs
- Watch-outs: property tax is 3.7% of price; built in 1930 — expect roof / HVAC / electrical / plumbing capex.
- Climate carrying-cost: major flood risk — expect insurance premiums to compound above CPI over the hold.
Questions for the listing agent
- Can we see the unit-by-unit rent roll, current vacancy, and any below-market leases? What's the average tenancy length?
- What capital expenditures (roof, boiler, parking lot, exteriors) have been made in the last 5 years, and what's planned in the next 2?
- Built in 1930 — when were the roof, HVAC, electrical panel, plumbing, and water heater last replaced?
- Property tax is high relative to price — has the assessment been appealed recently, and will the sale trigger a re-assessment?
- Is there a deadline driving the sale (1031 exchange, divorce, estate, relocation)? That informs how much negotiation room exists.
- Schools are D-rated, which usually means shorter tenancies and higher turnover. Who's the typical renter profile here, and what's been the actual vacancy rate?
- Crime grade is F in this area — have there been break-ins, vandalism, or insurance claims at this property in the last 3 years? What carrier currently insures it and at what premium?
- What's the average days-on-market for RENTAL listings here right now (not sales)? A rising rental-DOM trend means longer vacancies and softer asking-rent achievability than the comps imply.
- What's the recent tenant-quality profile in this submarket — average credit score on applications, eviction rate, late-payment / NSF rate, and stable-employment percentage? A property-management company in the area should have these aggregated.
- How much new apartment / multifamily construction is in the pipeline within 1–3 miles? Heavy new supply (>2% of stock underway) typically softens rents 12–24 months out; light construction supports rent growth.
Investment metrics
- 1% rule
- 2.08% ✓
- Cap rate
- 15.55%
- Cash-on-cash
- 33.07%
- DSCR
- 2.47
- GRM
- 4.0
CMA / ARV
- ARV (on-the-fly)
- $134,862
- Comps found
- 3
Show comp detail 3 sales within ~0.75 mi
| Address | Dist | Beds/Ba | Sqft | Sold | Price | $/sf | Match |
|---|---|---|---|---|---|---|---|
| 23 Montgomery St | 0.50mi | 4/2.0 | 1,640 (+11%) | 7mo | $150,000 | $91 | 53 |
| 118 Liberty St | 0.67mi | 4/2.0 | 1,628 (+10%) | 21mo | $86,000 | $53 | 35 |
| 11 Yager St | 0.67mi | 5/3.0 (+1) | 1,600 (+8%) | 20mo | $155,000 | $97 | 30 |
Match score weights: distance 35% · size 25% · config 20% · recency 20%. Top-matched comps best support the ARV.
Projected returns pro-forma
10.0% appreciation · 3.0% rent growth · sell at horizon
- IRR
- 49.6%
- Equity multiple
- 4.71×
- Total profit
- $129,684
- Equity at exit
- $112,610
- IRR
- 43.3%
- Equity multiple
- 10.54×
- Total profit
- $333,945
- Equity at exit
- $242,848
Cash invested: $35,000 (down + closing). Projections, not guarantees.
Landlord ↔ Tenant lean methodology
- Overall (STATE)
- 15 Strongly Tenant-Friendly
- State New York
- 15 Strongly Tenant-Friendly · D+10
- County
- — inherits STATE
- City
- — inherits STATE
ZIP-level market 13904
- Home prices YoY
- 17.1%
- Active inventory
- 41
- Price-to-rent
- 8.0×
Monthly cashflow live
- Estimated rent
- $2,599 high interval (Pro) →
- Mortgage (P&I)
- −$656
- Tax from tax record
- −$381 /mo · $4,574/yr
- Insurance
- −$52
- HOA
- −$0
- Lot rent
- −$0
- Vacancy / Maint / Mgmt
- −$546
- Net cashflow
- $964
Break-even live
Sensitivity live
| Price | -10% $1,035 | -5% $1,000 | +0% $964 | +5% $929 | +10% $894 |
|---|---|---|---|---|---|
| Rent | -10% $759 | -5% $862 | +0% $964 | +5% $1,067 | +10% $1,170 |
| Rate | -1.0pp $1,027 | -0.5pp $996 | base $964 | +0.5pp $932 | +1.0pp $899 |
2-unit breakdown (identical units grouped — click to expand)
| Units | Beds | Baths | Est. rent |
|---|---|---|---|
| 2× units | 3 | 1 | $2,600 |
| #1 | 3 | 1 | $1,300 |
| #2 | 3 | 1 | $1,300 |
| Total (2 units) | $2,599 | ||
UW: 25.0% down · 7.5% · 30yr · 1.5% tax · 5.0% vac · 8.0% maint · 8.0% mgmt
Financing live
Cash to close
- Down payment
- $31,250
- Closing costs
- $3,750
- Reserves months
- —
- Total cash needed
- —
Loan-product check · same deal, 3 products live
Conventional
25% down · 7.5% · 30yr
- Down + closing
- —
- Monthly P&I
- —
- Monthly cashflow
- —
- DSCR
- —
- Eligible?
- —
Personal DTI + credit; lowest rate.
DSCR
20% down · 8.5% · 30yr
- Down + closing
- —
- Monthly P&I
- —
- Monthly cashflow
- —
- DSCR
- —
- Eligible?
- —
No personal income docs; deal must DSCR.
Hard money
10% down · 12.0% · 12mo
- Down + closing
- —
- Monthly P&I
- —
- Monthly cashflow
- —
- DSCR
- —
- Eligible?
- —
Short-term bridge; refi at stabilization.
Rent comps 6 comps
| Address | Beds | Baths | Sqft | Rent | $/sqft | DOM | Units | Dist |
|---|---|---|---|---|---|---|---|---|
| 528 Chenango St Unit 1 Binghamton, NY | 3.0 | 1.0 | 1250 | $1,500 | $1.20 | 15d | 1 | 0.86mi |
| 8 Roosevelt Ave Binghamton, NY | 3.0 | 1.0 | 1400 | $1,450 | $1.04 | 23d | 1 | 0.92mi |
| 8 Roosevelt Ave Unit 2 Binghamton, NY | 3.0 | 1.0 | 1400 | $1,500 | $1.07 | 46d | 1 | 0.92mi |
| 40 Fuller St Unit 40A Binghamton, NY | 3.0 | 2.0 | 1600 | $2,700 | $1.69 | 23d | 1 | 1.27mi |
| 136 Court St Unit 2 Binghamton, NY | 4.0 | 1.0 | 1373 | $3,000 | $2.18 | 46d | 1 | 1.42mi |
| 113 Hawley St Binghamton, NY | 4.0 | 1.5 | 1637 | $2,000 | $1.22 | 46d | 1 | 1.44mi |
Listing history 6 events
-
2026-06-21days on market $125,000 Active 6 DOM
-
2026-06-19days on market $125,000 Active 4 DOM
-
2026-06-18days on market $125,000 Active 3 DOM
-
2026-06-17days on market $125,000 Active 2 DOM
-
2026-06-15remarks 576-char remark
-
2026-06-15$125,000 Active 1 DOM
ⓘ Source: listings_history table (triggers on properties + properties_extension) + one-shot
backfill from property_details.listing_events for pre-trigger history.
Tax reassessment forecast NY · Partial reset (capped growth)
- Current annual tax
- $4,574 · $381/mo
- Projected year-2 tax
- $4,574 · $381/mo
- Expected delta
- $0/yr ($0/mo · 0.0%)
ⓘ Screening estimate from a state-policy table — verify with the county assessor before closing.
Climate risk First Street
- Flood 6/10 Major FEMA zone X · 27% chance over 30 yrs
- Wildfire 3/10 Moderate
- Heat 3/10 Moderate 8 d/yr ≥93°F today · 17 d/yr by 30 yrs out
- Wind 2/10 Low 100% chance of damaging wind over 30 yrs
- Air quality 2/10 Low 0 unhealthy d/yr today · 1 by 30 yrs out
Nearby sold comps map
Loading sold comps map…
Walkable amenities ~0.75 mi
Loading nearby amenities…
Taxation est. · year 1
- Rental income
- $31,188
- − Mortgage interest
- −$7,002
- − Property taxes
- −$4,574
- − Insurance
- −$625
- − Repairs & maintenance
- −$2,495
- − Management
- −$2,495
- − Depreciation
- −$3,636
- Taxable income
- $10,361
- Est. tax owed @ 24.0%
- −$2,487
- After-tax cash flow
- $9,087/yr
For passive investors: Depreciation is non-cash, so a rental often shows a tax loss while cash-flowing — sheltering income. Rental losses are passive: they offset passive income freely, and up to $25,000/yr can offset ordinary (W-2) income if you actively participate and your MAGI is under $100k (phasing out to $0 by $150k); unused losses carry forward. On sale, claimed depreciation is recaptured at up to 25%, and gains may owe capital-gains tax (a 1031 exchange can defer both). Figures are a year-1 estimate at your 24.0% rate — not tax advice; consult a CPA.
Schools (NCES district)
- District
- Binghamton City School District
- NCES district ID
- 3604870
- Math proficiency
- 30% ▬ 0.00%
- Reading proficiency
- 44% ▲ 15.00%
- Median HH income
- $30,475
- Composite
- 30.09/100
- National rank
- #6342
- State rank
- #557 of 590 in NY
Livability — Binghamton
- Score
- 78/100
- State rank
- #174
- US rank
- #2710
Category grades
Schools grade is shown separately in the Schools card above.
Census & demographics
- Census place
- Binghamton, NY
- City population
- 65,170
- Population (ZIP)
- 9,138
Population outlook (Broome County) Hauer SSP2
- Today (2025)
- 187,989 people
- By 2030
- 183,066 · -2.6%
- By 2040
- 172,228 · -8.4%
- By 2050
- 163,161 · -13.2%
- By 2075
- 153,641 · -18.3%
- By 2100
- 140,851 · -25.1%
Race, ethnicity, and origin ACS 2023
- Neighborhood character
- Predominantly White (73%)
- Race & ethnicity
- White 73% Black 12% Hispanic / Latino 8% Two or more races 5% Asian 3%
- Hispanic origin (detail)
- Puerto Rican 5%
- Common ancestry
- Hispanic 8% Romanian 3% Slovak 2%
- Foreign-born
- 9% · Canada, China
- Languages at home
- 87% English-only · French/Haitian/Cajun 5% Spanish 4% Chinese 2%
Political lean MEDSL · Broome
- 2024 margin
- Toss-up / Even · D 50.2% · R 49.8%
- 2008→2024 swing
- -7.6pp toward R · 2008: 8.0pp · 2024: 0.4pp
- All cycles
- 2024: D+0.4 2020: D+3.5 2016: R+3.7 2012: D+4.6 2008: D+8.0
Not yet ingested
- Civics
- —
Market trends
- HPI YoY
- ▲ 40.85%
- Current HPI
- 280.3184
- Rent YoY
- —
- Metro
- —
- State GDP YoY
- ▲ 2.60%
- F500 in state
- 92
Industry mix (Fortune 500 HQ in NY)
| Industry | F500 HQs | Revenue |
|---|---|---|
| Financial Services | 10 | $950B |
|
||
| Consumer Goods | 9 | $162B |
|
||
| Insurance | 4 | $225B |
|
||
| Telecommunications | 2 | $144B |
|
||
| Pharmaceuticals | 2 | $112B |
|
||
| Media / Entertainment | 2 | $69B |
|
||
Price history
+81.2% since first listed3 events — show timeline
- 2026-06-15 Listed $125,000 GBAOR
- 2021-01-15 Sold (MLS) $59,000 GBAOR
- 2020-06-03 Listed $69,000 GBAOR
Property tax history
+4.7%/yrLatest (2025): $4,574 · +0.9% YoY. Source: county tax records.
Cash-flow waterfall
monthlySold comps — $/sqft
last 12 mo · ≤1 miLoading sold comps…