 Multi-family
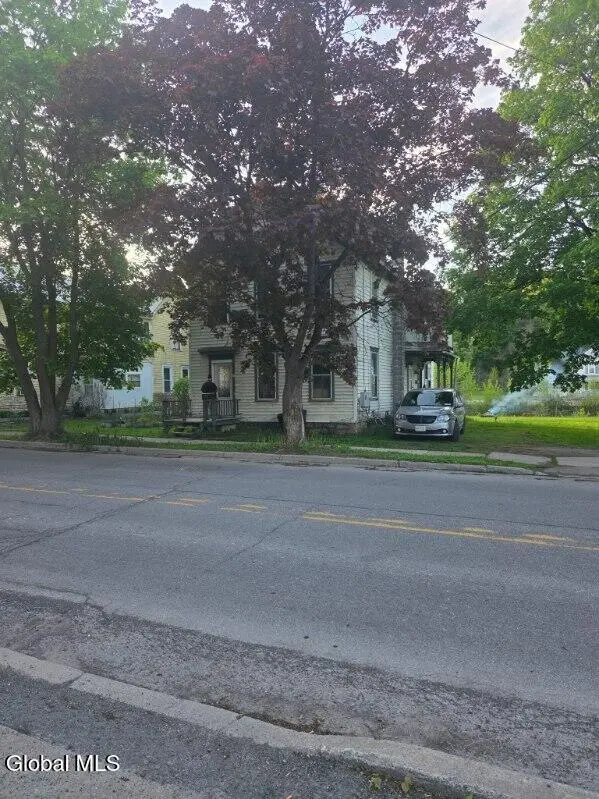
88 Reid St · Fort Plain, NY
Flood risk 8/10 · Major
- FEMA flood zone
- AE
- Chance of flooding over 30 yrs
- 0.99%
- Est. flood insurance / yr
- $2,026 – $9,024
Fire risk 1/10 · Minimal
- Est. fire insurance / yr
- $691 – $1,283
Heat risk 3/10 · Minor
- Hot days now (above 96°F)
- 7 days/yr
- Hot days in 30 yrs
- 16 days/yr
Wind risk 2/10 · Minimal
- Chance of severe wind over 30 yrs
- 2.0%
Air-quality risk 1/10 · Minimal
- Unhealthy air days now
- 0 days/yr
- Unhealthy air days in 30 yrs
- 0 days/yr
Risk factors via First Street. Map © Google.
Why this score? — see what drove the A grade
The composite is a weighted blend of 9 inputs, each scored 0–100. Each bar is that input's sub-score; the figure is the points it added to the 100-point composite (weight × sub-score).
- Cash flow +30.0/30.0
- ARV discount +15.0/15.0
- 1% rule +10.0/10.0
- DSCR +10.0/10.0
- Appreciation +7.6/10.0
- Schools +4.2/10.0
- Livability +3.6/5.0
- Rent growth +2.5/5.0
- Condition / age +2.5/5.0
$39,000
🖨 Deal sheet 📄 Offer letter ✓ Due diligence
Multi-family units
County records classify this as Multi-Family (2-4 Unit). Listing-text estimate: 1 unit. estimate disagrees with records
Listing remarks MLS
This house is in need of some TLC to return to its former beauty. Priced to sell, this home offers the opportunity to live rent free or generate passive income. If you are in the market for a home this house is screaming potential. This home offers 4 bedroom and 2 bath and is zoned for a 2 family if you ever wanted to convert it back to generate more income or have it pay for itself. Bank owned property and sold as-is. Poor Condition
Key facts
- 0.25 acre lot
- Parking
- Built 1900
Property features AI
Exterior
- Parking: Two parking spaces
- Utilities: Public water; Public sewer
- Home design: Single family residence; Fixer condition
- Construction: Wood siding construction
- Exterior features: Level lot
Interior
- Kitchen: Kitchen on the first floor
- Bedrooms: Four bedrooms located on the second floor
- Flooring: Vinyl flooring throughout
- Bathrooms: Two full bathrooms (one on the first floor, one on the second floor)
- Heating & cooling: Natural gas heating
- Interior features: Unfinished basement; Seven total rooms; Vinyl flooring
Neighborhood map
What this means for you Summary
Snapshot
- This is a 4-bed/2.0-bath multifamily listed at $39k.
Deal economics
- At list price, monthly cash flow is $161 ($2k/yr) — positive.
- The deal already cash-flows at list — no discount required.
- Meets the 1% rule at list price ($1k rent vs $39k).
Location & tenants
- Location reads 72/100 on livability (#374 in NY) — a middle-class / working-renter tenant base. Strengths: cost of living A+, health & safety A+, crime B+; Watch: schools D, commute F, employment F.
- Fort Plain Central School District (rural): math 43% / reading 57% proficiency, ranked #401 of 590 in NY (top 68%) — acceptable for families but not a draw, mixed tenant base, ~2y average lease.
- Market conditions: 41 active listings in the ZIP; 210 units permitted in Montgomery County in 2024 (168 in 5+ unit buildings).
Forward outlook
- In year one you build about $2k of equity ($270 loan paydown + $2k appreciation (5.2% local appreciation)).
- Montgomery County population projected at -11% by 2050 — secular population decline; favor cash flow + early exit over multi-decade hold.
- At projected returns (5.2% appreciation + 3.0% rent growth), your $11k cash investment doubles in ~3 years — after that, you're playing with house money.
Negotiation context
- Only 8 days on market — expect competitive offers; lowballing is unlikely to land.
- 4 sale attempts since 10y ago with the ask held roughly flat each time — persistent listings suggest the price (not the market) is what's stuck; bring a comps-based counter.
- Current owner paid $10k; list at $39k implies a 306% gain — meaningful room to come down on a strong offer.
Risks & watch-outs
- Watch-outs: property tax is 3.3% of price; flood insurance adds $460/mo; built in 1900 — expect roof / HVAC / electrical / plumbing capex.
- Climate carrying-cost: in FEMA flood zone AE (mandatory federal flood insurance) — expect insurance premiums to compound above CPI over the hold.
Questions for the listing agent
- Built in 1900 — when were the roof, HVAC, electrical panel, plumbing, and water heater last replaced?
- Property tax is high relative to price — has the assessment been appealed recently, and will the sale trigger a re-assessment?
- What's the actual annual flood-insurance premium (NFIP or private), and is the property in a SFHA with mandatory coverage?
- Is there a deadline driving the sale (1031 exchange, divorce, estate, relocation)? That informs how much negotiation room exists.
- Schools are D-rated, which usually means shorter tenancies and higher turnover. Who's the typical renter profile here, and what's been the actual vacancy rate?
- What's the average days-on-market for RENTAL listings here right now (not sales)? A rising rental-DOM trend means longer vacancies and softer asking-rent achievability than the comps imply.
- What's the recent tenant-quality profile in this submarket — average credit score on applications, eviction rate, late-payment / NSF rate, and stable-employment percentage? A property-management company in the area should have these aggregated.
- How much new apartment / multifamily construction is in the pipeline within 1–3 miles? Heavy new supply (>2% of stock underway) typically softens rents 12–24 months out; light construction supports rent growth.
Investment metrics
- 1% rule
- 3.09% ✓
- Cap rate
- 25.42%
- Cash-on-cash
- 68.30%
- DSCR
- 4.04
- GRM
- 2.7
CMA / ARV
- ARV (on-the-fly)
- $62,248
- Comps found
- 1
Show comp detail 1 sale within ~0.75 mi
| Address | Dist | Beds/Ba | Sqft | Sold | Price | $/sf | Match |
|---|---|---|---|---|---|---|---|
| 62 Division St | 0.42mi | 3/2.5 (-1) | 2,121 (+6%) | 8mo | $65,000 | $31 | 58 |
Match score weights: distance 35% · size 25% · config 20% · recency 20%. Top-matched comps best support the ARV.
Projected returns pro-forma
5.24% appreciation · 3.0% rent growth · sell at horizon
- IRR
- 29.1%
- Equity multiple
- 2.84×
- Total profit
- $20,118
- Equity at exit
- $22,666
- IRR
- 27.9%
- Equity multiple
- 5.79×
- Total profit
- $52,358
- Equity at exit
- $39,593
Cash invested: $10,920 (down + closing). Projections, not guarantees.
Landlord ↔ Tenant lean methodology
- Overall (STATE)
- 15 Strongly Tenant-Friendly
- State New York
- 15 Strongly Tenant-Friendly · D+10
- County
- — inherits STATE
- City
- — inherits STATE
ZIP-level market 13339
- Home prices YoY
- 1.7%
- Active inventory
- 41
- Price-to-rent
- 2.7×
Monthly cashflow live
- Estimated rent
- $1,204 medium interval (Pro) →
- Mortgage (P&I)
- −$205
- Tax from tax record
- −$109 /mo · $1,304/yr
- Insurance
- −$16
- Flood insurance flood zone
- −$460 /mo · $5,525/yr
- HOA
- −$0
- Vacancy / Maint / Mgmt
- −$253
- Net cashflow
- $161
Break-even live
UW: 25.0% down · 7.5% · 30yr · 1.5% tax · 5.0% vac · 8.0% maint · 8.0% mgmt
Financing live
Cash to close
- Down payment
- $9,750
- Closing costs
- $1,170
- Reserves months
- —
- Total cash needed
- —
Loan-product check · same deal, 3 products live
Conventional
25% down · 7.5% · 30yr
- Down + closing
- —
- Monthly P&I
- —
- Monthly cashflow
- —
- DSCR
- —
- Eligible?
- —
Personal DTI + credit; lowest rate.
DSCR
20% down · 8.5% · 30yr
- Down + closing
- —
- Monthly P&I
- —
- Monthly cashflow
- —
- DSCR
- —
- Eligible?
- —
No personal income docs; deal must DSCR.
Hard money
10% down · 12.0% · 12mo
- Down + closing
- —
- Monthly P&I
- —
- Monthly cashflow
- —
- DSCR
- —
- Eligible?
- —
Short-term bridge; refi at stabilization.
Listing history 9 events
-
2026-06-18days on market $39,000 Active 8 DOM
-
2026-06-17days on market $39,000 Active 7 DOM
-
2026-06-16days on market $39,000 Active 6 DOM
-
2026-06-15days on market $39,000 Active 5 DOM
-
2026-06-13days on market $39,000 Active 3 DOM
-
2026-06-12remarks 699-char remark
-
2026-06-12days on market $39,000 Active 2 DOM
-
2026-06-09remarks 481-char remark
-
2026-06-09$39,000 Active 1 DOM
ⓘ Source: listings_history table (triggers on properties + properties_extension) + one-shot
backfill from property_details.listing_events for pre-trigger history.
Tax reassessment forecast NY · Partial reset (capped growth)
- Current annual tax
- $1,304 · $109/mo
- Projected year-2 tax
- $1,304 · $109/mo
- Expected delta
- $0/yr ($0/mo · 0.0%)
ⓘ Screening estimate from a state-policy table — verify with the county assessor before closing.
Climate risk First Street
- Flood 8/10 Severe FEMA zone AE · 99% chance over 30 yrs
- Wildfire 1/10 Low
- Heat 3/10 Moderate 7 d/yr ≥96°F today · 16 d/yr by 30 yrs out
- Wind 2/10 Low 2% chance of damaging wind over 30 yrs
- Air quality 1/10 Low 0 unhealthy d/yr today · 0 by 30 yrs out
Nearby sold comps map
Loading sold comps map…
Walkable amenities ~0.75 mi
Loading nearby amenities…
Taxation est. · year 1
- Rental income
- $14,445
- − Mortgage interest
- −$2,185
- − Property taxes
- −$1,304
- − Insurance
- −$5,720
- − Repairs & maintenance
- −$1,156
- − Management
- −$1,156
- − Depreciation
- −$1,135
- Taxable income
- $1,791
- Est. tax owed @ 24.0%
- −$430
- After-tax cash flow
- $1,503/yr
For passive investors: Depreciation is non-cash, so a rental often shows a tax loss while cash-flowing — sheltering income. Rental losses are passive: they offset passive income freely, and up to $25,000/yr can offset ordinary (W-2) income if you actively participate and your MAGI is under $100k (phasing out to $0 by $150k); unused losses carry forward. On sale, claimed depreciation is recaptured at up to 25%, and gains may owe capital-gains tax (a 1031 exchange can defer both). Figures are a year-1 estimate at your 24.0% rate — not tax advice; consult a CPA.
Schools (NCES district)
- District
- Fort Plain Central School District
- NCES district ID
- 3611370
- Math proficiency
- 43% ▲ 4.00%
- Reading proficiency
- 57% ▲ 18.00%
- Median HH income
- $41,754
- Composite
- 41.94/100
- National rank
- #3352
- State rank
- #401 of 590 in NY
Livability — Fort Plain
- Score
- 72/100
- State rank
- #374
- US rank
- #6455
Category grades
Schools grade is shown separately in the Schools card above.
Census & demographics
- Census place
- Fort Plain, NY
- Population (ZIP)
- 6,131
Population outlook (Montgomery County) Hauer SSP2
- Today (2025)
- 48,683 people
- By 2030
- 47,785 · -1.8%
- By 2040
- 45,492 · -6.6%
- By 2050
- 43,161 · -11.3%
- By 2075
- 38,134 · -21.7%
- By 2100
- 32,337 · -33.6%
Race, ethnicity, and origin ACS 2023
- Neighborhood character
- Predominantly White (93%)
- Race & ethnicity
- White 93% Hispanic / Latino 3% Two or more races 3%
- Common ancestry
- Iranian 10% Lithuanian 9% Romanian 5%
- Foreign-born
- 1%
- Languages at home
- 96% English-only · German/W. Germanic 2% Spanish 2% Other Indo-European 1%
Political lean MEDSL · Montgomery
- 2024 margin
- Strong R (+28.7) · D 35.6% · R 64.4%
- 2008→2024 swing
- -20.6pp toward R · 2008: -8.1pp · 2024: -28.7pp
- All cycles
- 2024: R+28.7 2020: R+22.6 2016: R+26.5 2012: R+4.4 2008: R+8.1
Not yet ingested
- Civics
- —
Market trends
- HPI YoY
- ▲ 5.24%
- Current HPI
- 320.8989
- Rent YoY
- —
- Metro
- —
- State GDP YoY
- ▲ 2.60%
- F500 in state
- 92
Industry mix (Fortune 500 HQ in NY)
| Industry | F500 HQs | Revenue |
|---|---|---|
| Financial Services | 10 | $950B |
|
||
| Consumer Goods | 9 | $162B |
|
||
| Insurance | 4 | $225B |
|
||
| Telecommunications | 2 | $144B |
|
||
| Pharmaceuticals | 2 | $112B |
|
||
| Media / Entertainment | 2 | $69B |
|
||
Price history
+116.7% since first listed16 events — show timeline
- 2026-06-09 Listed $39,000 Global MLS
- 2019-05-21 Sold (MLS) $9,600 Global MLS
- 2019-03-28 Pending — Global MLS
- 2019-01-24 Price Changed $9,600 Global MLS
- 2019-01-03 Listed $10,000 Global MLS
- 2019-01-02 Listing Removed — Global MLS
- 2018-12-28 Price Changed $10,000 Global MLS
- 2018-11-30 Price Changed $10,500 Global MLS
- 2018-11-14 Price Changed $11,500 Global MLS
- 2018-10-01 Listed $12,000 Global MLS
- 2017-05-10 Listing Removed — Global MLS
- 2016-05-11 Listed $19,500 Global MLS
- 2012-05-10 Sold (Public Records) $14,597 Public Records
- 2002-07-31 Sold (Public Records) $26,900 Public Records
- 2002-07-31 Sold (Public Records) $18,000 Public Records
- 1995-06-28 Sold (Public Records) $18,000 Public Records
Property tax history
+0.2%/yrLatest (2025): $1,304 · +4.6% YoY. Source: county tax records.
Cash-flow waterfall
monthlySold comps — $/sqft
last 12 mo · ≤1 miLoading sold comps…