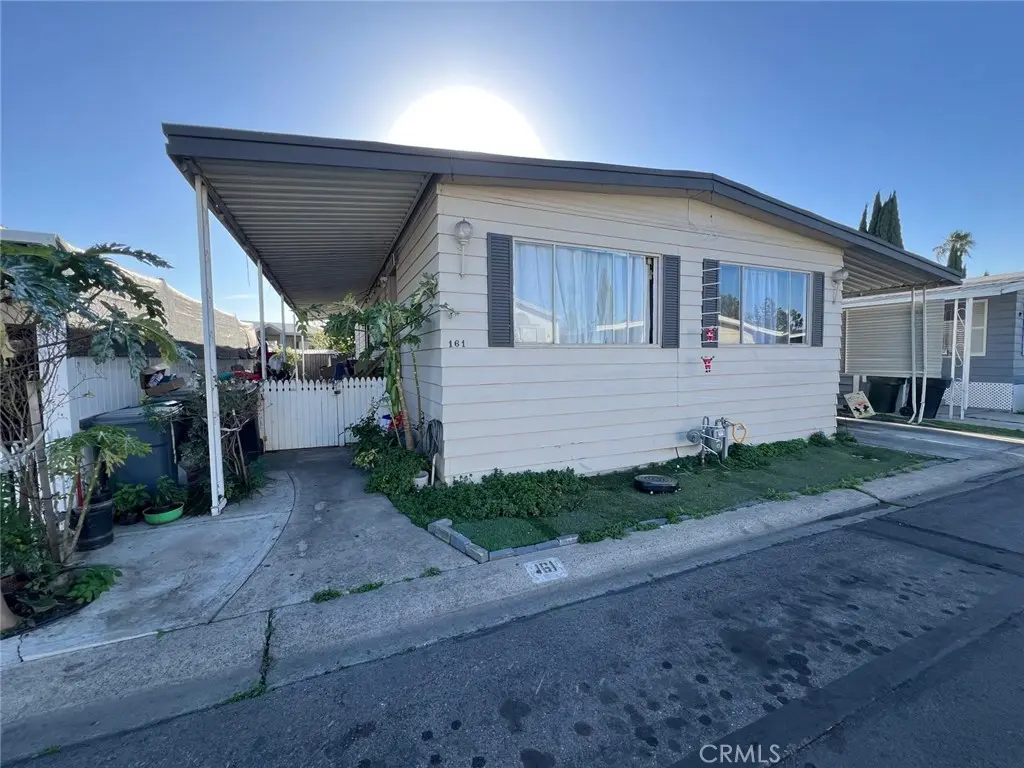
320 N Park Vista St #161 · Anaheim, CA
Flood risk 1/10 · Minimal
- FEMA flood zone
- X (shaded)
- Chance of flooding over 30 yrs
- 0.0%
- Est. flood insurance / yr
- $507 – $1,088
Fire risk 1/10 · Minimal
- Est. fire insurance / yr
- $659 – $1,223
Heat risk 6/10 · Moderate
- Hot days now (above 94°F)
- 7 days/yr
- Hot days in 30 yrs
- 21 days/yr
Wind risk 1/10 · Minimal
- Chance of severe wind over 30 yrs
- —
Air-quality risk 6/10 · Moderate
- Unhealthy air days now
- 12 days/yr
- Unhealthy air days in 30 yrs
- 13 days/yr
Risk factors via First Street. Map © Google.
Why this score? — see what drove the B+ grade
The composite is a weighted blend of 9 inputs, each scored 0–100. Each bar is that input's sub-score; the figure is the points it added to the 100-point composite (weight × sub-score).
- Cash flow +30.0/30.0
- ARV discount +12.3/15.0
- 1% rule +10.0/10.0
- DSCR +10.0/10.0
- Schools +5.2/10.0
- Livability +3.5/5.0
- Condition / age +2.5/5.0
- Rent growth +2.3/5.0
- Appreciation +0.0/10.0
$139,900
🖨 Deal sheet (PDF) 📄 Offer letter ✓ Due diligence
Listing remarks MLS
Don't miss this amazing opportunity! This home features 4 bedrooms and 2 baths and parking for up to 4 cars. Situated in a welcoming, family- and pet-friendly community, you'll have access to fantastic amenities such as a large swimming pool, a clubhouse perfect for gatherings, an enclosed spa, and a playground. The location is unbeatable, near the Orange/Anaheim city border, close to shopping, dining, schools, and major attractions like Disneyland, Honda Center, Angel Stadium, and with easy access to the 57 and 91 freeways.
Key facts
- Near dining
- Clubhouse
- Near shopping
Tags
Neighborhood map
What this means for you Summary
Snapshot
- This is a 4-bed/2.0-bath manufactured listed at $140k.
Deal economics
- At list price, monthly cash flow is $2k ($25k/yr) — positive.
- The deal already cash-flows at list — no discount required.
- Meets the 1% rule at list price ($4k rent vs $140k).
- Recommended offer: $123k (12.0% below list) — sets the bar for market timing.
- Cap rate 24.4% vs local median 2.1% in Anaheim — top-decile yield for the area; either an underpriced asset or a hidden risk that comps aren't pricing in. Stress-test before assuming the spread holds.
Location & tenants
- Location reads 70/100 on livability (#240 in CA) — a middle-class / working-renter tenant base. Strengths: amenities A+, commute A+, employment A+; Watch: health & safety C-, crime F, cost of living F.
- Placentia-Yorba Linda Unified (suburban): math 48% / reading 66% proficiency, ranked #78 of 517 in CA (top 15%) — acceptable for families but not a draw, mixed tenant base, ~2y average lease.
- Zoned schools: Rio Vista Elementary (699 students, 84% FRL); Valadez Middle School Academy (math 75% / reading 75%, grade A, #25 of 498 statewide, top 6%, 621 students, 93% FRL); Valencia High (math 49% / reading 70%, grade C+, #205 of 1,170 statewide, top 19%, 2,543 students, 68% FRL) — zoned schools average 82% FRL vs 28% district-wide (54 pts higher); higher-poverty schools than district average — tighter screening recommended.
- Market conditions: Rents soft (-0.8%/yr); 41 active listings in the ZIP; 15 comparable units currently listed for rent nearby; rentals at typical pace (median 21d on market — plan ~3-4 weeks tenant-placement turnaround); solid renter incomes; 6,974 units permitted in Orange County in 2024 (3,839 in 5+ unit buildings).
- At $3,892/mo this rent would consume 48% of the median local household income ($97k/yr) (locally 2171% of renters already pay >50% of income on rent) — very limited rent-growth headroom before tenants either downsize or default.
Forward outlook
- Local home prices are declining (-3.0%/yr); year-one equity from $967 of loan paydown is wiped out by about $4k of value loss. Plan a longer hold.
- Orange County population projected at +14% by 2050 — modest demand growth; plan on rents tracking national, not racing it.
- At projected returns (-3.0% appreciation + 0.0% rent growth), your $39k cash investment doubles in ~2 years — after that, you're playing with house money.
Negotiation context
- It's been on market 131 days — a 12% lower offer ($123k) is reasonable based on typical stale-listing flexibility.
- 14 sale attempts since 5y ago with the ask held roughly flat each time — persistent listings suggest the price (not the market) is what's stuck; bring a comps-based counter.
Risks & watch-outs
- Climate carrying-cost: extreme-heat days projected 7→21/yr by 2055 (HVAC capex compounding) — expect insurance premiums to compound above CPI over the hold.
Questions for the listing agent
- It's been on market 131 days. Have you received any prior offers? Is the seller open to a 12% concession, seller financing, or rate buy-down credit?
- Built in 1972 — when were the roof, HVAC, electrical panel, plumbing, and water heater last replaced?
- Why hasn't it sold? Are there any deal-killer items the seller is aware of (foundation, flood, title, zoning, code violations)?
- Is there a deadline driving the sale (1031 exchange, divorce, estate, relocation)? That informs how much negotiation room exists.
- Crime grade is F in this area — have there been break-ins, vandalism, or insurance claims at this property in the last 3 years? What carrier currently insures it and at what premium?
- What's the average days-on-market for RENTAL listings here right now (not sales)? A rising rental-DOM trend means longer vacancies and softer asking-rent achievability than the comps imply.
- What's the recent tenant-quality profile in this submarket — average credit score on applications, eviction rate, late-payment / NSF rate, and stable-employment percentage? A property-management company in the area should have these aggregated.
- How much new for-sale + rental construction is in the pipeline within 1–3 miles? Heavy new supply typically softens prices + rents 12–24 months out; constrained supply supports both.
Investment metrics
- 1% rule
- 2.78% ✓
- Cap rate
- 24.38%
- Cash-on-cash
- 64.58%
- DSCR
- 3.87
- GRM
- 3.0
CMA / ARV
- ARV (median comp)
- $156,568
- List price
- $139,900
- Delta
- -10.65%
- Verdict
- UNDERPRICED
- Comps
- 5 within 1.0 mi
Show comp detail 9 sales within ~0.75 mi
| Address | Dist | Beds/Ba | Sqft | Sold | Price | $/sf | Match |
|---|---|---|---|---|---|---|---|
| 320 N Park Vista St | 0.03mi | 4/2.0 | 1,344 (-2%) | 10mo | $159,000 | $118 | 88 |
| 320 N Park Vista St #28 | 0.03mi | 4/2.0 | 1,440 (+5%) | 3mo | $135,000 | $94 | 87 |
| 320 N Park Vista St #21 | 0.00mi | 3/2.0 (-1) | 1,456 (+6%) | 1mo | $165,000 | $113 | 84 |
| 320 N Park Vista St #126 | 0.09mi | 4/2.0 | 1,296 (-5%) | 23mo | $135,000 | $104 | 68 |
| 320 N Park Vista St #160 | 0.00mi | 3/2.0 (-1) | 1,464 (+7%) | 19mo | $160,000 | $109 | 68 |
| 320 N Park Vista St #26 | 0.00mi | 3/2.0 (-1) | 1,444 (+6%) | 22mo | $155,000 | $107 | 67 |
| 320 N Park Vista St Unit 52D | 0.00mi | 3/2.0 (-1) | 1,536 (+12%) | 10mo | $130,000 | $85 | 66 |
| 320 N Park Vista St #12 | 0.00mi | 4/2.0 | 1,536 (+12%) | 22mo | $158,000 | $103 | 61 |
| 320 N Park Vista St #103 | 0.09mi | 3/2.0 (-1) | 1,516 (+11%) | 15mo | $240,000 | $158 | 60 |
Match score weights: distance 35% · size 25% · config 20% · recency 20%. Top-matched comps best support the ARV.
Projected returns pro-forma
-3.0% appreciation · 0.0% rent growth · sell at horizon
- IRR
- 60.3%
- Equity multiple
- 3.56×
- Total profit
- $100,253
- Equity at exit
- $20,860
- IRR
- 63.9%
- Equity multiple
- 6.52×
- Total profit
- $216,349
- Equity at exit
- $12,096
Cash invested: $39,172 (down + closing). Projections, not guarantees.
Landlord ↔ Tenant lean methodology
- Overall (STATE)
- 18 Strongly Tenant-Friendly
- State California
- 18 Strongly Tenant-Friendly · D+13
- County
- — inherits STATE
- City
- — inherits STATE
ZIP-level market 92806
- Rents YoY
- -0.8%
- Active inventory
- 41
- Price-to-rent
- 3.0×
Monthly cashflow live
- Estimated rent
- $3,892 high interval (Pro) →
- Mortgage (P&I)
- −$734
- Tax est. 1.5%
- −$175 /mo · $2,098/yr
- Insurance
- −$58
- HOA
- −$0
- Vacancy / Maint / Mgmt
- −$817
- Net cashflow
- $2,108
Break-even live
Sensitivity live
| Price | -10% $2,205 | -5% $2,157 | +0% $2,108 | +5% $2,060 | +10% $2,012 |
|---|---|---|---|---|---|
| Rent | -10% $1,801 | -5% $1,954 | +0% $2,108 | +5% $2,262 | +10% $2,416 |
| Rate | -1.0pp $2,179 | -0.5pp $2,144 | base $2,108 | +0.5pp $2,072 | +1.0pp $2,035 |
UW: 25.0% down · 7.5% · 30yr · 1.5% tax · 5.0% vac · 8.0% maint · 8.0% mgmt
Financing live
Cash to close
- Down payment
- $34,975
- Closing costs
- $4,197
- Reserves months
- —
- Total cash needed
- —
Loan-product check · same deal, 3 products live
Conventional
25% down · 7.5% · 30yr
- Down + closing
- —
- Monthly P&I
- —
- Monthly cashflow
- —
- DSCR
- —
- Eligible?
- —
Personal DTI + credit; lowest rate.
DSCR
20% down · 8.5% · 30yr
- Down + closing
- —
- Monthly P&I
- —
- Monthly cashflow
- —
- DSCR
- —
- Eligible?
- —
No personal income docs; deal must DSCR.
Hard money
10% down · 12.0% · 12mo
- Down + closing
- —
- Monthly P&I
- —
- Monthly cashflow
- —
- DSCR
- —
- Eligible?
- —
Short-term bridge; refi at stabilization.
Rent comps 15 comps
| Address | Beds | Baths | Sqft | Rent | $/sqft | DOM | Units | Dist |
|---|---|---|---|---|---|---|---|---|
| 449 N Via Napoli Anaheim, CA | 3.0 | 1.5 | 1266 | $3,445 | $2.72 | 12d | 1 | 0.27mi |
| 3004 E Via Bruno Anaheim, CA | 3.0 | 1.5 | 1180 | $3,350 | $2.84 | 26d | 1 | 0.33mi |
| 203 N Royal Pl Anaheim, CA | 3.0 | 2.0 | 1600 | $3,995 | $2.50 | 0d | 1 | 0.52mi |
| 3061 N Juneberry St Orange, CA | 4.0 | 2.5 | 1814 | $4,200 | $2.32 | 45d | 1 | 0.71mi |
| 2539 E Seville Ave Anaheim, CA | 4.0 | 2.5 | 1628 | $4,195 | $2.58 | 0d | 1 | 0.80mi |
| 2550 E Ward Ter Anaheim, CA | 1.0–3.0 | 1.0–1.5 | 1075 | $3,620 | $3.37 | 0d | 13 | 0.85mi |
| 2990 N Rippling Creek Dr Orange, CA | 3.0 | 2.0 | 1549 | $4,500 | $2.91 | 20d | 1 | 0.90mi |
| 2450 E Agave St Unit 1 Anaheim, CA | 3.0 | 2.5 | 1394 | $3,900 | $2.80 | 0d | 1 | 1.03mi |
| 2650 E Park Ln Apt A Anaheim, CA | 3.0 | 2.0 | 1100 | $3,200 | $2.91 | 45d | 1 | 1.04mi |
| 2420 E Lincoln Ave #3 Anaheim, CA | 4.0 | 3.5 | 1827 | $4,500 | $2.46 | 21d | 1 | 1.06mi |
| 709 E Meadowbrook Ave Orange, CA | 4.0 | 2.0 | 1689 | $5,000 | $2.96 | 20d | 1 | 1.12mi |
| 1017 Avenue De Pio Pico Unit 1017 Placentia, CA | 3.0 | 2.0 | 1400 | $3,695 | $2.64 | 45d | 1 | 1.14mi |
| 940 Cypress Ave Placentia, CA | 3.0 | 2.0 | 1644 | $3,900 | $2.37 | 19d | 1 | 1.23mi |
| 16572 E Buena Vista Ave Orange, CA | 3.0 | 2.0 | 1500 | $5,500 | $3.67 | 0d | 1 | 1.33mi |
| 3092 N Skywood St Orange, CA | 3.0 | 2.0 | 1531 | $4,395 | $2.87 | 45d | 1 | 1.37mi |
Listing history 36 events
-
2026-06-21days on market $139,900 Active 131 DOM
-
2026-06-18days on market $139,900 Active 128 DOM
-
2026-06-17days on market $139,900 Active 127 DOM
-
2026-06-16days on market $139,900 Active 126 DOM
-
2026-06-15days on market $139,900 Active 125 DOM
-
2026-06-13days on market $139,900 Active 123 DOM
-
2026-06-13days on market $139,900 Active 122 DOM
-
2026-06-09days on market $139,900 Active 119 DOM
-
2026-06-08days on market $139,900 Active 118 DOM
-
2026-06-07days on market $139,900 Active 117 DOM
-
2026-06-04days on market $139,900 Active 114 DOM
-
2026-06-03days on market $139,900 Active 113 DOM
-
2026-06-02days on market $139,900 Active 112 DOM
-
2026-06-01days on market $139,900 Active 111 DOM
-
2026-05-31days on market $139,900 Active 110 DOM
-
2026-02-10$139,900 Active 530-char remark
Show marketing remark (530 chars)
Don't miss this amazing opportunity! This home features 4 bedrooms and 2 baths and parking for up to 4 cars. Situated in a welcoming, family- and pet-friendly community, you'll have access to fantastic amenities such as a large swimming pool, a clubhouse perfect for gatherings, an enclosed spa, and a playground. The location is unbeatable, near the Orange/Anaheim city border, close to shopping, dining, schools, and major attractions like Disneyland, Honda Center, Angel Stadium, and with easy access to the 57 and 91 freeways.
-
2025-02-21historical
-
2025-02-09price $159,000
-
2024-12-10$169,000 Active
-
2023-07-08status Active
-
2023-04-16status Active
-
2023-03-08status Active
-
2023-02-07status Active
-
2022-10-13status Active
-
2022-10-02status Pending Sale
-
2022-09-21status Active
-
2022-09-21price $130,000
-
2022-09-12status Active
-
2022-08-28status Active
-
2022-07-15status Active
-
2022-05-23status Active
-
2022-05-08status Pending Sale
-
2022-04-04$115,000 Active
-
2022-04-02historical
-
2021-03-30historical
-
2021-02-18$70,000
ⓘ Source: listings_history table (triggers on properties + properties_extension) + one-shot
backfill from property_details.listing_events for pre-trigger history.
Climate risk First Street
- Flood 1/10 Low FEMA zone X (shaded) · 0% chance over 30 yrs
- Wildfire 1/10 Low
- Heat 6/10 Major 7 d/yr ≥94°F today · 21 d/yr by 30 yrs out
- Wind 1/10 Low
- Air quality 6/10 Major 12 unhealthy d/yr today · 13 by 30 yrs out
Nearby sold comps map
Loading sold comps map…
Walkable amenities ~0.75 mi
Loading nearby amenities…
Taxation est. · year 1
- Rental income
- $46,709
- − Mortgage interest
- −$7,837
- − Property taxes
- −$2,098
- − Insurance
- −$700
- − Repairs & maintenance
- −$3,737
- − Management
- −$3,737
- − Depreciation
- −$4,070
- Taxable income
- $24,531
- Est. tax owed @ 24.0%
- −$5,887
- After-tax cash flow
- $19,411/yr
For passive investors: Depreciation is non-cash, so a rental often shows a tax loss while cash-flowing — sheltering income. Rental losses are passive: they offset passive income freely, and up to $25,000/yr can offset ordinary (W-2) income if you actively participate and your MAGI is under $100k (phasing out to $0 by $150k); unused losses carry forward. On sale, claimed depreciation is recaptured at up to 25%, and gains may owe capital-gains tax (a 1031 exchange can defer both). Figures are a year-1 estimate at your 24.0% rate — not tax advice; consult a CPA.
Schools (NCES district)
- District
- Placentia-Yorba Linda Unified
- NCES district ID
- 0630660
- Math proficiency
- 48% ▼ -10.00%
- Reading proficiency
- 66% ▼ -2.00%
- Median HH income
- $87,455
- Composite
- 52.1/100
- National rank
- #1622
- State rank
- #78 of 517 in CA
Livability — Anaheim
- Score
- 70/100
- State rank
- #240
- US rank
- #7861
Category grades
Schools grade is shown separately in the Schools card above.
Census & demographics
- Census place
- Anaheim, CA
- County
- Orange County · 3,096,323 people
- City population
- 361,715
- Metro
- Los Angeles-Long Beach-Anaheim, CA
- Population (ZIP)
- 41,003
- Household income
- $97,265
- Rent vs Own
- Severe rent burden
- 2171.0
Population outlook (Orange County) Hauer SSP2
- Today (2025)
- 3,477,456 people
- By 2030
- 3,613,117 · +3.9%
- By 2040
- 3,835,945 · +10.3%
- By 2050
- 3,968,736 · +14.1%
- By 2075
- 4,097,053 · +17.8%
- By 2100
- 3,903,633 · +12.3%
Race, ethnicity, and origin ACS 2023
- Neighborhood character
- Diverse neighborhood (Simpson 0.59)
- Race & ethnicity
- Hispanic / Latino 58% Two or more races 25% White 24% Asian 13% Black 2% Native American 2%
- Hispanic origin (detail)
- Mexican 54%
- Common ancestry
- Portuguese 1% Lithuanian 1% Scandinavian 1%
- Foreign-born
- 31% · Canada, Vietnam, China
- Languages at home
- 43% English-only · Spanish 44% Vietnamese 3% Other Indo-European 3%
Political lean MEDSL · Orange
- 2024 margin
- Toss-up / Even · D 49.7% · R 47.1% · Other 3.2%
- 2008→2024 swing
- +5.2pp toward D · 2008: -2.6pp · 2024: 2.6pp
- All cycles
- 2024: D+2.6 2020: D+9.0 2016: D+7.7 2012: R+8.3 2008: R+2.6
Not yet ingested
- Civics
- —
Market trends
- HPI YoY
- ▼ -783.76%
- Current HPI
- 404.0916
- Rent YoY
- ▼ -0.79%
- Metro
- Los Angeles-Long Beach-Anaheim, CA
- State GDP YoY
- ▲ 3.21%
- F500 in state
- 116
Industry mix (Fortune 500 HQ in CA)
| Industry | F500 HQs | Revenue |
|---|---|---|
| Technology | 27 | $1,492B |
|
||
| Financial Services | 3 | $174B |
|
||
| Retail | 3 | $44B |
|
||
| Insurance | 3 | $26B |
|
||
| Media / Entertainment | 2 | $115B |
|
||
| Pharmaceuticals / Biotech | 2 | $62B |
|
||
Price history
+99.9% since first listed21 events — show timeline
- 2026-02-10 Listed $139,900 CRMLS
- 2025-02-21 Listing Removed — CRMLS
- 2025-02-09 Price Changed $159,000 CRMLS
- 2024-12-10 Listed $169,000 CRMLS
- 2023-07-08 Relisted — CRMLS
- 2023-04-16 Relisted — CRMLS
- 2023-03-08 Relisted — CRMLS
- 2023-02-07 Relisted — CRMLS
- 2022-10-13 Relisted — CRMLS
- 2022-10-02 Pending — CRMLS
- 2022-09-21 Relisted — CRMLS
- 2022-09-21 Price Changed $130,000 CRMLS
- 2022-09-12 Relisted — CRMLS
- 2022-08-28 Relisted — CRMLS
- 2022-07-15 Relisted — CRMLS
- 2022-05-23 Relisted — CRMLS
- 2022-05-08 Pending — CRMLS
- 2022-04-04 Listed $115,000 CRMLS
- 2022-04-02 Coming Soon — CRMLS
- 2021-03-30 Listing Removed — CRMLS
- 2021-02-18 Listed $70,000 CRMLS
Property tax history
-0.9%/yrLatest (2015): $66 · +1.5% YoY. Source: county tax records.
Cash-flow waterfall
monthlySold comps — $/sqft
last 12 mo · ≤1 miLoading sold comps…