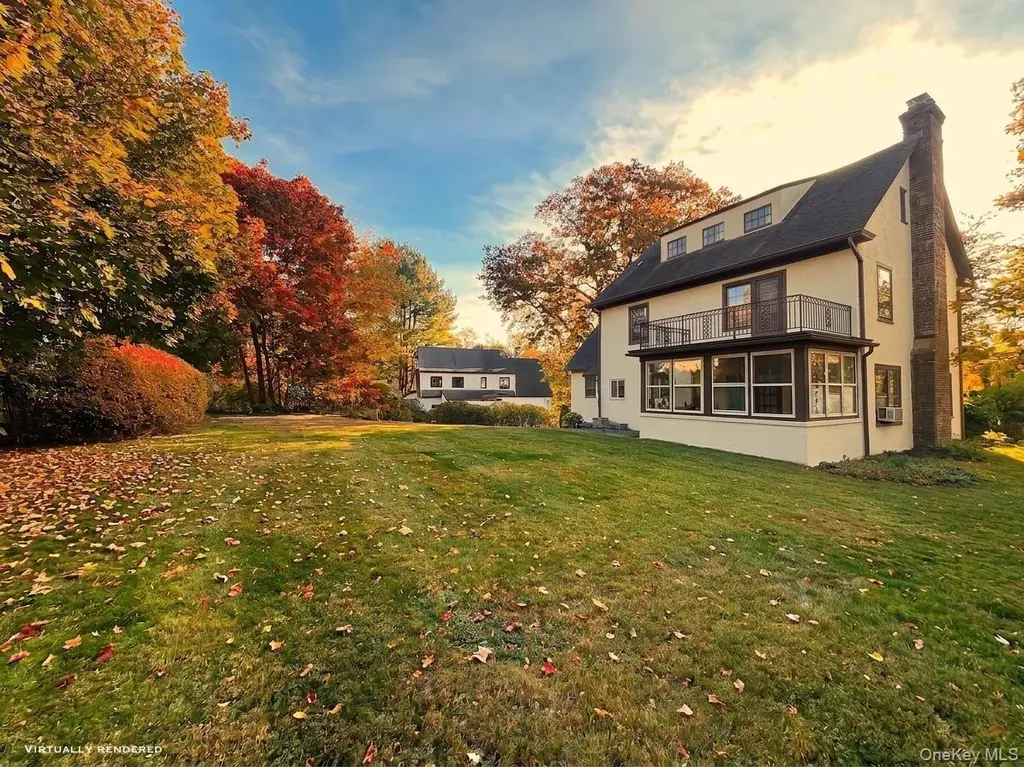
17 Old Orchard Rd · New Rochelle, NY
Flood risk 1/10 · Minimal
- FEMA flood zone
- X (unshaded)
- Chance of flooding over 30 yrs
- 0.0%
- Est. flood insurance / yr
- $507 – $1,088
Fire risk 1/10 · Minimal
- Est. fire insurance / yr
- $691 – $1,283
Heat risk 6/10 · Moderate
- Hot days now (above 98°F)
- 7 days/yr
- Hot days in 30 yrs
- 15 days/yr
Wind risk 6/10 · Moderate
- Chance of severe wind over 30 yrs
- 27.0%
Air-quality risk 5/10 · Moderate
- Unhealthy air days now
- 6 days/yr
- Unhealthy air days in 30 yrs
- 8 days/yr
Risk factors via First Street. Map © Google.
Why this score? — see what drove the C+ grade
The composite is a weighted blend of 9 inputs, each scored 0–100. Each bar is that input's sub-score; the figure is the points it added to the 100-point composite (weight × sub-score).
- Cash flow +21.2/30.0
- ARV discount +15.0/15.0
- DSCR +6.8/10.0
- 1% rule +6.2/10.0
- Schools +5.7/10.0
- Livability +3.5/5.0
- Rent growth +2.5/5.0
- Condition / age +2.5/5.0
- Appreciation +0.0/10.0
$899,000
🖨 Deal sheet 📄 Offer letter ✓ Due diligence
Listing remarks
* * JUST LISTED | 17 Old Orchard Road, New Rochelle * * Set in New Rochelle’s coveted Wykagyl estate area, this classic Tudor offers generous space, original character, and a deep, level . 26-acre lot with mature landscaping and a broad private backyard. The property measures approximately 138 feet by 83 feet, offering uncommon outdoor space and flexibility in one of New Rochelle’s most desirable residential settings. The home features 5 bedrooms and 3 full baths, including a first-floor bedroom and full bath, plus four additional bedrooms and two full baths upstairs. Well-proportioned rooms, hardwood floors, a fireplace, and classic Tudor details give the home warmth, scale
Key facts
- 0.26 acre lot
- Garage
- Built 1935
Property features AI
Exterior
- Parking: Private driveway; Carport with 2 spaces; Garage (1 space); Total 4 parking spaces
- Utilities: Public sewer; Cable available; Public trash collection
- Home design: Single-family residence; Measured living area
- Construction: Stone and stucco construction
- Exterior features: Stone and stucco exterior; Not waterfront
Interior
- Kitchen: Cooktop; Oven; Range; Dishwasher; Refrigerator
- Bedrooms: Bedroom(s) included on first floor
- Bathrooms: 3 full bathrooms
- Heating & cooling: Oil heating; Wall/window air conditioning units
- Interior features: First-floor bedroom; Finished full attic; Full and partial basement
- Laundry & utility: Washer; Dryer
Neighborhood map
What this means for you Summary
Snapshot
- This is a 5-bed/3.0-bath single-family listed at $899k.
Deal economics
- At list price, monthly cash flow is $1k ($16k/yr) — positive.
- The deal already cash-flows at list — no discount required.
- Meets the 1% rule at list price ($10k rent vs $899k).
- Recommended offer: $886k (1.5% below list) — sets the bar for market timing.
- Cap rate 8.0% vs local median 4.5% in New Rochelle — top-decile yield for the area; either an underpriced asset or a hidden risk that comps aren't pricing in. Stress-test before assuming the spread holds.
Location & tenants
- Location reads 69/100 on livability (#487 in NY) — a middle-class / working-renter tenant base. Strengths: employment A+, crime A, amenities B+; Watch: housing D+, commute F, cost of living F.
- New Rochelle City School District (suburban): math 63% / reading 66% proficiency, ranked #171 of 590 in NY (top 29%) — acceptable for families but not a draw, mixed tenant base, ~2y average lease.
- Zoned schools: William B Ward Elementary School (math 56% / reading 72%, grade B, #658 of 2,108 statewide, top 31%, 988 students, 33% FRL); Albert Leonard Middle School (math 41% / reading 73%, grade B, #192 of 729 statewide, top 28%, 1,086 students, 42% FRL); New Rochelle High School (math 87% / reading 72%, grade A-, #518 of 1,100 statewide, top 51%, 3,076 students, 57% FRL) — zoned schools at 44% FRL track the district average.
- Market conditions: 116 active listings in the ZIP; 4 comparable units currently listed for rent nearby; rentals leasing fast (median 5d on market — plan ~1-2 weeks tenant-placement turnaround); 954 units permitted in Westchester County in 2024 (649 in 5+ unit buildings).
Forward outlook
- Local home prices are declining (-3.0%/yr); year-one equity from $6k of loan paydown is wiped out by about $27k of value loss. Plan a longer hold.
- Westchester County population projected at +10% by 2050 — modest demand growth; plan on rents tracking national, not racing it.
Negotiation context
- It's been on market 21 days — a 2% lower offer ($886k) is reasonable based on typical stale-listing flexibility.
- Current owner paid $402k; list at $899k implies a 124% gain — meaningful room to come down on a strong offer.
Risks & watch-outs
- Watch-outs: built in 1935 — expect roof / HVAC / electrical / plumbing capex.
- Climate carrying-cost: major wind risk, 27% chance of damaging wind over 30y; extreme-heat days projected 7→15/yr by 2055 (HVAC capex compounding) — expect insurance premiums to compound above CPI over the hold.
Questions for the listing agent
- Built in 1935 — when were the roof, HVAC, electrical panel, plumbing, and water heater last replaced?
- Is there a deadline driving the sale (1031 exchange, divorce, estate, relocation)? That informs how much negotiation room exists.
- What's the average days-on-market for RENTAL listings here right now (not sales)? A rising rental-DOM trend means longer vacancies and softer asking-rent achievability than the comps imply.
- What's the recent tenant-quality profile in this submarket — average credit score on applications, eviction rate, late-payment / NSF rate, and stable-employment percentage? A property-management company in the area should have these aggregated.
- How much new for-sale + rental construction is in the pipeline within 1–3 miles? Heavy new supply typically softens prices + rents 12–24 months out; constrained supply supports both.
Investment metrics
- 1% rule
- 1.12% ✓
- Cap rate
- 8.03%
- Cash-on-cash
- 6.20%
- DSCR
- 1.28
- GRM
- 7.4
CMA / ARV
- ARV (on-the-fly)
- $1,551,768
- Comps found
- 12
Show comp detail 12 sales within ~0.75 mi
| Address | Dist | Beds/Ba | Sqft | Sold | Price | $/sf | Match |
|---|---|---|---|---|---|---|---|
| 45 Fenimore Rd | 0.48mi | 5/3.0 | 3,000 (-4%) | 7mo | $1,625,000 | $542 | 65 |
| 185 Fenimore Rd | 0.72mi | 4/3.5 (-1) | 3,087 (-1%) | 0mo | $1,450,000 | $470 | 58 |
| 22 Buena Vista Rd | 0.51mi | 5/3.0 | 2,900 (-7%) | 9mo | $1,898,000 | $654 | 57 |
| 67 Bon Air Ave | 0.45mi | 5/3.5 | 2,828 (-9%) | 6mo | $855,000 | $302 | 56 |
| 150 Lovell Rd | 0.60mi | 4/4.0 (-1) | 3,056 (-2%) | 5mo | $1,595,000 | $522 | 56 |
| 83 Fenimore Rd | 0.56mi | 4/4.0 (-1) | 3,015 (-3%) | 6mo | $1,500,000 | $498 | 54 |
| 112 Bon Air Ave | 0.49mi | 5/3.5 | 3,420 (+10%) | 6mo | $1,450,000 | $424 | 54 |
| 59 Mildred Pkwy | 0.64mi | 4/3.0 (-1) | 3,180 (+2%) | 10mo | $1,450,000 | $456 | 54 |
| 2 Berkley Cir | 0.43mi | 4/3.0 (-1) | 2,784 (-11%) | 9mo | $1,410,000 | $506 | 50 |
| 60 Aberfoyle Rd | 0.73mi | 4/3.5 (-1) | 2,816 (-10%) | 4mo | $1,200,000 | $426 | 40 |
| 184 Bon Air Ave | 0.56mi | 4/2.5 (-1) | 2,749 (-12%) | 9mo | $1,360,000 | $495 | 40 |
| 250 Oxford Rd | 0.56mi | 4/4.5 (-1) | 3,489 (+12%) | 10mo | $1,805,000 | $517 | 35 |
Match score weights: distance 35% · size 25% · config 20% · recency 20%. Top-matched comps best support the ARV.
Projected returns pro-forma
-3.0% appreciation · 3.0% rent growth · sell at horizon
- IRR
- -6.7%
- Equity multiple
- 0.75×
- Total profit
- $-62,368
- Equity at exit
- $134,044
- IRR
- 3.0%
- Equity multiple
- 1.22×
- Total profit
- $54,165
- Equity at exit
- $77,729
Cash invested: $251,720 (down + closing). Projections, not guarantees.
Landlord ↔ Tenant lean methodology
- Overall (STATE)
- 15 Strongly Tenant-Friendly
- State New York
- 15 Strongly Tenant-Friendly · D+10
- County
- — inherits STATE
- City
- — inherits STATE
ZIP-level market 10804
- Active inventory
- 116
- Price-to-rent
- 7.4×
Monthly cashflow live
- Estimated rent
- $10,089 medium interval (Pro) →
- Mortgage (P&I)
- −$4,714
- Tax from tax record
- −$1,580 /mo · $18,960/yr
- Insurance
- −$375
- HOA
- −$0
- Vacancy / Maint / Mgmt
- −$2,119
- Net cashflow
- $1,301
Break-even live
UW: 25.0% down · 7.5% · 30yr · 1.5% tax · 5.0% vac · 8.0% maint · 8.0% mgmt
Financing live
Cash to close
- Down payment
- $224,750
- Closing costs
- $26,970
- Reserves months
- —
- Total cash needed
- —
Loan-product check · same deal, 3 products live
Conventional
25% down · 7.5% · 30yr
- Down + closing
- —
- Monthly P&I
- —
- Monthly cashflow
- —
- DSCR
- —
- Eligible?
- —
Personal DTI + credit; lowest rate.
DSCR
20% down · 8.5% · 30yr
- Down + closing
- —
- Monthly P&I
- —
- Monthly cashflow
- —
- DSCR
- —
- Eligible?
- —
No personal income docs; deal must DSCR.
Hard money
10% down · 12.0% · 12mo
- Down + closing
- —
- Monthly P&I
- —
- Monthly cashflow
- —
- DSCR
- —
- Eligible?
- —
Short-term bridge; refi at stabilization.
Rent comps 4 comps
| Address | Beds | Baths | Sqft | Rent | $/sqft | DOM | Units | Dist |
|---|---|---|---|---|---|---|---|---|
| 16 Bon Air Ave New Rochelle, NY | 4.0 | 3.5 | 3809 | $9,500 | $2.49 | 43d | 1 | 0.50mi |
| 75 Lord Kitchener Rd New Rochelle, NY | 4.0 | 4.5 | 3032 | $10,000 | $3.30 | 4d | 1 | 0.83mi |
| 45 Fisher Ave Tuckahoe, NY | 4.0 | 2.5 | 2850 | $8,500 | $2.98 | 2d | 1 | 1.38mi |
| 15 Hillside Rd Bronxville, NY | 5.0 | 3.5 | 2750 | $13,500 | $4.91 | 2d | 1 | 1.42mi |
Listing history 15 events
-
2026-06-18days on market $899,000 Active 21 DOM
-
2026-06-17days on market $899,000 Active 20 DOM
-
2026-06-16days on market $899,000 Active 19 DOM
-
2026-06-15days on market $899,000 Active 18 DOM
-
2026-06-13days on market $899,000 Active 16 DOM
-
2026-06-09days on market $899,000 Active 12 DOM
-
2026-06-08days on market $899,000 Active 11 DOM
-
2026-06-07days on market $899,000 Active 10 DOM
-
2026-06-04days on market $899,000 Active 7 DOM
-
2026-06-03days on market $899,000 Active 6 DOM
-
2026-06-02days on market $899,000 Active 5 DOM
-
2026-06-01days on market $899,000 Active 4 DOM
-
2026-05-31days on market $899,000 Active 3 DOM
-
2026-05-19historical $899,000
-
1996-08-07soldstatus $402,000
ⓘ Source: listings_history table (triggers on properties + properties_extension) + one-shot
backfill from property_details.listing_events for pre-trigger history.
Tax reassessment forecast NY · Partial reset (capped growth)
- Current annual tax
- $18,960 · $1,580/mo
- Projected year-2 tax
- $18,960 · $1,580/mo
- Expected delta
- $0/yr ($0/mo · 0.0%)
ⓘ Screening estimate from a state-policy table — verify with the county assessor before closing.
Climate risk First Street
- Flood 1/10 Low FEMA zone X (unshaded) · 0% chance over 30 yrs
- Wildfire 1/10 Low
- Heat 6/10 Major 7 d/yr ≥98°F today · 15 d/yr by 30 yrs out
- Wind 6/10 Major 27% chance of damaging wind over 30 yrs
- Air quality 5/10 Major 6 unhealthy d/yr today · 8 by 30 yrs out
Nearby sold comps map
Loading sold comps map…
Walkable amenities ~0.75 mi
Loading nearby amenities…
Taxation est. · year 1
- Rental income
- $121,067
- − Mortgage interest
- −$50,358
- − Property taxes
- −$18,960
- − Insurance
- −$4,495
- − Repairs & maintenance
- −$9,685
- − Management
- −$9,685
- − Depreciation
- −$26,153
- Taxable income
- $1,731
- Est. tax owed @ 24.0%
- −$415
- After-tax cash flow
- $15,199/yr
For passive investors: Depreciation is non-cash, so a rental often shows a tax loss while cash-flowing — sheltering income. Rental losses are passive: they offset passive income freely, and up to $25,000/yr can offset ordinary (W-2) income if you actively participate and your MAGI is under $100k (phasing out to $0 by $150k); unused losses carry forward. On sale, claimed depreciation is recaptured at up to 25%, and gains may owe capital-gains tax (a 1031 exchange can defer both). Figures are a year-1 estimate at your 24.0% rate — not tax advice; consult a CPA.
Schools (NCES district)
- District
- New Rochelle City School District
- NCES district ID
- 3620490
- Math proficiency
- 63% ▲ 3.00%
- Reading proficiency
- 66% ▲ 9.00%
- Median HH income
- $69,165
- Composite
- 56.63/100
- National rank
- #1139
- State rank
- #171 of 590 in NY
Livability — New Rochelle
- Score
- 69/100
- State rank
- #487
- US rank
- #8572
Category grades
Schools grade is shown separately in the Schools card above.
Census & demographics
- Census place
- New Rochelle, NY
- City population
- 63,657
- Population (ZIP)
- 15,228
Population outlook (Westchester County) Hauer SSP2
- Today (2025)
- 1,028,035 people
- By 2030
- 1,051,636 · +2.3%
- By 2040
- 1,098,520 · +6.9%
- By 2050
- 1,136,044 · +10.5%
- By 2075
- 1,196,925 · +16.4%
- By 2100
- 1,175,147 · +14.3%
Race, ethnicity, and origin ACS 2023
- Neighborhood character
- Predominantly White (73%)
- Race & ethnicity
- White 73% Black 11% Hispanic / Latino 10% Two or more races 5% Asian 3%
- Hispanic origin (detail)
- Mexican 1% Puerto Rican 2% Dominican 2%
- Common ancestry
- Scotch-Irish 4% Romanian 3% Italian 2%
- Foreign-born
- 15% · Canada, Dominican Republic, Jamaica
- Languages at home
- 80% English-only · Spanish 6% Russian/Polish/Slavic 3% Other Indo-European 3%
Political lean MEDSL · Westchester
- 2024 margin
- Strong D (+26.3) · D 63.1% · R 36.9%
- 2008→2024 swing
- -1.3pp toward R · 2008: 27.6pp · 2024: 26.3pp
- All cycles
- 2024: D+26.3 2020: D+36.3 2016: D+32.8 2012: D+22.2 2008: D+27.6
Not yet ingested
- Civics
- —
Market trends
- HPI YoY
- ▼ -819.58%
- Current HPI
- 280.9571
- Rent YoY
- —
- Metro
- —
- State GDP YoY
- ▲ 2.60%
- F500 in state
- 92
Industry mix (Fortune 500 HQ in NY)
| Industry | F500 HQs | Revenue |
|---|---|---|
| Financial Services | 10 | $950B |
|
||
| Consumer Goods | 9 | $162B |
|
||
| Insurance | 4 | $225B |
|
||
| Telecommunications | 2 | $144B |
|
||
| Pharmaceuticals | 2 | $112B |
|
||
| Media / Entertainment | 2 | $69B |
|
||
Price history
+123.6% since first listed2 events — show timeline
- 2026-05-19 Coming Soon $899,000 OneKey® MLS as Distributed by MLS Grid
- 1996-08-07 Sold (Public Records) $402,000 Public Records
Property tax history
+0.1%/yrLatest (2025): $18,960 · -15.6% YoY. Source: county tax records.
Cash-flow waterfall
monthlySold comps — $/sqft
last 12 mo · ≤1 miLoading sold comps…