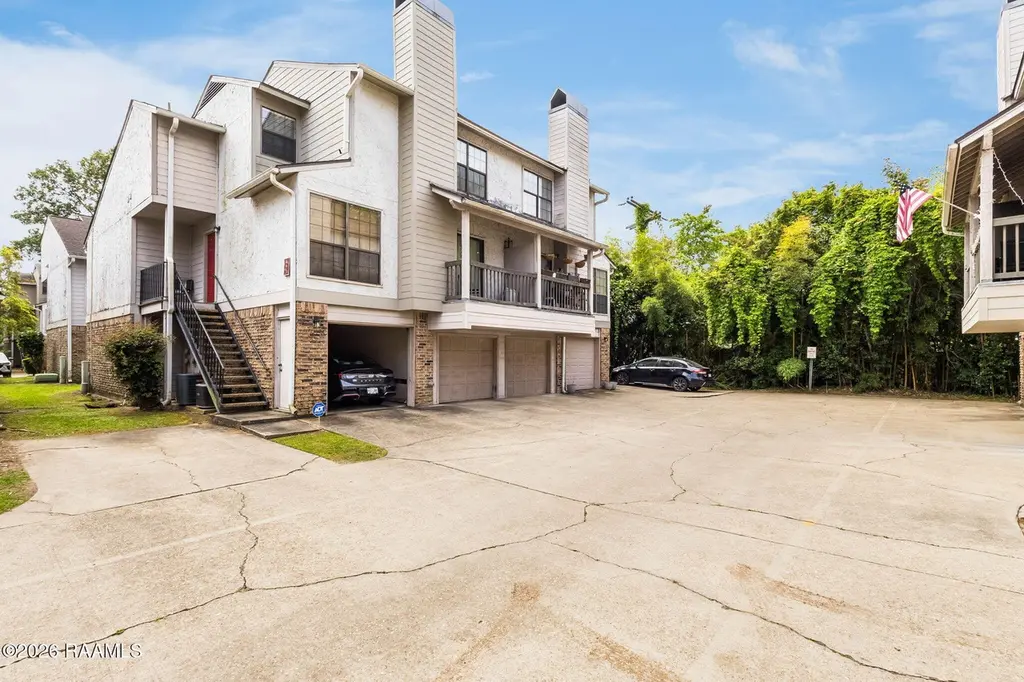
1304 E Bayou Pkwy Apt 6c · Lafayette, LA
Flood risk No data
- FEMA flood zone
- —
- Chance of flooding over 30 yrs
- —
- Est. flood insurance / yr
- —
Fire risk No data
- Est. fire insurance / yr
- —
Heat risk No data
- Hot days now (above threshold)
- —
- Hot days in 30 yrs
- —
Wind risk No data
- Chance of severe wind over 30 yrs
- —
Air-quality risk No data
- Unhealthy air days now
- —
- Unhealthy air days in 30 yrs
- —
Risk factors via First Street. Map © Google.
Why this score? — see what drove the B- grade
The composite is a weighted blend of 9 inputs, each scored 0–100. Each bar is that input's sub-score; the figure is the points it added to the 100-point composite (weight × sub-score).
- Cash flow +26.3/30.0
- 1% rule +9.4/10.0
- DSCR +8.9/10.0
- ARV discount +8.5/15.0
- Schools +3.6/10.0
- Livability +3.5/5.0
- Rent growth +2.8/5.0
- Condition / age +2.5/5.0
- Appreciation +0.0/10.0
$140,000
🖨 Deal sheet 📄 Offer letter ✓ Due diligence
Listing remarks MLS
Beautifully updated 2-bedroom, 2-bath condo offering 1,180 sq ft of bright, welcoming living space. Freshly painted and meticulously maintained, this home features sleek stainless steel appliances, a cozy fireplace, and an abundance of natural light throughout. A brand-new roof adds both value and peace of mind, making this move-in-ready home an exceptional find.
Key facts
- Garage
- Built 1984
- Listed 56 days
Neighborhood map
What this means for you Summary
Snapshot
- This is a 2-bed/2.0-bath townhouse listed at $140k.
Deal economics
- At list price, monthly cash flow is $361 ($4k/yr) — positive.
- The deal already cash-flows at list — no discount required.
- Meets the 1% rule at list price ($2k rent vs $140k).
- Recommended offer: $136k (3.0% below list) — sets the bar for market timing.
- Cap rate 9.4% vs local median 4.7% in Lafayette — top-decile yield for the area; either an underpriced asset or a hidden risk that comps aren't pricing in. Stress-test before assuming the spread holds.
Location & tenants
- Location reads 70/100 on livability (#63 in LA) — a middle-class / working-renter tenant base. Strengths: cost of living A+, housing A+, health & safety A+; Watch: amenities C-, employment C-, crime F.
- Lafayette Parish (urban): math 38% / reading 46% proficiency, ranked #19 of 98 in LA (top 19%) — families likely to look elsewhere, expect single-tenant / working-renter base with shorter leases.
- Market conditions: Rents rising (+1.2%/yr); 464 active listings in the ZIP; 28 comparable units currently listed for rent nearby; rentals at typical pace (median 21d on market — plan ~3-4 weeks tenant-placement turnaround); 46% of comp listings sitting > 30 days — soft ceiling on asking rent; solid renter incomes; 1,585 units permitted in Lafayette Parish in 2024 (10 in 5+ unit buildings).
Forward outlook
- Local home prices are declining (-3.0%/yr); year-one equity from $968 of loan paydown is wiped out by about $4k of value loss. Plan a longer hold.
- Lafayette County population projected at +34% by 2050 — long-run rental-demand tailwind backs the buy-and-hold thesis.
Negotiation context
- It's been on market 56 days — a 3% lower offer ($136k) is reasonable based on typical stale-listing flexibility.
- 8 sale attempts since 23y ago with the ask held roughly flat each time — persistent listings suggest the price (not the market) is what's stuck; bring a comps-based counter.
- Current owner paid $119k; 18% above their basis — modest negotiation headroom, anchor on the comps not their cost.
Questions for the listing agent
- It's been on market 56 days. Have you received any prior offers? Is the seller open to a 3% concession, seller financing, or rate buy-down credit?
- What does the HOA fee cover, when was the last increase, and are there any pending special assessments or reserve-fund shortfalls?
- Is there a deadline driving the sale (1031 exchange, divorce, estate, relocation)? That informs how much negotiation room exists.
- Schools are B-rated — typically a magnet for longer-tenancy family renters. What's the average tenant stay here, and is there a school-zone premium baked into asking?
- Crime grade is F in this area — have there been break-ins, vandalism, or insurance claims at this property in the last 3 years? What carrier currently insures it and at what premium?
- What's the average days-on-market for RENTAL listings here right now (not sales)? A rising rental-DOM trend means longer vacancies and softer asking-rent achievability than the comps imply.
- What's the recent tenant-quality profile in this submarket — average credit score on applications, eviction rate, late-payment / NSF rate, and stable-employment percentage? A property-management company in the area should have these aggregated.
- How much new for-sale + rental construction is in the pipeline within 1–3 miles? Heavy new supply typically softens prices + rents 12–24 months out; constrained supply supports both.
Investment metrics
- 1% rule
- 1.44% ✓
- Cap rate
- 9.39%
- Cash-on-cash
- 11.05%
- DSCR
- 1.49
- GRM
- 5.8
CMA / ARV
- ARV (median comp)
- $143,199
- List price
- $140,000
- Delta
- -2.23%
- Verdict
- FAIR
- Comps
- 20 within 1.0 mi
Show comp detail 4 sales within ~0.75 mi
| Address | Dist | Beds/Ba | Sqft | Sold | Price | $/sf | Match |
|---|---|---|---|---|---|---|---|
| 1304 E Bayou Pkwy Unit 2a | 0.00mi | 2/1.5 | 1,113 (-6%) | 13mo | $105,000 | $94 | 77 |
| 1304 E Bayou Pkwy Unit 5a | 0.00mi | 2/1.5 | 1,054 (-11%) | 13mo | $89,000 | $84 | 69 |
| 1400 E Bayou Pkwy Unit 2d | 0.28mi | 2/2.5 | 1,232 (+4%) | 11mo | $155,000 | $126 | 68 |
| 111 Jo Mar Rd | 0.60mi | 2/2.5 | 1,227 (+4%) | 12mo | $225,000 | $183 | 53 |
Match score weights: distance 35% · size 25% · config 20% · recency 20%. Top-matched comps best support the ARV.
Projected returns pro-forma
-3.0% appreciation · 1.23% rent growth · sell at horizon
- IRR
- -2.1%
- Equity multiple
- 0.92×
- Total profit
- $-3,022
- Equity at exit
- $20,874
- IRR
- 5.3%
- Equity multiple
- 1.35×
- Total profit
- $13,800
- Equity at exit
- $12,105
Cash invested: $39,200 (down + closing). Projections, not guarantees.
Landlord ↔ Tenant lean methodology
- Overall (STATE)
- 90 Strongly Landlord-Friendly
- State Louisiana
- 90 Strongly Landlord-Friendly · R+12
- County
- — inherits STATE
- City
- — inherits STATE
ZIP-level market 70508
- Home prices YoY
- -34.7%
- Rents YoY
- 1.2%
- Active inventory
- 464
- Price-to-rent
- 5.8×
Monthly cashflow live
- Estimated rent
- $2,014 high interval (Pro) →
- Mortgage (P&I)
- −$734
- Tax from tax record
- −$102 /mo · $1,221/yr
- Insurance
- −$58
- HOA
- −$336
- Vacancy / Maint / Mgmt
- −$423
- Net cashflow
- $361
Break-even live
UW: 25.0% down · 7.5% · 30yr · 1.5% tax · 5.0% vac · 8.0% maint · 8.0% mgmt
Financing live
Cash to close
- Down payment
- $35,000
- Closing costs
- $4,200
- Reserves months
- —
- Total cash needed
- —
Loan-product check · same deal, 3 products live
Conventional
25% down · 7.5% · 30yr
- Down + closing
- —
- Monthly P&I
- —
- Monthly cashflow
- —
- DSCR
- —
- Eligible?
- —
Personal DTI + credit; lowest rate.
DSCR
20% down · 8.5% · 30yr
- Down + closing
- —
- Monthly P&I
- —
- Monthly cashflow
- —
- DSCR
- —
- Eligible?
- —
No personal income docs; deal must DSCR.
Hard money
10% down · 12.0% · 12mo
- Down + closing
- —
- Monthly P&I
- —
- Monthly cashflow
- —
- DSCR
- —
- Eligible?
- —
Short-term bridge; refi at stabilization.
Rent comps 28 comps
| Address | Beds | Baths | Sqft | Rent | $/sqft | DOM | Units | Dist |
|---|---|---|---|---|---|---|---|---|
| 220 Steiner Rd Lafayette, LA | 2.0 | 2.5 | 1200 | $3,200 | $2.67 | 43d | 1 | 0.53mi |
| 1019 Kaliste Saloom Rd Lafayette, LA | 1.0–3.0 | 1.0–2.0 | 928 | $1,325 | $1.43 | 13d | 28 | 0.55mi |
| 206 Steiner Oaks Lafayette, LA | 2.0 | 2.5 | 1200 | $2,975 | $2.48 | 43d | 1 | 0.56mi |
| 214 Steiner Oaks Lafayette, LA | 2.0 | 2.5 | 1190 | $1,900 | $1.60 | 43d | 1 | 0.56mi |
| 105 Steiner Rd Lafayette, LA | 2.0 | 2.5 | 1190 | $2,900 | $2.44 | 20d | 1 | 0.60mi |
| 122 S Beadle Rd Lafayette, LA | 3.0 | 2.0 | 1500 | $1,500 | $1.00 | 43d | 1 | 0.60mi |
| 1510 Kaliste Saloom Rd #404 Lafayette, LA | 3.0 | 2.5 | 1398 | $4,000 | $2.86 | 43d | 1 | 0.64mi |
| 104 shirekeep Ln Lafayette, LA | 2.0 | 2.5 | 1311 | $1,985 | $1.51 | 13d | 1 | 0.64mi |
| 104 shirekeep Ln Lafayette, LA | 2.0 | 2.5 | 1311 | $2,075 | $1.58 | 43d | 1 | 0.64mi |
| 210 Polly Ln Lafayette, LA | 1.0–3.0 | 1.0–2.0 | 1064 | $1,447 | $1.36 | 13d | 23 | 0.72mi |
| 108 Beaulac Ln Lafayette, LA | 2.0 | 2.0 | 1450 | $2,950 | $2.03 | 43d | 1 | 0.80mi |
| 201 Settlers Trace Blvd Lafayette, LA | 1.0–3.0 | 1.0–2.0 | 1024 | $1,476 | $1.44 | 13d | 12 | 0.84mi |
| 1042 Camellia Blvd Lafayette, LA | 1.0–2.0 | 1.0–2.0 | 880 | $1,941 | $2.21 | 13d | 10 | 0.85mi |
| 302 Richland Ave Unit 103C Lafayette, LA | 2.0 | 2.0 | 1409 | $4,200 | $2.98 | 43d | 1 | 0.87mi |
| 302 Richland Ave Unit 103C Lafayette, LA | 2.0 | 2.0 | 1049 | $4,200 | $4.00 | 20d | 1 | 0.87mi |
| 443 Normandy Rd Lafayette, LA | 3.0 | 2.0 | 1348 | $1,450 | $1.08 | 43d | 1 | 1.05mi |
| 330 Feu Follet Rd Lafayette, LA | 1.0–2.0 | 1.0–2.0 | 806 | $1,488 | $1.85 | 13d | 22 | 1.06mi |
| 1521 Camellia Blvd Lafayette, LA | 1.0–3.0 | 1.0–2.0 | 1246 | $1,931 | $1.55 | 13d | 16 | 1.10mi |
| 110 W Bayou Pkwy #102 Lafayette, LA | 2.0 | 1.5 | 1356 | $1,400 | $1.03 | 13d | 1 | 1.18mi |
| 1008 S College Rd #203 Lafayette, LA | 2.0 | 2.0 | 890 | $1,250 | $1.40 | 43d | 1 | 1.31mi |
| 110 E Martial Ave Lafayette, LA | 1.0–3.0 | 1.0–2.0 | 1047 | $1,305 | $1.25 | 13d | 5 | 1.35mi |
| 112 Hillside Dr #26 Lafayette, LA | 1.0 | 1.0 | 741 | $995 | $1.34 | 43d | 1 | 1.37mi |
| 111 Oak Plains Aly Lafayette, LA | 2.0 | 2.0 | 1070 | $1,550 | $1.45 | 20d | 1 | 1.42mi |
| 915 S College Rd Lafayette, LA | 1.0–2.0 | 1.0 | 659 | $875 | $1.33 | 13d | 5 | 1.43mi |
| 108 Oak Plains Aly Unit A Lafayette, LA | 2.0 | 1.5 | 1000 | $1,895 | $1.90 | 43d | 1 | 1.43mi |
| 110 Oak Plains Aly Lafayette, LA | 2.0 | 2.0 | 980 | $1,550 | $1.58 | 20d | 1 | 1.44mi |
| 710 S College Rd Lafayette, LA | 2.0–3.0 | 1.0–2.0 | 1050 | $895 | $0.85 | 13d | 12 | 1.46mi |
| 402 E Martial Ave Lafayette, LA | 3.0 | 2.0 | 1500 | $4,000 | $2.67 | 43d | 1 | 1.46mi |
HOA detail
- Monthly dues
- $336 · $4,032/yr
Listing history 23 events
-
2026-06-09status $140,000 Pending 56 DOM
-
2026-06-08days on market $140,000 Active 56 DOM
-
2026-06-07days on market $140,000 Active 55 DOM
-
2026-06-05days on market $140,000 Active 52 DOM
-
2026-06-03days on market $140,000 Active 51 DOM
-
2026-06-02days on market $140,000 Active 50 DOM
-
2026-06-01days on market $140,000 Active 49 DOM
-
2026-05-31days on market $140,000 Active 48 DOM
-
2026-05-30days on market $140,000 Active 47 DOM
-
2026-04-13$145,000 Active 365-char remark
Show marketing remark (365 chars)
Beautifully updated 2-bedroom, 2-bath condo offering 1,180 sq ft of bright, welcoming living space. Freshly painted and meticulously maintained, this home features sleek stainless steel appliances, a cozy fireplace, and an abundance of natural light throughout. A brand-new roof adds both value and peace of mind, making this move-in-ready home an exceptional find.
-
2021-05-03soldstatus $119,000
-
2020-09-19$119,000
-
2017-06-21soldstatus $115,000
-
2017-05-22$115,000
-
2014-03-31soldstatus $119,750
-
2013-10-02$123,000
-
2012-09-25$128,500
-
2012-03-18$128,250
-
2010-09-15soldstatus $120,000
-
2010-09-15soldstatus $120,000
-
2010-02-01$117,500
-
2003-03-26soldstatus $83,500
-
2003-02-04$85,000
ⓘ Source: listings_history table (triggers on properties + properties_extension) + one-shot
backfill from property_details.listing_events for pre-trigger history.
Tax reassessment forecast LA · Resets to sale price
- Current annual tax
- $1,221 · $102/mo
- Projected year-2 tax
- $1,221 · $102/mo
- Expected delta
- $0/yr ($0/mo · 0.0%)
ⓘ Screening estimate from a state-policy table — verify with the county assessor before closing.
Nearby sold comps map
Loading sold comps map…
Walkable amenities ~0.75 mi
Loading nearby amenities…
Taxation est. · year 1
- Rental income
- $24,172
- − Mortgage interest
- −$7,842
- − Property taxes
- −$1,221
- − Insurance
- −$700
- − Repairs & maintenance
- −$1,934
- − Management
- −$1,934
- − HOA
- −$4,032
- − Depreciation
- −$4,073
- Taxable income
- $2,437
- Est. tax owed @ 24.0%
- −$585
- After-tax cash flow
- $3,748/yr
For passive investors: Depreciation is non-cash, so a rental often shows a tax loss while cash-flowing — sheltering income. Rental losses are passive: they offset passive income freely, and up to $25,000/yr can offset ordinary (W-2) income if you actively participate and your MAGI is under $100k (phasing out to $0 by $150k); unused losses carry forward. On sale, claimed depreciation is recaptured at up to 25%, and gains may owe capital-gains tax (a 1031 exchange can defer both). Figures are a year-1 estimate at your 24.0% rate — not tax advice; consult a CPA.
Schools (NCES district)
- District
- Lafayette Parish
- NCES district ID
- 2200870
- Math proficiency
- 38% ▼ -32.00%
- Reading proficiency
- 46% ▼ -24.00%
- Median HH income
- $50,238
- Composite
- 36.15/100
- National rank
- #4741
- State rank
- #19 of 98 in LA
Livability — Lafayette
- Score
- 70/100
- State rank
- #63
- US rank
- #8133
Category grades
Schools grade is shown separately in the Schools card above.
Census & demographics
- Census place
- Lafayette, LA
- County
- Lafayette Parish · 207,544 people
- City population
- 158,114
- Metro
- Lafayette, LA
- Population (ZIP)
- 40,592
- Household income
- $86,005
- Rent vs Own
- Severe rent burden
- 1860.0
Population outlook (Lafayette County) Hauer SSP2
- Today (2025)
- 280,930 people
- By 2030
- 301,092 · +7.2%
- By 2040
- 339,456 · +20.8%
- By 2050
- 375,156 · +33.5%
- By 2075
- 451,672 · +60.8%
- By 2100
- 497,203 · +77.0%
Race, ethnicity, and origin ACS 2023
- Neighborhood character
- Predominantly White (75%)
- Race & ethnicity
- White 75% Black 13% Two or more races 7% Hispanic / Latino 5% Asian 3%
- Common ancestry
- Lithuanian 20% Slovak 2% Italian 1%
- Foreign-born
- 5% · Canada, China
- Languages at home
- 91% English-only · Spanish 3% French/Haitian/Cajun 2% Other Indo-European 1%
Political lean MEDSL · Lafayette
- 2024 margin
- Solid R (+31.4) · D 33.5% · R 64.8% · Other 1.7%
- 2008→2024 swing
- -0.1pp no change · 2008: -31.3pp · 2024: -31.4pp
- All cycles
- 2024: R+31.4 2020: R+28.7 2016: R+33.6 2012: R+33.7 2008: R+31.3
Not yet ingested
- Civics
- —
Market trends
- HPI YoY
- ▼ -76.28%
- Current HPI
- 143.6305
- Rent YoY
- ▲ 1.23%
- Metro
- Lafayette, LA
- State GDP YoY
- ▲ 3.29%
- F500 in state
- 10
Industry mix (Fortune 500 HQ in LA)
| Industry | F500 HQs | Revenue |
|---|---|---|
| Telecommunications | 2 | $23B |
|
||
| Utilities | 1 | $12B |
|
||
| Wholesale / Distribution | 1 | $5B |
|
||
| Advertising | 1 | $2B |
|
||
Price history
+70.6% since first listed14 events — show timeline
- 2026-04-13 Listed $145,000 AcadianaMLS
- 2021-05-03 Sold (MLS) $119,000 AcadianaMLS
- 2020-09-19 Listed $119,000 AcadianaMLS
- 2017-06-21 Sold (MLS) $115,000 AcadianaMLS
- 2017-05-22 Listed $115,000 AcadianaMLS
- 2014-03-31 Sold (MLS) $119,750 AcadianaMLS
- 2013-10-02 Listed $123,000 AcadianaMLS
- 2012-09-25 Listed $128,500 AcadianaMLS
- 2012-03-18 Listed $128,250 AcadianaMLS
- 2010-09-15 Sold (Public Records) $120,000 Public Records
- 2010-09-15 Sold (MLS) $120,000 AcadianaMLS
- 2010-02-01 Listed $117,500 AcadianaMLS
- 2003-03-26 Sold (MLS) $83,500 AcadianaMLS
- 2003-02-04 Listed $85,000 AcadianaMLS
Property tax history
+2.1%/yrLatest (2025): $1,221 · -1.1% YoY. Source: county tax records.
Cash-flow waterfall
monthlySold comps — $/sqft
last 12 mo · ≤1 miLoading sold comps…