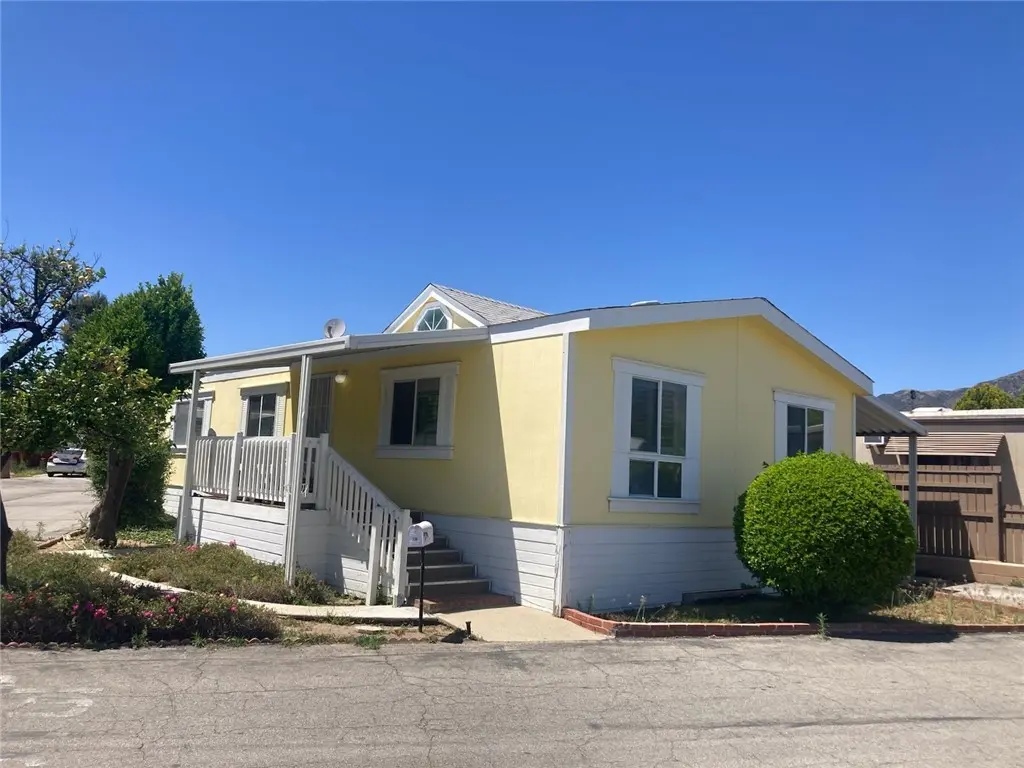
13120 Bradley Ave #50 · Los Angeles, CA
Flood risk 1/10 · Minimal
- FEMA flood zone
- X (unshaded)
- Chance of flooding over 30 yrs
- 0.0%
- Est. flood insurance / yr
- $507 – $1,088
Fire risk 3/10 · Minor
- Est. fire insurance / yr
- $659 – $1,223
Heat risk 6/10 · Moderate
- Hot days now (above 100°F)
- 8 days/yr
- Hot days in 30 yrs
- 22 days/yr
Wind risk 1/10 · Minimal
- Chance of severe wind over 30 yrs
- —
Air-quality risk 6/10 · Moderate
- Unhealthy air days now
- 10 days/yr
- Unhealthy air days in 30 yrs
- 12 days/yr
Risk factors via First Street. Map © Google.
Why this score? — see what drove the B+ grade
The composite is a weighted blend of 9 inputs, each scored 0–100. Each bar is that input's sub-score; the figure is the points it added to the 100-point composite (weight × sub-score).
- Cash flow +30.0/30.0
- ARV discount +15.0/15.0
- 1% rule +10.0/10.0
- DSCR +10.0/10.0
- Schools +3.6/10.0
- Livability +3.4/5.0
- Rent growth +2.5/5.0
- Condition / age +2.5/5.0
- Appreciation +0.0/10.0
$179,950
🖨 Deal sheet 📄 Offer letter ✓ Due diligence
Listing remarks
Xlnt Value! Well-maintained, spacious manufactured home built in 2003 in gated community! Master suite features walk-in closet and bathroom. The kitchen offers plenty of cabinet and counter space. Convenient in-unit laundry room; washer & dryer included. Two-car carport. Great location within the park, with a view of the pool and recreation area. Walk to Nethercutt Museum across the street, and nearby public transportation is available. Buyer must receive park approval prior to close.
Key facts
- 2 parking spots
- Community pool
- Built 2003
Property features AI
Finance
- Other: Road access via paved city streets; Directions: 405 or 5 Fwy exit Roxford, go East, right on Bradley; 210 Fwy exit Roxford, go West, left on Bradley
- HOA & community: Land lease: $1,083 per month; Park name: Sylmar Manor; Manager approval required; Breed restrictions for pets
Exterior
- Parking: Carport (2 spaces)
- Security: Gated community
- Utilities: Public sewer; District/public water
- Home design: Mobile home (model PSP 2304-CT); Double body type; One story; Mobile home remains; Has a view; Located in a senior community; Suburban setting
- Construction: Composition/shingle roof
- Exterior features: In-ground gunite community pool; Close to clubhouse
Interior
- Bedrooms: See remarks
- Flooring: Vinyl flooring; Carpet
- Bathrooms: 1 full bath; 1 three-quarter bath
- Interior features: Partially furnished; Formica counters; Gated community; Single-level living
- Laundry & utility: Washer included; Gas dryer hookup; Dedicated laundry room
Neighborhood map
What this means for you Summary
Snapshot
- This is a 2-bed/2.0-bath manufactured listed at $180k.
Deal economics
- At list price, monthly cash flow is $1k ($14k/yr) — positive.
- The deal already cash-flows at list — no discount required.
- Meets the 1% rule at list price ($3k rent vs $180k).
- Recommended offer: $177k (1.5% below list) — sets the bar for market timing.
- Cap rate 14.2% vs local median 2.1% in Los Angeles — top-decile yield for the area; either an underpriced asset or a hidden risk that comps aren't pricing in. Stress-test before assuming the spread holds.
Location & tenants
- Location reads 68/100 on livability (#273 in CA) — a middle-class / working-renter tenant base. Strengths: amenities A+, commute A+, employment B; Watch: health & safety C-, schools D+, crime F.
- Los Angeles Unified (urban): math 29% / reading 54% proficiency, ranked #223 of 517 in CA (top 43%) — families likely to look elsewhere, expect single-tenant / working-renter base with shorter leases; 67% free/reduced lunch — lower-income household profile, screen leases tightly.
- Market conditions: Rents flat; 183 active listings in the ZIP; 19 comparable units currently listed for rent nearby; rentals at typical pace (median 22d on market — plan ~3-4 weeks tenant-placement turnaround); solid renter incomes; 19,697 units permitted in Los Angeles County in 2024 (9,426 in 5+ unit buildings).
- This rent runs 35% of the median local income ($98k/yr) — at the standard rent-burdened threshold; future hikes will face affordability resistance.
Forward outlook
- Local home prices are declining (-3.0%/yr); year-one equity from $1k of loan paydown is wiped out by about $5k of value loss. Plan a longer hold.
- Los Angeles County population projected at +9% by 2050 — modest demand growth; plan on rents tracking national, not racing it.
- At projected returns (-3.0% appreciation + 0.0% rent growth), your $50k cash investment doubles in ~5 years — after that, you're playing with house money.
Negotiation context
- It's been on market 26 days — a 2% lower offer ($177k) is reasonable based on typical stale-listing flexibility.
- 5 sale attempts since 21y ago; this cycle's ask is 177% above the opening price — seller raised mid-cycle; expect resistance to lowballs.
Risks & watch-outs
- Climate carrying-cost: extreme-heat days projected 8→22/yr by 2055 (HVAC capex compounding) — expect insurance premiums to compound above CPI over the hold.
Questions for the listing agent
- Is there a deadline driving the sale (1031 exchange, divorce, estate, relocation)? That informs how much negotiation room exists.
- Schools are D-rated, which usually means shorter tenancies and higher turnover. Who's the typical renter profile here, and what's been the actual vacancy rate?
- Crime grade is F in this area — have there been break-ins, vandalism, or insurance claims at this property in the last 3 years? What carrier currently insures it and at what premium?
- What's the average days-on-market for RENTAL listings here right now (not sales)? A rising rental-DOM trend means longer vacancies and softer asking-rent achievability than the comps imply.
- What's the recent tenant-quality profile in this submarket — average credit score on applications, eviction rate, late-payment / NSF rate, and stable-employment percentage? A property-management company in the area should have these aggregated.
- How much new for-sale + rental construction is in the pipeline within 1–3 miles? Heavy new supply typically softens prices + rents 12–24 months out; constrained supply supports both.
Investment metrics
- 1% rule
- 1.59% ✓
- Cap rate
- 14.24%
- Cash-on-cash
- 28.38%
- DSCR
- 2.26
- GRM
- 5.2
CMA / ARV
- ARV (on-the-fly)
- $224,928
- Comps found
- 2
Show comp detail 2 sales within ~0.75 mi
| Address | Dist | Beds/Ba | Sqft | Sold | Price | $/sf | Match |
|---|---|---|---|---|---|---|---|
| 15445 Cobalt St #220 | 0.36mi | 2/2.0 | 1,152 (+9%) | 1mo | $245,000 | $213 | 68 |
| 13120 Bradley #24 | 0.07mi | 2/2.0 | 950 (-10%) | 16mo | $50,000 | $53 | 67 |
Match score weights: distance 35% · size 25% · config 20% · recency 20%. Top-matched comps best support the ARV.
Projected returns pro-forma
-3.0% appreciation · 0.02% rent growth · sell at horizon
- IRR
- 19.4%
- Equity multiple
- 1.76×
- Total profit
- $38,351
- Equity at exit
- $26,831
- IRR
- 25.7%
- Equity multiple
- 2.96×
- Total profit
- $98,663
- Equity at exit
- $15,559
Cash invested: $50,386 (down + closing). Projections, not guarantees.
Landlord ↔ Tenant lean methodology
- Overall (CITY)
- 0 Strongly Tenant-Friendly
- State California
- 18 Strongly Tenant-Friendly · D+13
- County
- — inherits STATE
- City Los Angeles
- 0 Strongly Tenant-Friendly · D+22
ZIP-level market 91342
- Rents YoY
- 0.0%
- Active inventory
- 183
- Price-to-rent
- 5.2×
Monthly cashflow live
- Estimated rent
- $2,862 high interval (Pro) →
- Mortgage (P&I)
- −$944
- Tax from tax record
- −$50 /mo · $605/yr
- Insurance
- −$75
- HOA
- −$0
- Vacancy / Maint / Mgmt
- −$601
- Net cashflow
- $1,192
Break-even live
UW: 25.0% down · 7.5% · 30yr · 1.5% tax · 5.0% vac · 8.0% maint · 8.0% mgmt
Financing live
Cash to close
- Down payment
- $44,988
- Closing costs
- $5,398
- Reserves months
- —
- Total cash needed
- —
Loan-product check · same deal, 3 products live
Conventional
25% down · 7.5% · 30yr
- Down + closing
- —
- Monthly P&I
- —
- Monthly cashflow
- —
- DSCR
- —
- Eligible?
- —
Personal DTI + credit; lowest rate.
DSCR
20% down · 8.5% · 30yr
- Down + closing
- —
- Monthly P&I
- —
- Monthly cashflow
- —
- DSCR
- —
- Eligible?
- —
No personal income docs; deal must DSCR.
Hard money
10% down · 12.0% · 12mo
- Down + closing
- —
- Monthly P&I
- —
- Monthly cashflow
- —
- DSCR
- —
- Eligible?
- —
Short-term bridge; refi at stabilization.
Rent comps 19 comps
| Address | Beds | Baths | Sqft | Rent | $/sqft | DOM | Units | Dist |
|---|---|---|---|---|---|---|---|---|
| 13035 San Fernando Rd Unit 1 Sylmar, CA | 3.0 | 1.0 | 1000 | $2,445 | $2.44 | 24d | 1 | 0.38mi |
| 13310 Glenoaks Blvd Sylmar, CA | 3.0 | 2.0 | 800 | $3,900 | $4.88 | 24d | 1 | 0.53mi |
| 13408 Glenoaks Blvd Unit 13408 Sylmar, CA | 3.0 | 2.0 | 1479 | $3,395 | $2.30 | 22d | 1 | 0.58mi |
| 13615 Fellows Ave Sylmar, CA | 3.0–4.0 | 2.0–3.0 | 1094 | $2,979 | $2.72 | 20d | 2 | 0.77mi |
| 13637 Fellows Ave Unit 5 Sylmar, CA | 3.0 | 2.0 | 1000 | $2,979 | $2.98 | 43d | 1 | 0.78mi |
| 15878 Larkspur St Sylmar, CA | 1.0 | 1.0 | 755 | $1,700 | $2.25 | 20d | 2 | 0.86mi |
| 12455 San Fernando Rd Sylmar, CA | 2.0 | 2.0 | 1100 | $2,245 | $2.04 | 43d | 1 | 0.86mi |
| 15232 Foothill Blvd #157 Sylmar, CA | 3.0 | 3.0 | 1442 | $3,795 | $2.63 | 20d | 1 | 0.99mi |
| 12450 Ralston Ave #1 Sylmar, CA | 2.0 | 2.0 | 980 | $3,175 | $3.24 | 5d | 1 | 1.02mi |
| 13811 Glenoaks Blvd Rancho Cascades, CA | 1.0–2.0 | 1.0–2.0 | 783 | $2,395 | $3.06 | 15d | 1 | 1.03mi |
| 14456 Foothill Blvd Sylmar, CA | 3.0 | 2.5 | 1233 | $3,300 | $2.68 | 43d | 1 | 1.19mi |
| 14254 Sayre St Sylmar, CA | 2.0 | 1.5 | 720 | $2,700 | $3.75 | 18d | 1 | 1.21mi |
| 14231 Aztec St Sylmar, CA | 3.0 | 2.0 | 1330 | $3,900 | $2.93 | 43d | 1 | 1.32mi |
| 14500 Olive View Dr Sylmar, CA | 1.0 | 1.0 | 716 | $1,970 | $2.75 | 5d | 5 | 1.34mi |
| 13901 Olive View Ln #52 Sylmar, CA | 3.0 | 2.5 | 1254 | $3,200 | $2.55 | 5d | 1 | 1.36mi |
| 13080 Dronfield Ave #40 Sylmar, CA | 3.0 | 2.5 | 1223 | $3,200 | $2.62 | 24d | 1 | 1.46mi |
| 13990 Astoria St Sylmar, CA | 2.0 | 2.0 | 882 | $2,475 | $2.81 | 2d | 1 | 1.48mi |
| 13050 Dronfield Ave Sylmar, CA | 2.0–3.0 | 2.0 | 919 | $2,295 | $2.50 | 43d | 3 | 1.49mi |
| 2002 4th St San Fernando, CA | 3.0 | 1.5 | 972 | $3,900 | $4.01 | 43d | 1 | 1.49mi |
Listing history 24 events
-
2026-06-18days on market $179,950 Active 26 DOM
-
2026-06-17days on market $179,950 Active 25 DOM
-
2026-06-16days on market $179,950 Active 24 DOM
-
2026-06-15days on market $179,950 Active 23 DOM
-
2026-06-13days on market $179,950 Active 21 DOM
-
2026-06-09days on market $179,950 Active 17 DOM
-
2026-06-08days on market $179,950 Active 16 DOM
-
2026-06-07days on market $179,950 Active 15 DOM
-
2026-06-04days on market $179,950 Active 12 DOM
-
2026-06-03days on market $179,950 Active 11 DOM
-
2026-06-02days on market $179,950 Active 10 DOM
-
2026-06-01days on market $179,950 Active 9 DOM
-
2026-05-31days on market $179,950 Active 8 DOM
-
2026-05-22historical $179,950
-
2011-08-24historical
-
2011-04-25price $54,900
-
2011-04-11$65,000 Active
-
2011-04-09historical
-
2011-03-08$65,000 Active
-
2009-01-26historical
-
2009-01-20$59,950
-
2005-02-14historical
-
2005-01-06
-
2005-01-06$90,000
ⓘ Source: listings_history table (triggers on properties + properties_extension) + one-shot
backfill from property_details.listing_events for pre-trigger history.
Tax reassessment forecast CA · Resets to sale price
- Current annual tax
- $605 · $50/mo
- Projected year-2 tax
- $1,368 · $114/mo
- Expected delta
- +$762/yr (+$64/mo · 126.0%)
ⓘ Screening estimate from a state-policy table — verify with the county assessor before closing.
Climate risk First Street
- Flood 1/10 Low FEMA zone X (unshaded) · 0% chance over 30 yrs
- Wildfire 3/10 Moderate
- Heat 6/10 Major 8 d/yr ≥100°F today · 22 d/yr by 30 yrs out
- Wind 1/10 Low
- Air quality 6/10 Major 10 unhealthy d/yr today · 12 by 30 yrs out
Nearby sold comps map
Loading sold comps map…
Walkable amenities ~0.75 mi
Loading nearby amenities…
Taxation est. · year 1
- Rental income
- $34,343
- − Mortgage interest
- −$10,080
- − Property taxes
- −$605
- − Insurance
- −$900
- − Repairs & maintenance
- −$2,747
- − Management
- −$2,747
- − Depreciation
- −$5,235
- Taxable income
- $12,028
- Est. tax owed @ 24.0%
- −$2,887
- After-tax cash flow
- $11,415/yr
For passive investors: Depreciation is non-cash, so a rental often shows a tax loss while cash-flowing — sheltering income. Rental losses are passive: they offset passive income freely, and up to $25,000/yr can offset ordinary (W-2) income if you actively participate and your MAGI is under $100k (phasing out to $0 by $150k); unused losses carry forward. On sale, claimed depreciation is recaptured at up to 25%, and gains may owe capital-gains tax (a 1031 exchange can defer both). Figures are a year-1 estimate at your 24.0% rate — not tax advice; consult a CPA.
Schools (NCES district)
- District
- Los Angeles Unified
- NCES district ID
- 0622710
- Math proficiency
- 29% ▼ -4.00%
- Reading proficiency
- 54% ▲ 10.00%
- Median HH income
- $50,403
- Composite
- 35.67/100
- National rank
- #4875
- State rank
- #223 of 517 in CA
Livability — Los Angeles
- Score
- 68/100
- State rank
- #273
- US rank
- #9237
Category grades
Schools grade is shown separately in the Schools card above.
Census & demographics
- Census place
- Los Angeles, CA
- County
- Los Angeles County · 9,444,647 people
- City population
- 3,838,149
- Metro
- Los Angeles-Long Beach-Anaheim, CA
- Population (ZIP)
- 93,301
- Household income
- $98,118
- Rent vs Own
- Severe rent burden
- 2559.0
Population outlook (Los Angeles County) Hauer SSP2
- Today (2025)
- 10,940,515 people
- By 2030
- 11,256,481 · +2.9%
- By 2040
- 11,729,929 · +7.2%
- By 2050
- 11,948,407 · +9.2%
- By 2075
- 11,818,114 · +8.0%
- By 2100
- 10,842,928 · -0.9%
Race, ethnicity, and origin ACS 2023
- Neighborhood character
- Predominantly Hispanic (74%)
- Race & ethnicity
- Hispanic / Latino 74% Two or more races 23% White 12% Asian 7% Black 3% Native American 2%
- Hispanic origin (detail)
- Mexican 59%
- Common ancestry
- Italian 1%
- Foreign-born
- 36% · Canada, South Korea, Dominican Republic
- Languages at home
- 32% English-only · Spanish 59% Tagalog/Filipino 4% Other Indo-European 3%
Political lean MEDSL · Los Angeles
- 2024 margin
- Solid D (+32.9) · D 64.8% · R 31.9% · Other 3.3%
- 2008→2024 swing
- -7.4pp toward R · 2008: 40.4pp · 2024: 32.9pp
- All cycles
- 2024: D+32.9 2020: D+44.2 2016: D+48.0 2012: D+40.0 2008: D+40.4
Not yet ingested
- Civics
- —
Market trends
- HPI YoY
- ▼ -921.77%
- Current HPI
- 440.1462
- Rent YoY
- ▬ 0.02%
- Metro
- Los Angeles-Long Beach-Anaheim, CA
- State GDP YoY
- ▲ 3.21%
- F500 in state
- 116
Industry mix (Fortune 500 HQ in CA)
| Industry | F500 HQs | Revenue |
|---|---|---|
| Technology | 27 | $1,492B |
|
||
| Financial Services | 3 | $174B |
|
||
| Retail | 3 | $44B |
|
||
| Insurance | 3 | $26B |
|
||
| Media / Entertainment | 2 | $115B |
|
||
| Pharmaceuticals / Biotech | 2 | $62B |
|
||
Price history
+99.9% since first listed11 events — show timeline
- 2026-05-22 Coming Soon $179,950 CRMLS
- 2011-08-24 Listing Removed — CRMLS
- 2011-04-25 Price Changed $54,900 CRMLS
- 2011-04-11 Listed $65,000 CRMLS
- 2011-04-09 Listing Removed — CRMLS
- 2011-03-08 Listed $65,000 CRMLS
- 2009-01-26 Listing Removed — CRMLS
- 2009-01-20 Listed $59,950 CRMLS
- 2005-02-14 Delisted — CRMLS
- 2005-01-06 Listed $90,000 CSMAR
- 2005-01-06 Listed — CRMLS
Property tax history
+1.6%/yrLatest (2025): $605 · +1.6% YoY. Source: county tax records.
Cash-flow waterfall
monthlySold comps — $/sqft
last 12 mo · ≤1 miLoading sold comps…