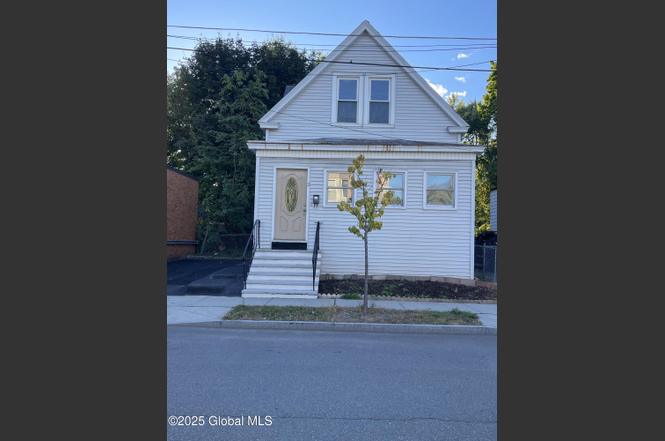
2 Sand St · Albany, NY
Flood risk 1/10 · Minimal
- FEMA flood zone
- X (unshaded)
- Chance of flooding over 30 yrs
- 0.0%
- Est. flood insurance / yr
- $473 – $860
Fire risk 3/10 · Minor
- Est. fire insurance / yr
- $691 – $1,283
Heat risk 4/10 · Minor
- Hot days now (above 99°F)
- 7 days/yr
- Hot days in 30 yrs
- 16 days/yr
Wind risk 3/10 · Minor
- Chance of severe wind over 30 yrs
- 7.0%
Air-quality risk 1/10 · Minimal
- Unhealthy air days now
- 0 days/yr
- Unhealthy air days in 30 yrs
- 0 days/yr
Risk factors via First Street. Map © Google.
Why this score? — see what drove the C- grade
The composite is a weighted blend of 9 inputs, each scored 0–100. Each bar is that input's sub-score; the figure is the points it added to the 100-point composite (weight × sub-score).
- Cash flow +17.5/30.0
- ARV discount +11.4/15.0
- 1% rule +5.5/10.0
- DSCR +5.5/10.0
- Livability +4.0/5.0
- Schools +3.2/10.0
- Rent growth +2.5/5.0
- Condition / age +2.5/5.0
- Appreciation +0.0/10.0
$175,000
🖨 Deal sheet 📄 Offer letter ✓ Due diligence
Listing remarks MLS
Newer windows, siding, and kitchen cabinets, groomed lot, off street parking, great starter home. Will not last! Star exemption applies to school taxes. Excellent Condition
Key facts
- Newer siding
- New refrigerator
- Newer windows
Tags
Neighborhood map
What this means for you Summary
Snapshot
- This is a 3-bed/1.0-bath single-family listed at $175k.
Deal economics
- At list price, monthly cash flow is $134 ($2k/yr) — positive.
- The deal already cash-flows at list — no discount required.
- Meets the 1% rule at list price ($2k rent vs $175k).
- Recommended offer: $164k (6.0% below list) — sets the bar for market timing.
- Cap rate 7.2% vs local median 5.7% in Albany — meaningfully above typical; check what's discounted (condition, days-on-market, listing class) to confirm the premium yield is real.
Location & tenants
- Location reads 79/100 on livability (#129 in NY, #2,083 nationally) — a middle-class / working-renter tenant base. Strengths: amenities A+, commute A+, housing A+; Watch: employment C-, crime F.
- Albany City School District (urban): math 37% / reading 40% proficiency, ranked #543 of 590 in NY (top 92%) — families likely to look elsewhere, expect single-tenant / working-renter base with shorter leases; 66% free/reduced lunch — lower-income household profile, screen leases tightly.
- Zoned schools: Albany High School (math 74% / reading 67%, grade B+, #710 of 1,100 statewide, top 65%, 2,676 students, 69% FRL) — zoned schools at 69% FRL track the district average.
- Zoned-school proficiency averages 70% at this address vs 38% district-wide (+32 pts) — the actual schools serving this property are materially stronger than the Albany City School District average implies; a family-tenant draw the district grade alone would hide.
- Market conditions: 47 active listings in the ZIP; 40 comparable units currently listed for rent nearby; rentals at typical pace (median 24d on market — plan ~3-4 weeks tenant-placement turnaround); 675 units permitted in Albany County in 2024 (451 in 5+ unit buildings).
Forward outlook
- Local home prices are declining (-3.0%/yr); year-one equity from $1k of loan paydown is wiped out by about $5k of value loss. Plan a longer hold.
- Albany County population projected at +9% by 2050 — modest demand growth; plan on rents tracking national, not racing it.
Negotiation context
- It's been on market 90 days — a 6% lower offer ($164k) is reasonable based on typical stale-listing flexibility.
- 4 sale attempts since 25y ago with the ask held roughly flat each time — persistent listings suggest the price (not the market) is what's stuck; bring a comps-based counter.
- Current owner paid $68k; list at $175k implies a 155% gain — meaningful room to come down on a strong offer.
Risks & watch-outs
- Watch-outs: built in 1934 — expect roof / HVAC / electrical / plumbing capex.
Questions for the listing agent
- It's been on market 90 days. Have you received any prior offers? Is the seller open to a 6% concession, seller financing, or rate buy-down credit?
- Built in 1934 — when were the roof, HVAC, electrical panel, plumbing, and water heater last replaced?
- Why hasn't it sold? Are there any deal-killer items the seller is aware of (foundation, flood, title, zoning, code violations)?
- Is there a deadline driving the sale (1031 exchange, divorce, estate, relocation)? That informs how much negotiation room exists.
- Crime grade is F in this area — have there been break-ins, vandalism, or insurance claims at this property in the last 3 years? What carrier currently insures it and at what premium?
- What's the average days-on-market for RENTAL listings here right now (not sales)? A rising rental-DOM trend means longer vacancies and softer asking-rent achievability than the comps imply.
- What's the recent tenant-quality profile in this submarket — average credit score on applications, eviction rate, late-payment / NSF rate, and stable-employment percentage? A property-management company in the area should have these aggregated.
- How much new for-sale + rental construction is in the pipeline within 1–3 miles? Heavy new supply typically softens prices + rents 12–24 months out; constrained supply supports both.
Investment metrics
- 1% rule
- 1.05% ✓
- Cap rate
- 7.21%
- Cash-on-cash
- 3.28%
- DSCR
- 1.15
- GRM
- 7.9
CMA / ARV
- ARV (on-the-fly)
- $191,760
- Comps found
- 12
Show comp detail 12 sales within ~0.75 mi
| Address | Dist | Beds/Ba | Sqft | Sold | Price | $/sf | Match |
|---|---|---|---|---|---|---|---|
| 9 O Connell St | 0.09mi | 2/2.0 (-1) | 1,038 (+2%) | 2mo | $90,000 | $87 | 82 |
| 72 Grandview Ter | 0.32mi | 4/1.0 (+1) | 972 (-5%) | 2mo | $226,000 | $233 | 71 |
| 19 W Van Vechten St | 0.20mi | 3/1.5 | 1,145 (+12%) | 4mo | $215,000 | $188 | 65 |
| 326 Mountain St | 0.52mi | 3/1.5 | 1,080 (+6%) | 4mo | $205,000 | $190 | 60 |
| 175 Broad St | 0.59mi | 3/1.5 | 1,080 (+6%) | 2mo | $150,000 | $139 | 59 |
| 134 2nd Ave | 0.30mi | 3/1.5 | 1,144 (+12%) | 8mo | $219,900 | $192 | 58 |
| 11 Norfolk St | 0.58mi | 3/1.5 | 1,080 (+6%) | 6mo | $255,000 | $236 | 56 |
| 15 Alden Ave | 0.41mi | 4/1.5 (+1) | 1,132 (+11%) | 6mo | $220,000 | $194 | 51 |
| 415 Second Ave | 0.53mi | 3/1.5 | 1,168 (+14%) | 1mo | $209,000 | $179 | 48 |
| 310 Mccarty Ave | 0.43mi | 2/1.5 (-1) | 1,154 (+13%) | 4mo | $184,000 | $159 | 47 |
| 38 Southern Blvd | 0.64mi | 3/1.0 | 1,132 (+11%) | 6mo | $175,000 | $155 | 47 |
| 484 Delaware Ave | 0.69mi | 2/2.0 (-1) | 1,132 (+11%) | 2mo | $160,000 | $141 | 39 |
Match score weights: distance 35% · size 25% · config 20% · recency 20%. Top-matched comps best support the ARV.
Projected returns pro-forma
-3.0% appreciation · 3.0% rent growth · sell at horizon
- IRR
- -11.1%
- Equity multiple
- 0.60×
- Total profit
- $-19,730
- Equity at exit
- $26,093
- IRR
- -1.7%
- Equity multiple
- 0.88×
- Total profit
- $-5,802
- Equity at exit
- $15,131
Cash invested: $49,000 (down + closing). Projections, not guarantees.
Landlord ↔ Tenant lean methodology
- Overall (STATE)
- 15 Strongly Tenant-Friendly
- State New York
- 15 Strongly Tenant-Friendly · D+10
- County
- — inherits STATE
- City
- — inherits STATE
ZIP-level market 12209
- Home prices YoY
- -7.3%
- Active inventory
- 47
- Price-to-rent
- 7.9×
Monthly cashflow live
- Estimated rent
- $1,844 high interval (Pro) →
- Mortgage (P&I)
- −$918
- Tax from tax record
- −$332 /mo · $3,983/yr
- Insurance
- −$73
- HOA
- −$0
- Vacancy / Maint / Mgmt
- −$387
- Net cashflow
- $134
Break-even live
UW: 25.0% down · 7.5% · 30yr · 1.5% tax · 5.0% vac · 8.0% maint · 8.0% mgmt
Financing live
Cash to close
- Down payment
- $43,750
- Closing costs
- $5,250
- Reserves months
- —
- Total cash needed
- —
Loan-product check · same deal, 3 products live
Conventional
25% down · 7.5% · 30yr
- Down + closing
- —
- Monthly P&I
- —
- Monthly cashflow
- —
- DSCR
- —
- Eligible?
- —
Personal DTI + credit; lowest rate.
DSCR
20% down · 8.5% · 30yr
- Down + closing
- —
- Monthly P&I
- —
- Monthly cashflow
- —
- DSCR
- —
- Eligible?
- —
No personal income docs; deal must DSCR.
Hard money
10% down · 12.0% · 12mo
- Down + closing
- —
- Monthly P&I
- —
- Monthly cashflow
- —
- DSCR
- —
- Eligible?
- —
Short-term bridge; refi at stabilization.
Rent comps 40 comps
| Address | Beds | Baths | Sqft | Rent | $/sqft | DOM | Units | Dist |
|---|---|---|---|---|---|---|---|---|
| 22 Hurlbut St Albany, NY | 3.0 | 1.0 | 1209 | $2,050 | $1.70 | 43d | 1 | 0.26mi |
| 31 Bertha St Albany, NY | 4.0 | 1.0 | 1116 | $2,000 | $1.79 | 23d | 1 | 0.29mi |
| 86 Hackett Blvd Albany, NY | 2.0 | 1.0 | 1100 | $1,900 | $1.73 | 23d | 1 | 0.55mi |
| 502 Second Ave #3 Albany, NY | 3.0 | 1.0 | 1100 | $1,800 | $1.64 | 43d | 1 | 0.59mi |
| 98 Mount Hope Dr Albany, NY | 2.0 | 1.5 | 1200 | $2,000 | $1.67 | 14d | 1 | 0.62mi |
| 50 Southern Blvd Albany, NY | 3.0 | 1.0 | 1200 | $1,650 | $1.38 | 14d | 1 | 0.62mi |
| 132 4th Ave Albany, NY | 3.0 | 1.0 | 770 | $1,800 | $2.34 | 21d | 1 | 0.63mi |
| 475 S Pearl St #3 Albany, NY | 4.0 | 2.0 | 1200 | $1,850 | $1.54 | 21d | 1 | 0.65mi |
| 475 S Pearl St #3 Albany, NY | 4.0 | 2.0 | 1200 | $1,850 | $1.54 | 14d | 1 | 0.65mi |
| 4 Irving St Unit 2nd Floor Albany, NY | 3.0 | 1.0 | 1000 | $1,695 | $1.70 | 43d | 1 | 0.73mi |
| 25 Bleecker Pl #1 Albany, NY | 2.0 | 1.0 | 1150 | $1,350 | $1.17 | 44d | 1 | 0.79mi |
| 346 Madison Ave Unit 3 Albany, NY | 3.0 | 2.0 | 1110 | $2,725 | $2.45 | 43d | 1 | 0.84mi |
| 346 Madison Ave Albany, NY | 3.0 | 2.0 | 1500 | $2,495 | $1.66 | 23d | 1 | 0.84mi |
| 364 Madison Ave Albany, NY | 2.0 | 2.0 | 1150 | $1,850 | $1.61 | 21d | 1 | 0.85mi |
| 17 Ash Grove Pl Albany, NY | 2.0 | 1.0 | 800 | $1,400 | $1.75 | 43d | 1 | 0.85mi |
| 341 Madison Ave Albany, NY | 2.0 | 1.0 | 1000 | $1,800 | $1.80 | 14d | 1 | 0.86mi |
| 103 Grand St Unit 1 Albany, NY | 2.0 | 1.0 | 800 | $1,250 | $1.56 | 14d | 1 | 0.86mi |
| 409 Madison Ave Albany, NY | 2.0 | 2.0 | 1050 | $2,094 | $1.99 | 23d | 1 | 0.90mi |
| 164 Madison Ave Albany, NY | 2.0 | 1.0 | 1200 | $1,500 | $1.25 | 43d | 1 | 0.91mi |
| 151 Madison Ave Unit C Albany, NY | 2.0 | 1.0 | 750 | $1,125 | $1.50 | 23d | 1 | 0.94mi |
| 292 Lark St Albany, NY | 2.0 | 1.0 | 1100 | $1,500 | $1.36 | 43d | 1 | 0.94mi |
| 168 S Pearl St Albany, NY | 3.0 | 1.5 | 1044 | $1,800 | $1.72 | 23d | 1 | 0.95mi |
| 31 Van Zandt St Albany, NY | 2.0 | 1.0 | 850 | $1,700 | $2.00 | 43d | 1 | 0.96mi |
| 135 Madison Ave Unit 2 Albany, NY | 2.0 | 1.0 | 1000 | $1,400 | $1.40 | 43d | 1 | 0.97mi |
| 88 Willett St Albany, NY | 3.0 | 1.0 | 825 | $2,080 | $2.52 | 14d | 10 | 0.97mi |
| 151 S Pearl St Albany, NY | 2.0 | 1.0 | 1000 | $1,600 | $1.60 | 14d | 1 | 0.97mi |
| 520 Madison Ave Unit 1 Albany, NY | 3.0 | 1.0 | 1080 | $1,700 | $1.57 | 43d | 1 | 0.97mi |
| 149 Jay St Albany, NY | 2.0 | 1.0 | 1000 | $1,750 | $1.75 | 43d | 1 | 1.02mi |
| 154 Lancaster St Unit 1 Albany, NY | 2.0 | 1.5 | 1500 | $2,200 | $1.47 | 23d | 1 | 1.04mi |
| 52 Grove Ave Albany, NY | 4.0 | 1.0 | 1200 | $2,200 | $1.83 | 21d | 1 | 1.12mi |
| 21 Woodlawn Ave Unit 3rd floor Albany, NY | 3.0 | 1.0 | 1300 | $1,500 | $1.15 | 23d | 1 | 1.13mi |
| 21 Woodlawn Ave Unit 3RDFL Albany, NY | 3.0 | 1.0 | 1300 | $1,500 | $1.15 | 43d | 1 | 1.13mi |
| 155 Chestnut St Albany, NY | 2.0 | 1.0 | 850 | $2,000 | $2.35 | 14d | 1 | 1.14mi |
| 521 Warren St Albany, NY | 2.0 | 1.0 | 850 | $2,300 | $2.71 | 14d | 1 | 1.14mi |
| 42 Harris Ave Unit 2 Albany, NY | 2.0 | 1.0 | 1000 | $1,600 | $1.60 | 14d | 1 | 1.15mi |
| 546 Mercer St Unit 1 Albany, NY | 3.0 | 1.0 | 1400 | $1,800 | $1.29 | 23d | 1 | 1.16mi |
| 352 State St Albany, NY | 2.0 | 2.0 | 1143 | $2,500 | $2.19 | 23d | 1 | 1.17mi |
| 199 Lark St Albany, NY | 3.0 | 1.0 | 1000 | $1,800 | $1.80 | 43d | 1 | 1.21mi |
| 614 Park Ave Albany, NY | 3.0 | 1.0 | 1118 | $2,500 | $2.24 | 43d | 1 | 1.30mi |
| 37 Maiden Ln Albany, NY | 2.0 | 1.0 | 700 | $1,515 | $2.16 | 14d | 1 | 1.31mi |
Listing history 11 events
-
2025-12-06status Pending
-
2025-10-27status Active
-
2025-08-26status Pending
-
2025-07-07$175,000 Active
-
2004-12-07soldstatus $68,500 172-char remark
Show marketing remark (172 chars)
Newer windows, siding, and kitchen cabinets, groomed lot, off street parking, great starter home. Will not last! Star exemption applies to school taxes. Excellent Condition
-
2004-11-15soldstatus $78,500
-
2004-08-11historical 172-char remark
Show marketing remark (172 chars)
Newer windows, siding, and kitchen cabinets, groomed lot, off street parking, great starter home. Will not last! Star exemption applies to school taxes. Excellent Condition
-
2004-07-26$79,900 172-char remark
Show marketing remark (172 chars)
Newer windows, siding, and kitchen cabinets, groomed lot, off street parking, great starter home. Will not last! Star exemption applies to school taxes. Excellent Condition
-
2002-05-20soldstatus $53,228
-
2002-05-09soldstatus $51,500 295-char remark
Show marketing remark (295 chars)
WHY RENT WHEN YOU CAN BUILD A LITTLE SWEAT EQUITY HERE! DEEP YARD FOR A HAMMOCK, SWING SET OR A BALL GAME! LIKE THE IDEA OF CLOSETS IN THE RIGHT PLACES? FLEXIBLE LIVING SPACES! COME SEE THIS HOME-NEAR THE ALBANY CIVIC THEATER 2 SAND STREET VIEW THIS LISTING ON REALTOR.COM -- Very Good Condition
-
2001-08-14$49,800 295-char remark
Show marketing remark (295 chars)
WHY RENT WHEN YOU CAN BUILD A LITTLE SWEAT EQUITY HERE! DEEP YARD FOR A HAMMOCK, SWING SET OR A BALL GAME! LIKE THE IDEA OF CLOSETS IN THE RIGHT PLACES? FLEXIBLE LIVING SPACES! COME SEE THIS HOME-NEAR THE ALBANY CIVIC THEATER 2 SAND STREET VIEW THIS LISTING ON REALTOR.COM -- Very Good Condition
ⓘ Source: listings_history table (triggers on properties + properties_extension) + one-shot
backfill from property_details.listing_events for pre-trigger history.
Tax reassessment forecast NY · Partial reset (capped growth)
- Current annual tax
- $3,983 · $332/mo
- Projected year-2 tax
- $3,983 · $332/mo
- Expected delta
- $0/yr ($0/mo · 0.0%)
ⓘ Screening estimate from a state-policy table — verify with the county assessor before closing.
Climate risk First Street
- Flood 1/10 Low FEMA zone X (unshaded) · 0% chance over 30 yrs
- Wildfire 3/10 Moderate
- Heat 4/10 Moderate 7 d/yr ≥99°F today · 16 d/yr by 30 yrs out
- Wind 3/10 Moderate 7% chance of damaging wind over 30 yrs
- Air quality 1/10 Low 0 unhealthy d/yr today · 0 by 30 yrs out
Nearby sold comps map
Loading sold comps map…
Walkable amenities ~0.75 mi
Loading nearby amenities…
Taxation est. · year 1
- Rental income
- $22,123
- − Mortgage interest
- −$9,803
- − Property taxes
- −$3,983
- − Insurance
- −$875
- − Repairs & maintenance
- −$1,770
- − Management
- −$1,770
- − Depreciation
- −$5,091
- Taxable loss
- −$1,168
- Est. tax savings @ 24.0%
- +$280
- After-tax cash flow
- $1,887/yr
For passive investors: Depreciation is non-cash, so a rental often shows a tax loss while cash-flowing — sheltering income. Rental losses are passive: they offset passive income freely, and up to $25,000/yr can offset ordinary (W-2) income if you actively participate and your MAGI is under $100k (phasing out to $0 by $150k); unused losses carry forward. On sale, claimed depreciation is recaptured at up to 25%, and gains may owe capital-gains tax (a 1031 exchange can defer both). Figures are a year-1 estimate at your 24.0% rate — not tax advice; consult a CPA.
Schools (NCES district)
- District
- Albany City School District
- NCES district ID
- 3602460
- Math proficiency
- 37% ▲ 6.00%
- Reading proficiency
- 40% ▲ 7.00%
- Median HH income
- $40,568
- Composite
- 32.34/100
- National rank
- #5744
- State rank
- #543 of 590 in NY
Livability — Albany
- Score
- 79/100
- State rank
- #129
- US rank
- #2083
Category grades
Schools grade is shown separately in the Schools card above.
Census & demographics
- Census place
- Albany, NY
- City population
- 116,921
- Population (ZIP)
- 10,754
Population outlook (Albany County) Hauer SSP2
- Today (2025)
- 320,794 people
- By 2030
- 327,401 · +2.1%
- By 2040
- 338,218 · +5.4%
- By 2050
- 348,467 · +8.6%
- By 2075
- 381,693 · +19.0%
- By 2100
- 393,809 · +22.8%
Race, ethnicity, and origin ACS 2023
- Neighborhood character
- Diverse neighborhood (Simpson 0.69)
- Race & ethnicity
- White 46% Black 23% Hispanic / Latino 19% Asian 8% Two or more races 7%
- Hispanic origin (detail)
- Puerto Rican 6%
- Common ancestry
- Romanian 4% Lithuanian 3% Serbian 1%
- Foreign-born
- 18% · Canada, Philippines, South Korea
- Languages at home
- 77% English-only · Spanish 13% Other Asian/Pacific 3% Tagalog/Filipino 1%
Political lean MEDSL · Albany
- 2024 margin
- Strong D (+25.8) · D 62.9% · R 37.1%
- 2008→2024 swing
- -3.6pp toward R · 2008: 29.4pp · 2024: 25.8pp
- All cycles
- 2024: D+25.8 2020: D+31.4 2016: D+24.3 2012: D+31.0 2008: D+29.4
Not yet ingested
- Civics
- —
Market trends
- HPI YoY
- ▼ -24.91%
- Current HPI
- 318.0191
- Rent YoY
- —
- Metro
- —
- State GDP YoY
- ▲ 2.60%
- F500 in state
- 92
Industry mix (Fortune 500 HQ in NY)
| Industry | F500 HQs | Revenue |
|---|---|---|
| Financial Services | 10 | $950B |
|
||
| Consumer Goods | 9 | $162B |
|
||
| Insurance | 4 | $225B |
|
||
| Telecommunications | 2 | $144B |
|
||
| Pharmaceuticals | 2 | $112B |
|
||
| Media / Entertainment | 2 | $69B |
|
||
Price history
+251.4% since first listed11 events — show timeline
- 2025-12-06 Pending — Global MLS
- 2025-10-27 Relisted — Global MLS
- 2025-08-26 Pending — Global MLS
- 2025-07-07 Listed $175,000 Global MLS
- 2004-12-07 Sold (MLS) $68,500 Global MLS
- 2004-11-15 Sold (Public Records) $78,500 Public Records
- 2004-08-11 Listing Removed — Global MLS
- 2004-07-26 Listed $79,900 Global MLS
- 2002-05-20 Sold (Public Records) $53,228 Public Records
- 2002-05-09 Sold (MLS) $51,500 Global MLS
- 2001-08-14 Listed $49,800 Global MLS
Property tax history
+2.9%/yrLatest (2025): $3,983 · -12.5% YoY. Source: county tax records.
Cash-flow waterfall
monthlySold comps — $/sqft
last 12 mo · ≤1 miLoading sold comps…