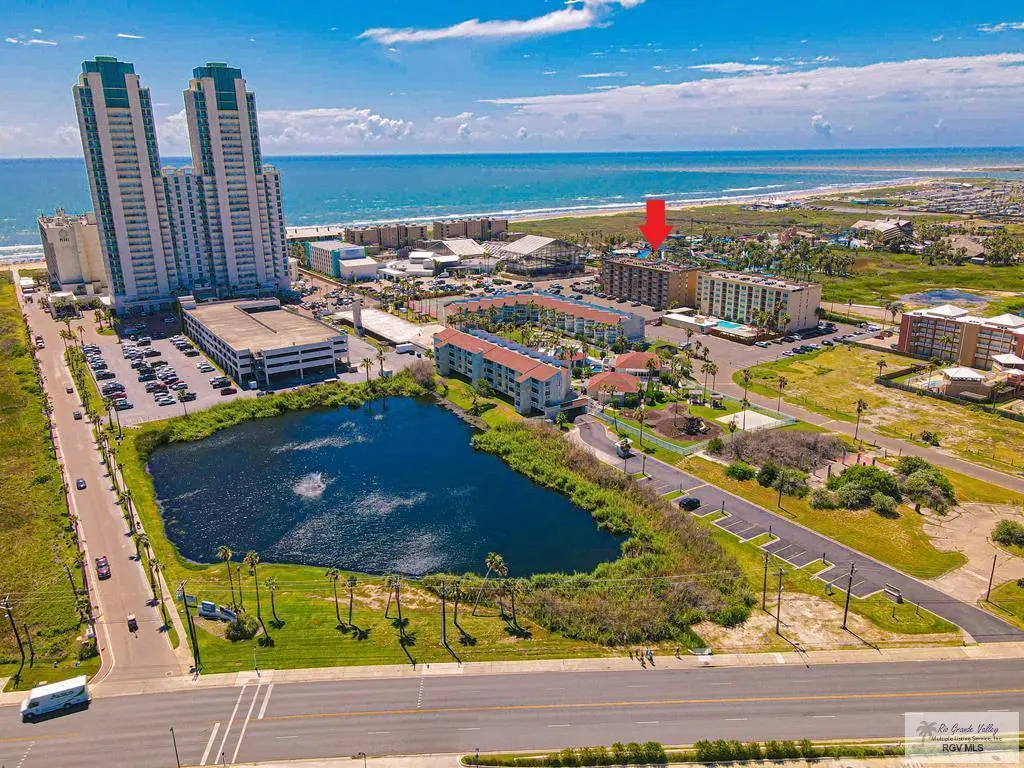
130 Padre Blvd · South Padre Island, TX
Flood risk 8/10 · Major
- FEMA flood zone
- X (shaded)
- Chance of flooding over 30 yrs
- 0.99%
- Est. flood insurance / yr
- $507 – $1,088
Fire risk 1/10 · Minimal
- Est. fire insurance / yr
- $1,222 – $2,270
Heat risk 10/10 · Severe
- Hot days now (above 105°F)
- 8 days/yr
- Hot days in 30 yrs
- 31 days/yr
Wind risk 9/10 · Severe
- Chance of severe wind over 30 yrs
- 99.0%
Air-quality risk 2/10 · Minimal
- Unhealthy air days now
- 0 days/yr
- Unhealthy air days in 30 yrs
- 1 days/yr
Risk factors via First Street. Map © Google.
Why this score? — see what drove the D+ grade
The composite is a weighted blend of 9 inputs, each scored 0–100. Each bar is that input's sub-score; the figure is the points it added to the 100-point composite (weight × sub-score).
- Cash flow +16.5/30.0
- ARV discount +7.5/15.0
- 1% rule +7.1/10.0
- DSCR +5.1/10.0
- Livability +3.0/5.0
- Rent growth +2.5/5.0
- Condition / age +2.5/5.0
- Schools +1.9/10.0
- Appreciation +0.0/10.0
$199,900
🖨 Deal sheet (PDF) 📄 Offer letter ✓ Due diligence
Listing remarks MLS
Look no further for your next exceptional getaway! This unique studio condo features beautiful panoramic views overlooking the Laguna Madre Bay, the Gulf of Mexico and Space X all from an impressive private balcony. Once inside, you'll notice this special gem has everything you need; a kitchen complete will all appliances, engaging dining area, appealing living room space and a beautifully designed queen-sized murphy bed. An added bonus is the modernized remodel in the bathroom with a walk-in shower. Minutes away from dining out, a dip in the pool, or beachside views, this condo is the perfect location for anyone! Motivated seller, bring in your offer!
Key facts
- Pool
- Built 1984
- Listed 58 days
Neighborhood map
What this means for you Summary
Snapshot
- This is a 1-bed/1.0-bath condo listed at $200k.
Deal economics
- At list price, monthly cash flow is $49 ($591/yr) — positive.
- The deal already cash-flows at list — no discount required.
- Meets the 1% rule at list price ($2k rent vs $200k).
- Recommended offer: $194k (3.0% below list) — sets the bar for market timing.
- Cap rate 7.0% vs local median 1.8% in South Padre Island — top-decile yield for the area; either an underpriced asset or a hidden risk that comps aren't pricing in. Stress-test before assuming the spread holds.
Location & tenants
- Location reads 60/100 on livability (#1,077 in TX) — a middle-class / working-renter tenant base. Strengths: housing B; Watch: amenities C-, crime F, commute F.
- Point Isabel ISD (town): math 14% / reading 31% proficiency, ranked #756 of 826 in TX (top 92%) — low school quality limits family demand, transient renter base, plan for 1-2y turnover.
- Zoned schools: Port Isabel J H (math 10% / reading 29%, grade F, #1,445 of 1,662 statewide, top 88%, 425 students, 84% FRL); Port Isabel H S (math 17% / reading 42%, grade F, #1,112 of 1,632 statewide, top 70%, 606 students, 82% FRL) — zoned schools average 83% FRL vs 35% district-wide (48 pts higher); higher-poverty schools than district average — tighter screening recommended.
- Market conditions: 522 active listings in the ZIP; 2 comparable units currently listed for rent nearby; 2,326 units permitted in Cameron County in 2024 (503 in 5+ unit buildings).
- This rent runs 43% of the median local income ($68k/yr) — at the standard rent-burdened threshold; future hikes will face affordability resistance.
Forward outlook
- Local home prices are declining (-3.0%/yr); year-one equity from $1k of loan paydown is wiped out by about $6k of value loss. Plan a longer hold.
- Cameron County population projected at +3% by 2050 — modest demand growth; plan on rents tracking national, not racing it.
Negotiation context
- It's been on market 58 days — a 3% lower offer ($194k) is reasonable based on typical stale-listing flexibility.
- 2 sale attempts since 3y ago with the ask held roughly flat each time — persistent listings suggest the price (not the market) is what's stuck; bring a comps-based counter.
Risks & watch-outs
- Watch-outs: flood insurance adds $66/mo.
- Climate carrying-cost: severe flood risk; severe wind risk, 99% chance of damaging wind over 30y; extreme-heat days projected 8→31/yr by 2055 (HVAC capex compounding) — expect insurance premiums to compound above CPI over the hold.
Questions for the listing agent
- It's been on market 58 days. Have you received any prior offers? Is the seller open to a 3% concession, seller financing, or rate buy-down credit?
- What's the actual annual flood-insurance premium (NFIP or private), and is the property in a SFHA with mandatory coverage?
- What does the HOA fee cover, when was the last increase, and are there any pending special assessments or reserve-fund shortfalls?
- Any open or pending special assessments — roof, HVAC, plumbing, elevator, façade? What's the per-unit balance and payoff schedule, and is the seller paying it off at close or rolling it to the buyer?
- Is there a deadline driving the sale (1031 exchange, divorce, estate, relocation)? That informs how much negotiation room exists.
- Schools are F-rated, which usually means shorter tenancies and higher turnover. Who's the typical renter profile here, and what's been the actual vacancy rate?
- Crime grade is F in this area — have there been break-ins, vandalism, or insurance claims at this property in the last 3 years? What carrier currently insures it and at what premium?
- The area grade is low — what's the realistic commute time and amenity access for the typical tenant pool here? Any planned neighborhood developments (good or bad) we should know about?
- What's the average days-on-market for RENTAL listings here right now (not sales)? A rising rental-DOM trend means longer vacancies and softer asking-rent achievability than the comps imply.
- What's the recent tenant-quality profile in this submarket — average credit score on applications, eviction rate, late-payment / NSF rate, and stable-employment percentage? A property-management company in the area should have these aggregated.
- How much new apartment / multifamily construction is in the pipeline within 1–3 miles? Heavy new supply (>2% of stock underway) typically softens rents 12–24 months out; light construction supports rent growth.
Investment metrics
- 1% rule
- 1.21% ✓
- Cap rate
- 6.99%
- Cash-on-cash
- 2.48%
- DSCR
- 1.11
- GRM
- 6.9
CMA / ARV
No comps found within radius.
Projected returns pro-forma
-3.0% appreciation · 3.0% rent growth · sell at horizon
- IRR
- -14.4%
- Equity multiple
- 0.48×
- Total profit
- $-28,920
- Equity at exit
- $29,806
- IRR
- -5.4%
- Equity multiple
- 0.65×
- Total profit
- $-19,785
- Equity at exit
- $17,284
Cash invested: $55,972 (down + closing). Projections, not guarantees.
Landlord ↔ Tenant lean methodology
- Overall (STATE)
- 87 Strongly Landlord-Friendly
- State Texas
- 87 Strongly Landlord-Friendly · R+5
- County
- — inherits STATE
- City
- — inherits STATE
ZIP-level market 78597
- Home prices YoY
- -13.5%
- Active inventory
- 522
- Price-to-rent
- 6.9×
Monthly cashflow live
- Estimated rent
- $2,424 medium interval (Pro) →
- Mortgage (P&I)
- −$1,048
- Tax from tax record
- −$317 /mo · $3,801/yr
- Insurance
- −$83
- Flood insurance flood zone
- −$66 /mo · $798/yr
- HOA est. from 12 same-building comps
- −$351
- Vacancy / Maint / Mgmt
- −$509
- Net cashflow
- $49
Break-even live
Sensitivity live
| Price | -10% $162 | -5% $106 | +0% $49 | +5% $-7 | +10% $-64 |
|---|---|---|---|---|---|
| Rent | -10% $-142 | -5% $-46 | +0% $49 | +5% $145 | +10% $241 |
| Rate | -1.0pp $150 | -0.5pp $100 | base $49 | +0.5pp $-3 | +1.0pp $-55 |
UW: 25.0% down · 7.5% · 30yr · 1.5% tax · 5.0% vac · 8.0% maint · 8.0% mgmt
Financing live
Cash to close
- Down payment
- $49,975
- Closing costs
- $5,997
- Reserves months
- —
- Total cash needed
- —
Loan-product check · same deal, 3 products live
Conventional
25% down · 7.5% · 30yr
- Down + closing
- —
- Monthly P&I
- —
- Monthly cashflow
- —
- DSCR
- —
- Eligible?
- —
Personal DTI + credit; lowest rate.
DSCR
20% down · 8.5% · 30yr
- Down + closing
- —
- Monthly P&I
- —
- Monthly cashflow
- —
- DSCR
- —
- Eligible?
- —
No personal income docs; deal must DSCR.
Hard money
10% down · 12.0% · 12mo
- Down + closing
- —
- Monthly P&I
- —
- Monthly cashflow
- —
- DSCR
- —
- Eligible?
- —
Short-term bridge; refi at stabilization.
Rent comps 2 comps
| Address | Beds | Baths | Sqft | Rent | $/sqft | DOM | Units | Dist |
|---|---|---|---|---|---|---|---|---|
| 404 Padre Blvd Unit 1507754P South Padre Island, TX | 1.0 | 2.0 | 667 | $3,382 | $5.07 | 14d | 1 | 0.41mi |
| 113 W Sunny Isle Dr Unit 2 South Padre Island, TX | 2.0 | 1.0 | 750 | $2,300 | $3.07 | 14d | 1 | 1.05mi |
HOA detail condo
- Monthly dues
- $0 · $0/yr
- Likely covers
- pool
- Assessments
- None detected in remarks — confirm with the listing agent.
Listing history 9 events
-
2023-11-07status Pending
-
2023-09-06$199,900 Active
-
2023-07-24soldstatus 660-char remark
Show marketing remark (660 chars)
Look no further for your next exceptional getaway! This unique studio condo features beautiful panoramic views overlooking the Laguna Madre Bay, the Gulf of Mexico and Space X all from an impressive private balcony. Once inside, you'll notice this special gem has everything you need; a kitchen complete will all appliances, engaging dining area, appealing living room space and a beautifully designed queen-sized murphy bed. An added bonus is the modernized remodel in the bathroom with a walk-in shower. Minutes away from dining out, a dip in the pool, or beachside views, this condo is the perfect location for anyone! Motivated seller, bring in your offer!
-
2023-01-23$215,000 660-char remark
Show marketing remark (660 chars)
Look no further for your next exceptional getaway! This unique studio condo features beautiful panoramic views overlooking the Laguna Madre Bay, the Gulf of Mexico and Space X all from an impressive private balcony. Once inside, you'll notice this special gem has everything you need; a kitchen complete will all appliances, engaging dining area, appealing living room space and a beautifully designed queen-sized murphy bed. An added bonus is the modernized remodel in the bathroom with a walk-in shower. Minutes away from dining out, a dip in the pool, or beachside views, this condo is the perfect location for anyone! Motivated seller, bring in your offer!
-
2006-06-02soldstatus
-
2005-10-14soldstatus
-
2003-11-20soldstatus
-
2003-06-27soldstatus
-
1993-02-01soldstatus
ⓘ Source: listings_history table (triggers on properties + properties_extension) + one-shot
backfill from property_details.listing_events for pre-trigger history.
Tax reassessment forecast TX · Resets to sale price
- Current annual tax
- $3,801 · $317/mo
- Projected year-2 tax
- $3,801 · $317/mo
- Expected delta
- $0/yr ($0/mo · 0.0%)
ⓘ Screening estimate from a state-policy table — verify with the county assessor before closing.
Climate risk First Street
- Flood 8/10 Severe FEMA zone X (shaded) · 99% chance over 30 yrs
- Wildfire 1/10 Low
- Heat 10/10 Extreme 8 d/yr ≥105°F today · 31 d/yr by 30 yrs out
- Wind 9/10 Extreme 99% chance of damaging wind over 30 yrs
- Air quality 2/10 Low 0 unhealthy d/yr today · 1 by 30 yrs out
Nearby sold comps map
Loading sold comps map…
Walkable amenities ~0.75 mi
Loading nearby amenities…
Taxation est. · year 1
- Rental income
- $29,089
- − Mortgage interest
- −$11,198
- − Property taxes
- −$3,801
- − Insurance
- −$1,797
- − Repairs & maintenance
- −$2,327
- − Management
- −$2,327
- − HOA
- −$4,212
- − Depreciation
- −$5,815
- Taxable loss
- −$2,388
- Est. tax savings @ 24.0%
- +$573
- After-tax cash flow
- $1,164/yr
For passive investors: Depreciation is non-cash, so a rental often shows a tax loss while cash-flowing — sheltering income. Rental losses are passive: they offset passive income freely, and up to $25,000/yr can offset ordinary (W-2) income if you actively participate and your MAGI is under $100k (phasing out to $0 by $150k); unused losses carry forward. On sale, claimed depreciation is recaptured at up to 25%, and gains may owe capital-gains tax (a 1031 exchange can defer both). Figures are a year-1 estimate at your 24.0% rate — not tax advice; consult a CPA.
Schools (NCES district)
- District
- Point Isabel ISD
- NCES district ID
- 4835250
- Math proficiency
- 14% ▼ -24.00%
- Reading proficiency
- 31% ▼ -10.00%
- Median HH income
- $38,115
- Composite
- 18.78/100
- National rank
- #8871
- State rank
- #756 of 826 in TX
Livability — South Padre Island
- Score
- 60/100
- State rank
- #1077
- US rank
- #19107
Category grades
Schools grade is shown separately in the Schools card above.
Census & demographics
- Census place
- South Padre Island, TX
- County
- Cameron County · 310,734 people
- Metro
- Brownsville-Harlingen, TX
- Population (ZIP)
- 2,935
- Household income
- $68,421
- Rent vs Own
- Severe rent burden
- 96.0
Population outlook (Cameron County) Hauer SSP2
- Today (2025)
- 441,603 people
- By 2030
- 448,113 · +1.5%
- By 2040
- 456,385 · +3.3%
- By 2050
- 456,294 · +3.3%
- By 2075
- 423,851 · -4.0%
- By 2100
- 342,787 · -22.4%
Race, ethnicity, and origin ACS 2023
- Neighborhood character
- Predominantly White (76%)
- Race & ethnicity
- White 76% Hispanic / Latino 15% Two or more races 7% Black 6% Asian 2%
- Hispanic origin (detail)
- Mexican 14%
- Common ancestry
- Slovak 5% Lithuanian 4% German 2%
- Foreign-born
- 13% · Canada
- Languages at home
- 88% English-only · Spanish 11% Other Indo-European 1%
Political lean MEDSL · Cameron
- 2024 margin
- Lean R (+5.8) · D 46.7% · R 52.5%
- 2008→2024 swing
- -34.6pp toward R · 2008: 28.8pp · 2024: -5.8pp
- All cycles
- 2024: R+5.8 2020: D+13.2 2016: D+32.5 2012: D+32.4 2008: D+28.8
Not yet ingested
- Civics
- —
Market trends
- HPI YoY
- ▼ -66.59%
- Current HPI
- 425.29
- Rent YoY
- —
- Metro
- Brownsville-Harlingen, TX
- State GDP YoY
- ▲ 3.95%
- F500 in state
- 110
Industry mix (Fortune 500 HQ in TX)
| Industry | F500 HQs | Revenue |
|---|---|---|
| Energy | 16 | $1,198B |
|
||
| Technology | 5 | $198B |
|
||
| Engineering / Construction | 4 | $72B |
|
||
| Energy Services | 3 | $60B |
|
||
| Utilities | 3 | $41B |
|
||
| Healthcare | 2 | $330B |
|
||
Price history
-7.0% since first listed9 events — show timeline
- 2023-11-07 Pending — RGVMLS
- 2023-09-06 Listed $199,900 RGVMLS
- 2023-07-24 Sold (MLS) — RGVMLS
- 2023-01-23 Listed $215,000 RGVMLS
- 2006-06-02 Sold (Public Records) — Public Records
- 2005-10-14 Sold (Public Records) — Public Records
- 2003-11-20 Sold (Public Records) — Public Records
- 2003-06-27 Sold (Public Records) — Public Records
- 1993-02-01 Sold (Public Records) — Public Records
Property tax history
+6.5%/yrLatest (2025): $3,801 · +7.8% YoY. Source: county tax records.
Cash-flow waterfall
monthlySold comps — $/sqft
last 12 mo · ≤1 miLoading sold comps…