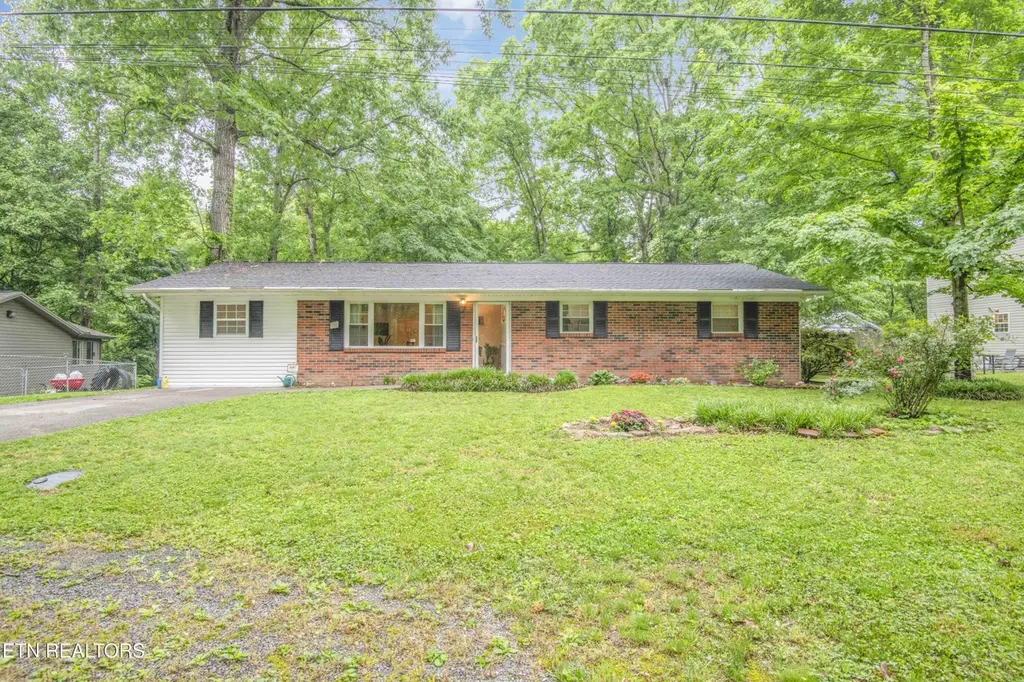
223 White Oak Ln · Clinton, TN
Flood risk 1/10 · Minimal
- FEMA flood zone
- X (unshaded)
- Chance of flooding over 30 yrs
- 0.0%
- Est. flood insurance / yr
- $473 – $860
Fire risk 5/10 · Moderate
- Est. fire insurance / yr
- $949 – $1,763
Heat risk 5/10 · Moderate
- Hot days now (above 103°F)
- 7 days/yr
- Hot days in 30 yrs
- 20 days/yr
Wind risk 2/10 · Minimal
- Chance of severe wind over 30 yrs
- 1.0%
Air-quality risk 3/10 · Minor
- Unhealthy air days now
- 3 days/yr
- Unhealthy air days in 30 yrs
- 3 days/yr
Risk factors via First Street. Map © Google.
Why this score? — see what drove the D grade
The composite is a weighted blend of 9 inputs, each scored 0–100. Each bar is that input's sub-score; the figure is the points it added to the 100-point composite (weight × sub-score).
- Cash flow +10.5/30.0
- Appreciation +10.0/10.0
- ARV discount +8.3/15.0
- Livability +3.6/5.0
- DSCR +3.0/10.0
- Rent growth +2.5/5.0
- Condition / age +2.5/5.0
- Schools +2.3/10.0
- 1% rule +1.8/10.0
$275,000
🖨 Deal sheet (PDF) 📄 Offer letter ✓ Due diligence
Listing remarks MLS
AWESOME describes this totally remodeled home!!! This home offers 3 bedrooms, 2.5 baths, custom kitchen with ceramic back splash, ceramic flooring in kitchen, hall bath and laundry room, stainless appliances, new windows, electrical and plumbing, new master bath with marble flooring and back splash in tub/shower area and so much more! This one is waiting for new owners so don t delay!!!
Key facts
- Master suite
- Large dining room
- Wooded acre
Tags
Property features AI
Exterior
- Parking: Off-street parking; Designated parking
- Utilities: Septic tank
- Home design: Detached property; 1,810 building area (agent provided)
- Construction: Vinyl siding; Brick exterior; Crawl space basement
- Exterior features: Vinyl windows; Country setting with wooded views
Interior
- Kitchen: Disposal; Refrigerator
- Bedrooms: Master bedroom; Bedroom 2; Bedroom 3; Bedroom 4
- Flooring: Carpet; Hardwood; Tile
- Bathrooms: 2 full bathrooms; 1 half bathroom
- Heating & cooling: Central heat; Heat pump; Electric heating; Central cooling
- Interior features: Walk-in closets; 7 total rooms
- Laundry & utility: Washer; Dryer
Neighborhood map
What this means for you Summary
Snapshot
- This is a 4-bed/2.0-bath single-family listed at $275k.
Deal economics
- At list price, monthly cash flow is $-139 ($-2k/yr) — negative.
- To cash-flow at today's rent, offer at most $250k (8.9% below list).
- To meet the 1% rule (rent ≥ 1% of price), the offer needs to be $188k (31.6% below list).
- Recommended offer: $188k (31.6% below list) — sets the bar for 1% rule.
- Cap rate 5.7% vs local median 3.7% in Clinton — top-decile yield for the area; either an underpriced asset or a hidden risk that comps aren't pricing in. Stress-test before assuming the spread holds.
Location & tenants
- Location reads 72/100 on livability (#30 in TN) — a middle-class / working-renter tenant base. Strengths: cost of living A+, housing A+, health & safety A+; Watch: amenities C-, employment D+, crime D-.
- Anderson County (town): math 25% / reading 28% proficiency, ranked #75 of 139 in TN (top 54%) — low school quality limits family demand, transient renter base, plan for 1-2y turnover.
- Zoned schools: Claxton Elementary (math 18% / reading 25%, grade F, #630 of 952 statewide, top 66%, 502 students, 0% FRL); Norris Middle School (math 23% / reading 26%, grade F, #154 of 333 statewide, top 48%, 489 students, 0% FRL); Clinton High School (math 17% / reading 37%, grade F, #104 of 332 statewide, top 33%, 1,126 students, 0% FRL) — zoned schools average 0% FRL vs 49% district-wide (49 pts lower); this property's tenant base skews higher-income than the district average.
- Market conditions: 9 active listings in the ZIP; 400 units permitted in Anderson County in 2024 (91 in 5+ unit buildings).
Forward outlook
- In year one you build about $29k of equity ($2k loan paydown + $28k appreciation (10.0% local appreciation)).
- By year 2, paydown + projected appreciation supports a ~$47k cash-out refi (75% LTV) — recoverable capital for the next deal without selling this one.
Negotiation context
- It's been on market 37 days — a 3% lower offer ($267k) is reasonable based on typical stale-listing flexibility.
- 5 sale attempts since 19y ago with the ask held roughly flat each time — persistent listings suggest the price (not the market) is what's stuck; bring a comps-based counter.
- Current owner paid $130k; list at $275k implies a 112% gain — meaningful room to come down on a strong offer.
Risks & watch-outs
- Climate carrying-cost: moderate wildfire risk; extreme-heat days projected 7→20/yr by 2055 (HVAC capex compounding) — expect insurance premiums to compound above CPI over the hold.
Questions for the listing agent
- What do current leases actually rent for vs. the listed asking? Can we see a recent rent roll and the last 12 months of T-12 income?
- It's been on market 37 days. Have you received any prior offers? Is the seller open to a 32% concession, seller financing, or rate buy-down credit?
- Built in 1974 — when were the roof, HVAC, electrical panel, plumbing, and water heater last replaced?
- Is there a deadline driving the sale (1031 exchange, divorce, estate, relocation)? That informs how much negotiation room exists.
- Schools are D-rated, which usually means shorter tenancies and higher turnover. Who's the typical renter profile here, and what's been the actual vacancy rate?
- Crime grade is D in this area — have there been break-ins, vandalism, or insurance claims at this property in the last 3 years? What carrier currently insures it and at what premium?
- The area grade is low — what's the realistic commute time and amenity access for the typical tenant pool here? Any planned neighborhood developments (good or bad) we should know about?
- What's the average days-on-market for RENTAL listings here right now (not sales)? A rising rental-DOM trend means longer vacancies and softer asking-rent achievability than the comps imply.
- What's the recent tenant-quality profile in this submarket — average credit score on applications, eviction rate, late-payment / NSF rate, and stable-employment percentage? A property-management company in the area should have these aggregated.
- How much new for-sale + rental construction is in the pipeline within 1–3 miles? Heavy new supply typically softens prices + rents 12–24 months out; constrained supply supports both.
Investment metrics
- 1% rule
- 0.68% ✗
- Cap rate
- 5.69%
- Cash-on-cash
- -2.17%
- DSCR
- 0.90
- GRM
- 12.2
CMA / ARV
- ARV (on-the-fly)
- $280,160
- Comps found
- 3
Show comp detail 3 sales within ~0.75 mi
| Address | Dist | Beds/Ba | Sqft | Sold | Price | $/sf | Match |
|---|---|---|---|---|---|---|---|
| 117 Pine Hill Rd | 0.29mi | 3/2.0 (-1) | 1,732 (+5%) | 12mo | $339,000 | $196 | 63 |
| 133 Pine Ridge Rd | 0.32mi | 3/1.5 (-1) | 1,616 (-2%) | 18mo | $275,000 | $170 | 59 |
| 1688 E Wolf Valley Rd | 0.75mi | 3/1.5 (-1) | 1,440 (-13%) | 6mo | $230,000 | $160 | 32 |
Match score weights: distance 35% · size 25% · config 20% · recency 20%. Top-matched comps best support the ARV.
Projected returns pro-forma
10.0% appreciation · 3.0% rent growth · sell at horizon
- IRR
- 22.7%
- Equity multiple
- 2.83×
- Total profit
- $140,761
- Equity at exit
- $247,742
- IRR
- 20.3%
- Equity multiple
- 6.47×
- Total profit
- $421,214
- Equity at exit
- $534,265
Cash invested: $77,000 (down + closing). Projections, not guarantees.
Landlord ↔ Tenant lean methodology
- Overall (STATE)
- 87 Strongly Landlord-Friendly
- State Tennessee
- 87 Strongly Landlord-Friendly · R+13
- County
- — inherits STATE
- City
- — inherits STATE
ZIP-level market 37754
- Home prices YoY
- 21.0%
- Active inventory
- 9
- Price-to-rent
- 12.2×
Monthly cashflow live
- Estimated rent
- $1,882 medium interval (Pro) →
- Mortgage (P&I)
- −$1,442
- Tax from tax record
- −$69 /mo · $829/yr
- Insurance
- −$115
- HOA
- −$0
- Vacancy / Maint / Mgmt
- −$395
- Net cashflow
- $-139
Break-even live
Sensitivity live
| Price | -10% $16 | -5% $-61 | +0% $-139 | +5% $-217 | +10% $-295 |
|---|---|---|---|---|---|
| Rent | -10% $-288 | -5% $-214 | +0% $-139 | +5% $-65 | +10% $9 |
| Rate | -1.0pp $-1 | -0.5pp $-69 | base $-139 | +0.5pp $-211 | +1.0pp $-283 |
UW: 25.0% down · 7.5% · 30yr · 1.5% tax · 5.0% vac · 8.0% maint · 8.0% mgmt
Financing live
Cash to close
- Down payment
- $68,750
- Closing costs
- $8,250
- Reserves months
- —
- Total cash needed
- —
Loan-product check · same deal, 3 products live
Conventional
25% down · 7.5% · 30yr
- Down + closing
- —
- Monthly P&I
- —
- Monthly cashflow
- —
- DSCR
- —
- Eligible?
- —
Personal DTI + credit; lowest rate.
DSCR
20% down · 8.5% · 30yr
- Down + closing
- —
- Monthly P&I
- —
- Monthly cashflow
- —
- DSCR
- —
- Eligible?
- —
No personal income docs; deal must DSCR.
Hard money
10% down · 12.0% · 12mo
- Down + closing
- —
- Monthly P&I
- —
- Monthly cashflow
- —
- DSCR
- —
- Eligible?
- —
Short-term bridge; refi at stabilization.
Listing history 25 events
-
2026-06-22days on market $275,000 Active 37 DOM
-
2026-06-18days on market $275,000 Active 34 DOM
-
2026-06-17days on market $275,000 Active 33 DOM
-
2026-06-16days on market $275,000 Active 32 DOM
-
2026-06-15days on market $275,000 Active 31 DOM
-
2026-06-14days on market $275,000 Active 29 DOM
-
2026-06-13days on market $275,000 Active 28 DOM
-
2026-06-10days on market $275,000 Active 26 DOM
-
2026-06-09days on market $275,000 Active 25 DOM
-
2026-06-08days on market $275,000 Active 24 DOM
-
2026-06-07pricedays on market $275,000 Active 23 DOM
-
2026-06-03days on market $289,000 Active 19 DOM
-
2026-06-02days on market $289,000 Active 18 DOM
-
2026-06-01days on market $289,000 Active 17 DOM
-
2026-05-31days on market $289,000 Active 16 DOM
-
2026-05-31days on market $289,000 Active 15 DOM
-
2026-05-15$289,000 Active
-
2011-10-06soldstatus $130,000
-
2011-10-04soldstatus $130,000 389-char remark
Show marketing remark (389 chars)
AWESOME describes this totally remodeled home!!! This home offers 3 bedrooms, 2.5 baths, custom kitchen with ceramic back splash, ceramic flooring in kitchen, hall bath and laundry room, stainless appliances, new windows, electrical and plumbing, new master bath with marble flooring and back splash in tub/shower area and so much more! This one is waiting for new owners so don t delay!!!
-
2011-01-04$132,500 389-char remark
Show marketing remark (389 chars)
AWESOME describes this totally remodeled home!!! This home offers 3 bedrooms, 2.5 baths, custom kitchen with ceramic back splash, ceramic flooring in kitchen, hall bath and laundry room, stainless appliances, new windows, electrical and plumbing, new master bath with marble flooring and back splash in tub/shower area and so much more! This one is waiting for new owners so don t delay!!!
-
2010-10-07$134,900
-
2009-08-20soldstatus $59,000
-
2009-07-17$64,900
-
2007-04-17$119,900
-
1999-02-25soldstatus $77,900
ⓘ Source: listings_history table (triggers on properties + properties_extension) + one-shot
backfill from property_details.listing_events for pre-trigger history.
Tax reassessment forecast TN · Resets to sale price
- Current annual tax
- $829 · $69/mo
- Projected year-2 tax
- $1,952 · $163/mo
- Expected delta
- +$1,124/yr (+$94/mo · 135.5%)
ⓘ Screening estimate from a state-policy table — verify with the county assessor before closing.
Climate risk First Street
- Flood 1/10 Low FEMA zone X (unshaded) · 0% chance over 30 yrs
- Wildfire 5/10 Major
- Heat 5/10 Major 7 d/yr ≥103°F today · 20 d/yr by 30 yrs out
- Wind 2/10 Low 100% chance of damaging wind over 30 yrs
- Air quality 3/10 Moderate 3 unhealthy d/yr today · 3 by 30 yrs out
Nearby sold comps map
Loading sold comps map…
Walkable amenities ~0.75 mi
Loading nearby amenities…
Taxation est. · year 1
- Rental income
- $22,580
- − Mortgage interest
- −$15,404
- − Property taxes
- −$829
- − Insurance
- −$1,375
- − Repairs & maintenance
- −$1,806
- − Management
- −$1,806
- − Depreciation
- −$8,000
- Taxable loss
- −$6,641
- Est. tax savings @ 24.0%
- +$1,594
- After-tax cash flow
- $-78/yr
For passive investors: Depreciation is non-cash, so a rental often shows a tax loss while cash-flowing — sheltering income. Rental losses are passive: they offset passive income freely, and up to $25,000/yr can offset ordinary (W-2) income if you actively participate and your MAGI is under $100k (phasing out to $0 by $150k); unused losses carry forward. On sale, claimed depreciation is recaptured at up to 25%, and gains may owe capital-gains tax (a 1031 exchange can defer both). Figures are a year-1 estimate at your 24.0% rate — not tax advice; consult a CPA.
Schools (NCES district)
- District
- Anderson County
- NCES district ID
- 4700090
- Math proficiency
- 25% ▼ -11.00%
- Reading proficiency
- 28% ▼ -4.00%
- Median HH income
- $43,541
- Composite
- 22.68/100
- National rank
- #8043
- State rank
- #75 of 139 in TN
Livability — Clinton
- Score
- 72/100
- State rank
- #30
- US rank
- #5726
Category grades
Schools grade is shown separately in the Schools card above.
Census & demographics
- Population (ZIP)
- 4,075
Population outlook (Anderson County) Hauer SSP2
- Today (2025)
- 76,963 people
- By 2030
- 77,226 · +0.3%
- By 2040
- 76,905 · -0.1%
- By 2050
- 75,405 · -2.0%
- By 2075
- 70,858 · -7.9%
- By 2100
- 60,585 · -21.3%
Race, ethnicity, and origin ACS 2023
- Neighborhood character
- Predominantly White (91%)
- Race & ethnicity
- White 91% Two or more races 6% Hispanic / Latino 2%
- Common ancestry
- Serbian 6% Lithuanian 2% Slovak 2%
- Foreign-born
- 0%
Political lean MEDSL · Anderson
- 2024 margin
- Solid R (+35.7) · D 31.5% · R 67.3% · Other 1.2%
- 2008→2024 swing
- -9.5pp toward R · 2008: -26.2pp · 2024: -35.7pp
- All cycles
- 2024: R+35.7 2020: R+32.2 2016: R+34.3 2012: R+29.8 2008: R+26.2
Not yet ingested
- Civics
- —
Market trends
- HPI YoY
- ▲ 70.22%
- Current HPI
- 404.8998
- Rent YoY
- —
- Metro
- —
- State GDP YoY
- ▲ 2.78%
- F500 in state
- 22
Industry mix (Fortune 500 HQ in TN)
| Industry | F500 HQs | Revenue |
|---|---|---|
| Healthcare | 3 | $91B |
|
||
| Retail | 3 | $72B |
|
||
| Transportation / Logistics | 1 | $88B |
|
||
| Paper / Packaging | 1 | $19B |
|
||
| Insurance | 1 | $13B |
|
||
| Energy | 1 | $12B |
|
||
Price history
+271.0% since first listed9 events — show timeline
- 2026-05-15 Listed $289,000 Knoxville MLS
- 2011-10-06 Sold (Public Records) $130,000 Public Records
- 2011-10-04 Sold (MLS) $130,000 Knoxville MLS
- 2011-01-04 Listed $132,500 Knoxville MLS
- 2010-10-07 Listed $134,900 Knoxville MLS
- 2009-08-20 Sold (MLS) $59,000 Knoxville MLS
- 2009-07-17 Listed $64,900 Knoxville MLS
- 2007-04-17 Listed $119,900 Knoxville MLS
- 1999-02-25 Sold (Public Records) $77,900 Public Records
Property tax history
+1.9%/yrLatest (2025): $829 · +4.3% YoY. Source: county tax records.
Cash-flow waterfall
monthlySold comps — $/sqft
last 12 mo · ≤1 miLoading sold comps…