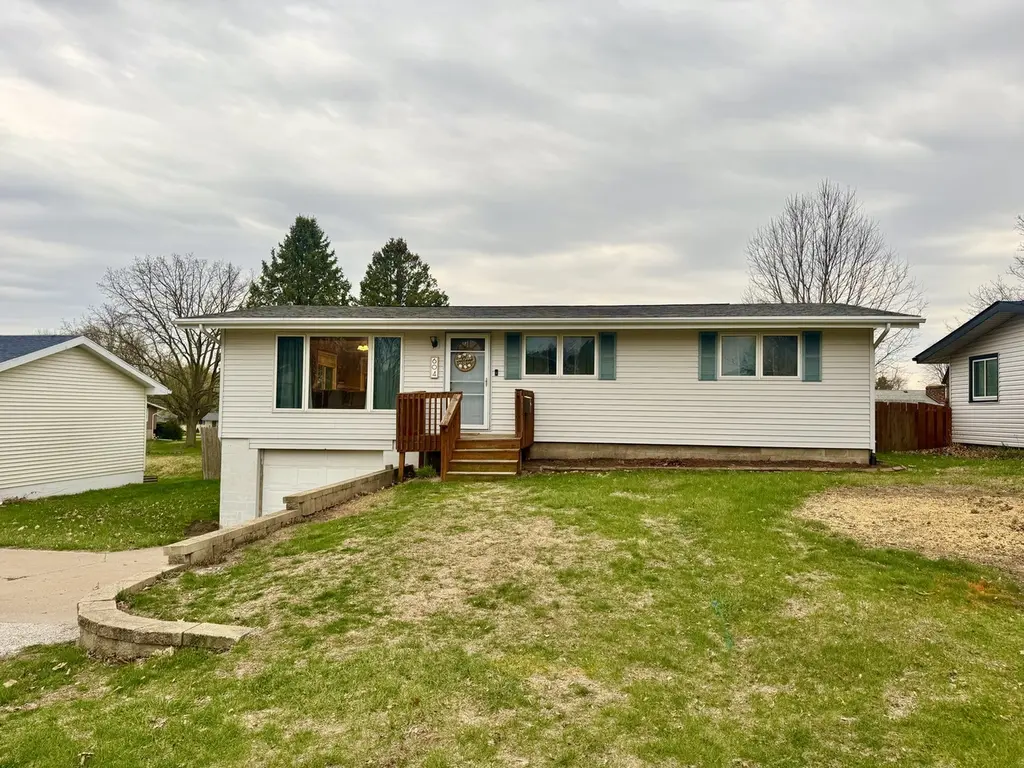
604 SW 8th St · Aledo, IL
Flood risk 1/10 · Minimal
- FEMA flood zone
- X (unshaded)
- Chance of flooding over 30 yrs
- 0.0%
- Est. flood insurance / yr
- $473 – $860
Fire risk 1/10 · Minimal
- Est. fire insurance / yr
- $804 – $1,492
Heat risk 3/10 · Minor
- Hot days now (above 105°F)
- 7 days/yr
- Hot days in 30 yrs
- 16 days/yr
Wind risk 2/10 · Minimal
- Chance of severe wind over 30 yrs
- —
Air-quality risk 2/10 · Minimal
- Unhealthy air days now
- 2 days/yr
- Unhealthy air days in 30 yrs
- 2 days/yr
Risk factors via First Street. Map © Google.
Why this score? — see what drove the D grade
The composite is a weighted blend of 9 inputs, each scored 0–100. Each bar is that input's sub-score; the figure is the points it added to the 100-point composite (weight × sub-score).
- Cash flow +14.9/30.0
- ARV discount +9.3/15.0
- 1% rule +4.6/10.0
- DSCR +4.6/10.0
- Livability +3.5/5.0
- Rent growth +2.5/5.0
- Condition / age +2.5/5.0
- Schools +1.7/10.0
- Appreciation +0.0/10.0
$139,900
🖨 Deal sheet 📄 Offer letter ✓ Due diligence
Listing remarks MLS
Check out this beautiful home! Walk into the open living, dining and kitchen, very light, airy and perfect for entertaining . The large master bedroom has a spacious walk in closet. Basement features large family room and 3rd non-conforming bedroom. Great outdoor space for entertaining features 2 tier deck and above ground pool, storage shed, and fenced yard . Appliances stay, as is . New roof in 2016. Staging by Out Of the Box Design !
Key facts
- 7,280 sq ft lot
- Garage
- Pool
Neighborhood map
What this means for you Summary
Snapshot
- This is a 3-bed/2.0-bath single-family listed at $140k.
Deal economics
- At list price, monthly cash flow is $41 ($487/yr) — positive.
- The deal already cash-flows at list — no discount required.
- To meet the 1% rule (rent ≥ 1% of price), the offer needs to be $135k (3.6% below list).
- Recommended offer: $135k (3.6% below list) — sets the bar for 1% rule.
Location & tenants
- Location reads 69/100 on livability (#390 in IL) — a middle-class / working-renter tenant base. Strengths: crime A+, cost of living A+, housing A+; Watch: amenities F, commute F.
- Mercer County School District 404 (town): math 14% / reading 24% proficiency, ranked #439 of 620 in IL (top 71%) — low school quality limits family demand, transient renter base, plan for 1-2y turnover.
- Zoned schools: Apollo Elem School (math 17% / reading 17%, grade F, #1,141 of 2,056 statewide, top 59%, 335 students, 0% FRL); Mercer County Jr High School (math 17% / reading 29%, grade F, #377 of 665 statewide, top 58%, 299 students, 0% FRL); Mercer County High School (math 17% / reading 22%, grade F, #397 of 693 statewide, top 61%, 404 students, 0% FRL) — zoned schools average 0% FRL vs 37% district-wide (37 pts lower); this property's tenant base skews higher-income than the district average.
- Market conditions: 41 active listings in the ZIP; 15 units permitted in Mercer County in 2024 (0 in 5+ unit buildings).
Forward outlook
- Local home prices are declining (-3.0%/yr); year-one equity from $967 of loan paydown is wiped out by about $4k of value loss. Plan a longer hold.
- Mercer County population projected at -25% by 2050 — secular population decline; favor cash flow + early exit over multi-decade hold.
Negotiation context
- Only 2 days on market — expect competitive offers; lowballing is unlikely to land.
- 4 sale attempts since 11y ago; this cycle's ask is 33% above the opening price — seller raised mid-cycle; expect resistance to lowballs.
- Current owner paid $100k; 40% above their basis — modest negotiation headroom, anchor on the comps not their cost.
Questions for the listing agent
- Built in 1971 — when were the roof, HVAC, electrical panel, plumbing, and water heater last replaced?
- Is there a deadline driving the sale (1031 exchange, divorce, estate, relocation)? That informs how much negotiation room exists.
- Schools are D-rated, which usually means shorter tenancies and higher turnover. Who's the typical renter profile here, and what's been the actual vacancy rate?
- The area grade is low — what's the realistic commute time and amenity access for the typical tenant pool here? Any planned neighborhood developments (good or bad) we should know about?
- What's the average days-on-market for RENTAL listings here right now (not sales)? A rising rental-DOM trend means longer vacancies and softer asking-rent achievability than the comps imply.
- What's the recent tenant-quality profile in this submarket — average credit score on applications, eviction rate, late-payment / NSF rate, and stable-employment percentage? A property-management company in the area should have these aggregated.
- How much new for-sale + rental construction is in the pipeline within 1–3 miles? Heavy new supply typically softens prices + rents 12–24 months out; constrained supply supports both.
Investment metrics
- 1% rule
- 0.96% ✗
- Cap rate
- 6.64%
- Cash-on-cash
- 1.24%
- DSCR
- 1.06
- GRM
- 8.6
CMA / ARV
- ARV (on-the-fly)
- $145,632
- Comps found
- 10
Show comp detail 10 sales within ~0.75 mi
| Address | Dist | Beds/Ba | Sqft | Sold | Price | $/sf | Match |
|---|---|---|---|---|---|---|---|
| 604 SW 8th St | 0.00mi | 3/2.0 | 1,776 (0%) | 0mo | $145,000 | $82 | 100 |
| 404 SW 10th St | 0.17mi | 4/2.0 (+1) | 1,727 (-3%) | 3mo | $232,000 | $134 | 80 |
| 310 SW 5th Ave | 0.30mi | 3/2.0 | 1,805 (+2%) | 20mo | $123,000 | $68 | 66 |
| 404 S College Ave | 0.42mi | 4/2.5 (+1) | 1,713 (-4%) | 5mo | $204,000 | $119 | 63 |
| 600 SW 7th St | 0.07mi | 2/2.0 (-1) | 1,650 (-7%) | 21mo | $97,595 | $59 | 63 |
| 308 SE 4th St St | 0.56mi | 4/1.5 (+1) | 1,790 (+1%) | 6mo | $130,000 | $73 | 61 |
| 301 Oakview Dr | 0.43mi | 4/2.5 (+1) | 1,720 (-3%) | 15mo | $290,000 | $169 | 55 |
| 602 NW 6th St | 0.72mi | 3/2.0 | 1,633 (-8%) | 19mo | $172,500 | $106 | 37 |
| 605 NW 3rd St | 0.57mi | 2/1.5 (-1) | 1,592 (-10%) | 24mo | $130,000 | $82 | 29 |
| 1103 W Main St | 0.53mi | 4/1.5 (+1) | 2,040 (+15%) | 18mo | $140,900 | $69 | 28 |
Match score weights: distance 35% · size 25% · config 20% · recency 20%. Top-matched comps best support the ARV.
Projected returns pro-forma
-3.0% appreciation · 3.0% rent growth · sell at horizon
- IRR
- -14.3%
- Equity multiple
- 0.49×
- Total profit
- $-20,027
- Equity at exit
- $20,860
- IRR
- -5.4%
- Equity multiple
- 0.65×
- Total profit
- $-13,883
- Equity at exit
- $12,096
Cash invested: $39,172 (down + closing). Projections, not guarantees.
Landlord ↔ Tenant lean methodology
- Overall (STATE)
- 43 Moderately Tenant-Leaning
- State Illinois
- 43 Moderately Tenant-Leaning · D+7
- County
- — inherits STATE
- City
- — inherits STATE
ZIP-level market 61231
- Home prices YoY
- -33.0%
- Active inventory
- 41
- Price-to-rent
- 8.6×
Monthly cashflow live
- Estimated rent
- $1,348 medium interval (Pro) →
- Mortgage (P&I)
- −$734
- Tax from tax record
- −$232 /mo · $2,789/yr
- Insurance
- −$58
- HOA
- −$0
- Vacancy / Maint / Mgmt
- −$283
- Net cashflow
- $41
Break-even live
UW: 25.0% down · 7.5% · 30yr · 1.5% tax · 5.0% vac · 8.0% maint · 8.0% mgmt
Financing live
Cash to close
- Down payment
- $34,975
- Closing costs
- $4,197
- Reserves months
- —
- Total cash needed
- —
Loan-product check · same deal, 3 products live
Conventional
25% down · 7.5% · 30yr
- Down + closing
- —
- Monthly P&I
- —
- Monthly cashflow
- —
- DSCR
- —
- Eligible?
- —
Personal DTI + credit; lowest rate.
DSCR
20% down · 8.5% · 30yr
- Down + closing
- —
- Monthly P&I
- —
- Monthly cashflow
- —
- DSCR
- —
- Eligible?
- —
No personal income docs; deal must DSCR.
Hard money
10% down · 12.0% · 12mo
- Down + closing
- —
- Monthly P&I
- —
- Monthly cashflow
- —
- DSCR
- —
- Eligible?
- —
Short-term bridge; refi at stabilization.
Listing history 12 events
-
2026-04-16status Pending
-
2021-08-06historical
-
2021-02-16soldstatus $100,000
-
2021-02-11soldstatus $100,000 442-char remark
Show marketing remark (442 chars)
Check out this beautiful home! Walk into the open living, dining and kitchen, very light, airy and perfect for entertaining . The large master bedroom has a spacious walk in closet. Basement features large family room and 3rd non-conforming bedroom. Great outdoor space for entertaining features 2 tier deck and above ground pool, storage shed, and fenced yard . Appliances stay, as is . New roof in 2016. Staging by Out Of the Box Design !
-
2020-12-04$105,000 442-char remark
Show marketing remark (442 chars)
Check out this beautiful home! Walk into the open living, dining and kitchen, very light, airy and perfect for entertaining . The large master bedroom has a spacious walk in closet. Basement features large family room and 3rd non-conforming bedroom. Great outdoor space for entertaining features 2 tier deck and above ground pool, storage shed, and fenced yard . Appliances stay, as is . New roof in 2016. Staging by Out Of the Box Design !
-
2016-02-25soldstatus $90,000
-
2016-02-25soldstatus $90,000
-
2015-10-01$95,000
-
2015-10-01$95,000
-
1998-06-30historical
ⓘ Source: listings_history table (triggers on properties + properties_extension) + one-shot
backfill from property_details.listing_events for pre-trigger history.
Tax reassessment forecast IL · Partial reset (capped growth)
- Current annual tax
- $2,789 · $232/mo
- Projected year-2 tax
- $2,982 · $249/mo
- Expected delta
- +$193/yr (+$16/mo · 6.9%)
ⓘ Screening estimate from a state-policy table — verify with the county assessor before closing.
Climate risk First Street
- Flood 1/10 Low FEMA zone X (unshaded) · 0% chance over 30 yrs
- Wildfire 1/10 Low
- Heat 3/10 Moderate 7 d/yr ≥105°F today · 16 d/yr by 30 yrs out
- Wind 2/10 Low
- Air quality 2/10 Low 2 unhealthy d/yr today · 2 by 30 yrs out
Nearby sold comps map
Loading sold comps map…
Walkable amenities ~0.75 mi
Loading nearby amenities…
Taxation est. · year 1
- Rental income
- $16,177
- − Mortgage interest
- −$7,837
- − Property taxes
- −$2,789
- − Insurance
- −$700
- − Repairs & maintenance
- −$1,294
- − Management
- −$1,294
- − Depreciation
- −$4,070
- Taxable loss
- −$1,806
- Est. tax savings @ 24.0%
- +$434
- After-tax cash flow
- $921/yr
For passive investors: Depreciation is non-cash, so a rental often shows a tax loss while cash-flowing — sheltering income. Rental losses are passive: they offset passive income freely, and up to $25,000/yr can offset ordinary (W-2) income if you actively participate and your MAGI is under $100k (phasing out to $0 by $150k); unused losses carry forward. On sale, claimed depreciation is recaptured at up to 25%, and gains may owe capital-gains tax (a 1031 exchange can defer both). Figures are a year-1 estimate at your 24.0% rate — not tax advice; consult a CPA.
Schools (NCES district)
- District
- Mercer County School District 404
- NCES district ID
- 1701395
- Math proficiency
- 14% ▼ -5.00%
- Reading proficiency
- 24% ▼ -9.00%
- Median HH income
- $46,980
- Composite
- 16.76/100
- National rank
- #9158
- State rank
- #439 of 620 in IL
Livability — Aledo
- Score
- 69/100
- State rank
- #390
- US rank
- #8198
Category grades
Schools grade is shown separately in the Schools card above.
Census & demographics
- Census place
- Aledo, IL
- Population (ZIP)
- 4,958
Population outlook (Mercer County) Hauer SSP2
- Today (2025)
- 14,595 people
- By 2030
- 13,846 · -5.1%
- By 2040
- 12,335 · -15.5%
- By 2050
- 10,893 · -25.4%
- By 2075
- 8,238 · -43.6%
- By 2100
- 6,111 · -58.1%
Race, ethnicity, and origin ACS 2023
- Neighborhood character
- Predominantly White (93%)
- Race & ethnicity
- White 93% Hispanic / Latino 4% Two or more races 3% Black 1%
- Common ancestry
- Lithuanian 2% Danish 2% Iranian 1%
- Foreign-born
- 1% · Canada
- Languages at home
- 96% English-only · Spanish 3% Arabic 1%
Political lean MEDSL · Mercer
- 2024 margin
- Strong R (+27.1) · D 35.4% · R 62.5% · Other 2.2%
- 2008→2024 swing
- -39.0pp toward R · 2008: 11.9pp · 2024: -27.1pp
- All cycles
- 2024: R+27.1 2020: R+24.0 2016: R+20.7 2012: D+7.4 2008: D+11.9
Not yet ingested
- Civics
- —
Market trends
- HPI YoY
- ▼ -69.03%
- Current HPI
- 140.0
- Rent YoY
- —
- Metro
- —
- State GDP YoY
- ▲ 1.59%
- F500 in state
- 60
Industry mix (Fortune 500 HQ in IL)
| Industry | F500 HQs | Revenue |
|---|---|---|
| Insurance | 4 | $201B |
|
||
| Consumer Goods | 4 | $87B |
|
||
| Industrial Machinery | 3 | $64B |
|
||
| Healthcare | 2 | $55B |
|
||
| Retail / Pharmacy | 1 | $148B |
|
||
| Agriculture / Food | 1 | $86B |
|
||
Price history
+5.3% since first listed12 events — show timeline
- 2026-04-16 Pending — MRED as Distributed by MLS Grid
- 2021-08-06 Listing Removed — RMLSA as Distributed by MLS Grid
- 2021-02-16 Sold (Public Records) $100,000 Public Records
- 2021-02-11 Sold (MLS) $100,000 MRED as Distributed by MLS Grid
- 2021-02-11 Sold (MLS) $100,000 RMLSA as Distributed by MLS Grid
- 2020-12-04 Listed $105,000 MRED as Distributed by MLS Grid
- 2020-12-04 Listed $105,000 RMLSA as Distributed by MLS Grid
- 2016-02-25 Sold (MLS) $90,000 RMLSA as Distributed by MLS Grid
- 2016-02-25 Sold (MLS) $90,000 MRED as Distributed by MLS Grid
- 2015-10-01 Listed $95,000 RMLSA as Distributed by MLS Grid
- 2015-10-01 Listed $95,000 MRED as Distributed by MLS Grid
- 1998-06-30 Listing Removed — MRED as Distributed by MLS Grid
Property tax history
+1.6%/yrLatest (2024): $2,789 · +120.1% YoY. Source: county tax records.
Cash-flow waterfall
monthlySold comps — $/sqft
last 12 mo · ≤1 miLoading sold comps…