5722 Screech Owl Dr · San Antonio, TX
Flood risk 1/10 · Minimal
- FEMA flood zone
- X (unshaded)
- Chance of flooding over 30 yrs
- 0.0%
- Est. flood insurance / yr
- $507 – $1,088
Fire risk 3/10 · Minor
- Est. fire insurance / yr
- $1,222 – $2,270
Heat risk 8/10 · Major
- Hot days now (above 109°F)
- 7 days/yr
- Hot days in 30 yrs
- 22 days/yr
Wind risk 8/10 · Major
- Chance of severe wind over 30 yrs
- 80.0%
Air-quality risk 1/10 · Minimal
- Unhealthy air days now
- 0 days/yr
- Unhealthy air days in 30 yrs
- 0 days/yr
Risk factors via First Street. Map © Google.
Why this score? — see what drove the D grade
The composite is a weighted blend of 9 inputs, each scored 0–100. Each bar is that input's sub-score; the figure is the points it added to the 100-point composite (weight × sub-score).
- Cash flow +13.4/30.0
- ARV discount +8.1/15.0
- DSCR +4.0/10.0
- Livability +4.0/5.0
- Condition / age +4.0/5.0
- 1% rule +3.8/10.0
- Rent growth +3.6/5.0
- Schools +1.9/10.0
- Appreciation +0.0/10.0
$196,499
🖨 Deal sheet (PDF) 📄 Offer letter ✓ Due diligence
Listing remarks
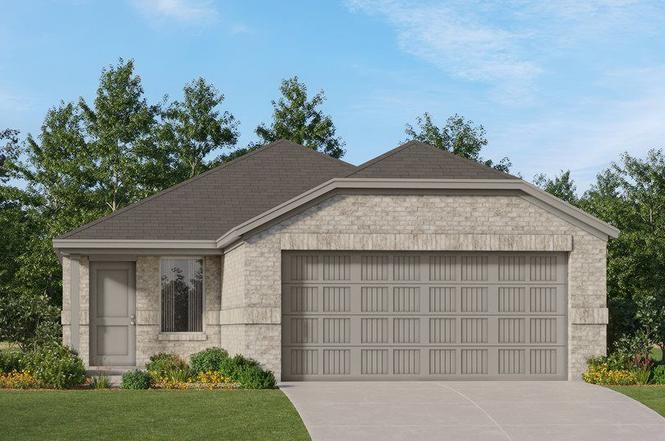
This single-level home showcases a spacious open floorplan shared between the kitchen, dining area and family room for easy entertaining, along with access to an outdoor space. An owner's suite enjoys a private location in a rear corner of the home, complemented by an en-suite bathroom and walk-in closet. There are two secondary bedrooms at the front of the home, ideal for household members and overnight guests.
Key facts
- Walk-in closet
- Open floorplan
- Secondary bedrooms
Tags
Property features AI
Finance
- Other: Address: 5722 Screech Owl Dr, San Antonio, TX 78222
- Financial info: List price $203,499
Exterior
- Parking: 2-car garage / 2 total parking spaces
- Home design: Single-family property; Idlewood plan
- Exterior features: Living area approximately 1,411
Interior
- Bedrooms: 3 bedrooms
- Bathrooms: 2 full bathrooms
- Interior features: Spec home (new construction); Idlewood floor plan
Neighborhood map
What this means for you Summary
Snapshot
- This is a 3-bed/2.0-bath single-family listed at $196k. Condition is rated good.
Deal economics
- At list price, monthly cash flow is $5 ($57/yr) — positive.
- The deal already cash-flows at list — no discount required.
- To meet the 1% rule (rent ≥ 1% of price), the offer needs to be $172k (12.2% below list).
- Recommended offer: $172k (12.2% below list) — sets the bar for 1% rule.
- Cap rate 6.3% vs local median 3.8% in San Antonio — top-decile yield for the area; either an underpriced asset or a hidden risk that comps aren't pricing in. Stress-test before assuming the spread holds.
Location & tenants
- Location reads 80/100 on livability (#31 in TX, #1,616 nationally) — a professional / high-income tenant draw. Strengths: amenities A+, commute A+, cost of living A+; Watch: crime F.
- East Central ISD (rural): math 16% / reading 25% proficiency, ranked #758 of 826 in TX (top 92%) — low school quality limits family demand, transient renter base, plan for 1-2y turnover; 61% free/reduced lunch — lower-income household profile, screen leases tightly.
- Zoned schools: Harmony El (math 21% / reading 17%, grade F, #3,739 of 4,322 statewide, top 87%, 684 students, 75% FRL); Legacy Middle (math 13% / reading 24%, grade F, #1,478 of 1,662 statewide, top 90%, 1,137 students, 58% FRL); East Central H S (math 21% / reading 28%, grade F, #1,264 of 1,632 statewide, top 82%, 3,252 students, 52% FRL) — zoned schools at 62% FRL track the district average.
- Market conditions: Rents rising fast (+4.3%/yr); 444 active listings in the ZIP; 16 comparable units currently listed for rent nearby; rentals at typical pace (median 26d on market — plan ~3-4 weeks tenant-placement turnaround); 8,308 units permitted in Bexar County in 2024 (2,506 in 5+ unit buildings).
- This rent runs 31% of the median local income ($66k/yr) — at the standard rent-burdened threshold; future hikes will face affordability resistance.
Forward outlook
- Local home prices are declining (-3.0%/yr); year-one equity from $1k of loan paydown is wiped out by about $6k of value loss. Plan a longer hold.
- Bexar County population projected at +50% by 2050 — long-run rental-demand tailwind backs the buy-and-hold thesis.
Negotiation context
- Only 6 days on market — expect competitive offers; lowballing is unlikely to land.
Risks & watch-outs
- Climate carrying-cost: severe wind risk, 80% chance of damaging wind over 30y; extreme-heat days projected 7→22/yr by 2055 (HVAC capex compounding) — expect insurance premiums to compound above CPI over the hold.
Questions for the listing agent
- Is there a deadline driving the sale (1031 exchange, divorce, estate, relocation)? That informs how much negotiation room exists.
- Crime grade is F in this area — have there been break-ins, vandalism, or insurance claims at this property in the last 3 years? What carrier currently insures it and at what premium?
- The area grade is low — what's the realistic commute time and amenity access for the typical tenant pool here? Any planned neighborhood developments (good or bad) we should know about?
- What's the average days-on-market for RENTAL listings here right now (not sales)? A rising rental-DOM trend means longer vacancies and softer asking-rent achievability than the comps imply.
- What's the recent tenant-quality profile in this submarket — average credit score on applications, eviction rate, late-payment / NSF rate, and stable-employment percentage? A property-management company in the area should have these aggregated.
- How much new for-sale + rental construction is in the pipeline within 1–3 miles? Heavy new supply typically softens prices + rents 12–24 months out; constrained supply supports both.
Investment metrics
- 1% rule
- 0.88% ✗
- Cap rate
- 6.32%
- Cash-on-cash
- 0.10%
- DSCR
- 1.00
- GRM
- 9.5
CMA / ARV
- ARV (on-the-fly)
- $198,951
- Comps found
- 12
Show comp detail 12 sales within ~0.75 mi
| Address | Dist | Beds/Ba | Sqft | Sold | Price | $/sf | Match |
|---|---|---|---|---|---|---|---|
| 8842 Osprey Trl | 0.11mi | 3/2.0 | 1,402 (-1%) | 1mo | $203,999 | $146 | 93 |
| 8875 Osprey Trl | 0.08mi | 3/2.0 | 1,402 (-1%) | 3mo | $191,999 | $137 | 93 |
| 8822 Osprey Trl | 0.14mi | 3/2.0 | 1,411 (0%) | 2mo | $197,999 | $140 | 92 |
| 8818 Osprey Trl | 0.15mi | 3/2.0 | 1,402 (-1%) | 2mo | $198,999 | $142 | 90 |
| 8802 Osprey Trl | 0.18mi | 3/2.0 | 1,402 (-1%) | 2mo | $196,999 | $141 | 89 |
| 8858 Osprey Trl | 0.08mi | 3/2.0 | 1,266 (-10%) | 1mo | $184,999 | $146 | 79 |
| 8838 Osprey Trl | 0.11mi | 3/2.0 | 1,266 (-10%) | 2mo | $188,999 | $149 | 76 |
| 8855 Osprey Trl | 0.17mi | 3/2.0 | 1,266 (-10%) | 2mo | $184,999 | $146 | 73 |
| 8834 Osprey Trl | 0.12mi | 4/2.0 (+1) | 1,575 (+12%) | 1mo | $209,999 | $133 | 69 |
| 8850 Osprey Trl | 0.09mi | 4/2.0 (+1) | 1,600 (+13%) | 1mo | $217,999 | $136 | 68 |
| 8867 Osprey Trl | 0.09mi | 4/2.0 (+1) | 1,600 (+13%) | 2mo | $213,999 | $134 | 66 |
| 8830 Osprey Trl | 0.13mi | 4/2.0 (+1) | 1,600 (+13%) | 2mo | $214,999 | $134 | 65 |
Match score weights: distance 35% · size 25% · config 20% · recency 20%. Top-matched comps best support the ARV.
Projected returns pro-forma
-3.0% appreciation · 4.35% rent growth · sell at horizon
- IRR
- -14.6%
- Equity multiple
- 0.47×
- Total profit
- $-29,139
- Equity at exit
- $29,299
- IRR
- -3.8%
- Equity multiple
- 0.73×
- Total profit
- $-14,865
- Equity at exit
- $16,990
Cash invested: $55,020 (down + closing). Projections, not guarantees.
Landlord ↔ Tenant lean methodology
- Overall (STATE)
- 87 Strongly Landlord-Friendly
- State Texas
- 87 Strongly Landlord-Friendly · R+5
- County
- — inherits STATE
- City
- — inherits STATE
ZIP-level market 78222
- Home prices YoY
- -4.8%
- Rents YoY
- 4.3%
- Active inventory
- 444
- Price-to-rent
- 9.5×
Monthly cashflow live
- Estimated rent
- $1,725 high interval (Pro) →
- Mortgage (P&I)
- −$1,030
- Tax est. 1.5%
- −$246 /mo · $2,947/yr
- Insurance
- −$82
- HOA
- −$0
- Vacancy / Maint / Mgmt
- −$362
- Net cashflow
- $5
Break-even live
Sensitivity live
| Price | -10% $141 | -5% $73 | +0% $5 | +5% $-63 | +10% $-131 |
|---|---|---|---|---|---|
| Rent | -10% $-132 | -5% $-63 | +0% $5 | +5% $73 | +10% $141 |
| Rate | -1.0pp $104 | -0.5pp $55 | base $5 | +0.5pp $-46 | +1.0pp $-98 |
UW: 25.0% down · 7.5% · 30yr · 1.5% tax · 5.0% vac · 8.0% maint · 8.0% mgmt
Financing live
Cash to close
- Down payment
- $49,125
- Closing costs
- $5,895
- Reserves months
- —
- Total cash needed
- —
Loan-product check · same deal, 3 products live
Conventional
25% down · 7.5% · 30yr
- Down + closing
- —
- Monthly P&I
- —
- Monthly cashflow
- —
- DSCR
- —
- Eligible?
- —
Personal DTI + credit; lowest rate.
DSCR
20% down · 8.5% · 30yr
- Down + closing
- —
- Monthly P&I
- —
- Monthly cashflow
- —
- DSCR
- —
- Eligible?
- —
No personal income docs; deal must DSCR.
Hard money
10% down · 12.0% · 12mo
- Down + closing
- —
- Monthly P&I
- —
- Monthly cashflow
- —
- DSCR
- —
- Eligible?
- —
Short-term bridge; refi at stabilization.
Rent comps 16 comps
| Address | Beds | Baths | Sqft | Rent | $/sqft | DOM | Units | Dist |
|---|---|---|---|---|---|---|---|---|
| 5727 Coopers Xing San Antonio, TX | 3.0 | 2.0 | 1127 | $2,400 | $2.13 | 23d | 1 | 0.19mi |
| 8563 Redhawk Loop San Antonio, TX | 3.0 | 2.5 | 1788 | $1,800 | $1.01 | 16d | 1 | 0.45mi |
| 5107 Moni Rock Dr San Antonio, TX | 3.0 | 2.5 | 1529 | $1,585 | $1.04 | 25d | 1 | 1.07mi |
| 10319 Clearwater Way San Antonio, TX | 3.0 | 2.5 | 1529 | $1,500 | $0.98 | 6d | 1 | 1.10mi |
| 10519 Green Rock Dr San Antonio, TX | 4.0 | 2.5 | 1643 | $1,900 | $1.16 | 45d | 1 | 1.13mi |
| 10332 Green Br San Antonio, TX | 3.0 | 2.5 | 1529 | $1,550 | $1.01 | 25d | 1 | 1.14mi |
| 10531 Green Rock Dr San Antonio, TX | 3.0 | 2.5 | 1849 | $1,700 | $0.92 | 45d | 1 | 1.15mi |
| 10534 Green Rock Dr San Antonio, TX | 3.0 | 2.5 | 1311 | $1,700 | $1.30 | 45d | 1 | 1.16mi |
| 10366 Clearwater Way San Antonio, TX | 3.0 | 2.5 | 1529 | $1,550 | $1.01 | 12d | 1 | 1.16mi |
| 5322 Freshwater Way San Antonio, TX | 3.0 | 2.5 | 1529 | $1,525 | $1.00 | 25d | 1 | 1.24mi |
| 10418 Clearwater Way San Antonio, TX | 3.0 | 2.5 | 1529 | $1,550 | $1.01 | 45d | 1 | 1.25mi |
| 10431 Clearwater Way San Antonio, TX | 3.0 | 2.5 | 1529 | $1,550 | $1.01 | 45d | 1 | 1.27mi |
| 10447 Clearwater Way San Antonio, TX | 3.0 | 2.5 | 1420 | $1,500 | $1.06 | 45d | 1 | 1.30mi |
| 10454 Clearwater Way San Antonio, TX | 3.0 | 2.5 | 1239 | $1,425 | $1.15 | 12d | 1 | 1.31mi |
| 10471 Clearwater Way San Antonio, TX | 3.0 | 2.5 | 1529 | $1,550 | $1.01 | 25d | 1 | 1.34mi |
| 7814 Annex St San Antonio, TX | 3.0 | 2.0 | 1459 | $1,600 | $1.10 | 25d | 1 | 1.47mi |
Listing history 5 events
-
2026-06-21days on market $196,499 Active 6 DOM
-
2026-06-18days on market $196,499 Active 3 DOM
-
2026-06-17pricedays on market $196,499 Active 2 DOM
-
2026-06-15remarks 415-char remark
-
2026-06-15$203,499 Active 1 DOM
ⓘ Source: listings_history table (triggers on properties + properties_extension) + one-shot
backfill from property_details.listing_events for pre-trigger history.
Climate risk First Street
- Flood 1/10 Low FEMA zone X (unshaded) · 0% chance over 30 yrs
- Wildfire 3/10 Moderate
- Heat 8/10 Severe 7 d/yr ≥109°F today · 22 d/yr by 30 yrs out
- Wind 8/10 Severe 80% chance of damaging wind over 30 yrs
- Air quality 1/10 Low 0 unhealthy d/yr today · 0 by 30 yrs out
Nearby sold comps map
Loading sold comps map…
Walkable amenities ~0.75 mi
Loading nearby amenities…
Taxation est. · year 1
- Rental income
- $20,699
- − Mortgage interest
- −$11,007
- − Property taxes
- −$2,947
- − Insurance
- −$982
- − Repairs & maintenance
- −$1,656
- − Management
- −$1,656
- − Depreciation
- −$5,716
- Taxable loss
- −$3,266
- Est. tax savings @ 24.0%
- +$784
- After-tax cash flow
- $841/yr
For passive investors: Depreciation is non-cash, so a rental often shows a tax loss while cash-flowing — sheltering income. Rental losses are passive: they offset passive income freely, and up to $25,000/yr can offset ordinary (W-2) income if you actively participate and your MAGI is under $100k (phasing out to $0 by $150k); unused losses carry forward. On sale, claimed depreciation is recaptured at up to 25%, and gains may owe capital-gains tax (a 1031 exchange can defer both). Figures are a year-1 estimate at your 24.0% rate — not tax advice; consult a CPA.
Condition & rehab AI · 12 photos
This single-level home features a spacious open floorplan with modern finishes and a well-maintained exterior. It is in good condition and ready for a new owner to make it their own.
Value-add opportunities
- Both Painting the exterior and interior walls — Fresh paint can enhance curb appeal and interior aesthetics
- Both Updating the flooring in the bathrooms — Modern flooring can improve the look and feel of the bathrooms
- Both Upgrading the kitchen appliances — Newer appliances can increase the home's appeal and functionality
- Both Adding smart home features — Smart home features can increase the home's value and convenience
Renovation cost estimate screening
Value-add ROI direction
- Both Painting the exterior and interior walls — Fresh paint can enhance curb appeal and interior aesthetics ↑
- Both Updating the flooring in the bathrooms — Modern flooring can improve the look and feel of the bathrooms ↑
- Both Upgrading the kitchen appliances — Newer appliances can increase the home's appeal and functionality ↑
- Both Adding smart home features — Smart home features can increase the home's value and convenience ↑
ⓘ Cost ranges are severity-bucket heuristics (US national rule-of-thumb). Get contractor quotes + a written scope before underwriting a rehab budget.
Schools (NCES district)
- District
- East Central ISD
- NCES district ID
- 4817850
- Math proficiency
- 16% ▼ -12.00%
- Reading proficiency
- 25% ▼ -6.00%
- Median HH income
- $53,941
- Composite
- 18.67/100
- National rank
- #8887
- State rank
- #758 of 826 in TX
Livability — San Antonio
- Score
- 80/100
- State rank
- #31
- US rank
- #1616
Category grades
Schools grade is shown separately in the Schools card above.
Census & demographics
- County
- Bexar County · 1,990,555 people
- City population
- 1,806,925
- Metro
- San Antonio-New Braunfels, TX
- Population (ZIP)
- 26,476
- Household income
- $66,362
- Rent vs Own
- Severe rent burden
- 686.0
Population outlook (Bexar County) Hauer SSP2
- Today (2025)
- 2,336,851 people
- By 2030
- 2,560,728 · +9.6%
- By 2040
- 3,020,569 · +29.3%
- By 2050
- 3,493,522 · +49.5%
- By 2075
- 4,668,459 · +99.8%
- By 2100
- 5,533,242 · +136.8%
Race, ethnicity, and origin ACS 2023
- Neighborhood character
- Majority Hispanic (64%)
- Race & ethnicity
- Hispanic / Latino 64% Two or more races 26% White 19% Black 14% Asian 1%
- Hispanic origin (detail)
- Mexican 55%
- Common ancestry
- Romanian 1% Italian 1% Slovak 1%
- Foreign-born
- 14% · Canada
- Languages at home
- 61% English-only · Spanish 37% Arabic 1%
Political lean MEDSL · Bexar
- 2024 margin
- Lean D (+9.8) · D 54.3% · R 44.6% · Other 1.1%
- 2008→2024 swing
- +4.2pp toward D · 2008: 5.6pp · 2024: 9.8pp
- All cycles
- 2024: D+9.8 2020: D+18.2 2016: D+13.5 2012: D+4.6 2008: D+5.6
Not yet ingested
- Civics
- —
Market trends
- HPI YoY
- ▼ -14.18%
- Current HPI
- 278.8429
- Rent YoY
- ▲ 4.35%
- Metro
- San Antonio-New Braunfels, TX
- State GDP YoY
- ▲ 3.95%
- F500 in state
- 110
Industry mix (Fortune 500 HQ in TX)
| Industry | F500 HQs | Revenue |
|---|---|---|
| Energy | 16 | $1,198B |
|
||
| Technology | 5 | $198B |
|
||
| Engineering / Construction | 4 | $72B |
|
||
| Energy Services | 3 | $60B |
|
||
| Utilities | 3 | $41B |
|
||
| Healthcare | 2 | $330B |
|
||
Cash-flow waterfall
monthlySold comps — $/sqft
last 12 mo · ≤1 miLoading sold comps…