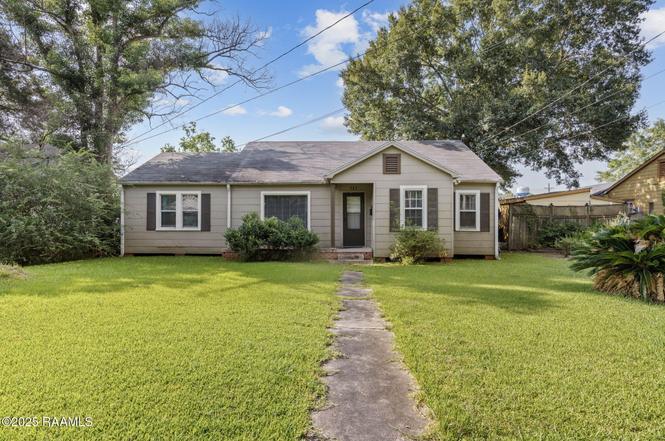
717 W Northern Ave · Crowley, LA
Flood risk 1/10 · Minimal
- FEMA flood zone
- X (shaded)
- Chance of flooding over 30 yrs
- 0.0%
- Est. flood insurance / yr
- $507 – $1,088
Fire risk 1/10 · Minimal
- Est. fire insurance / yr
- $1,269 – $2,357
Heat risk 8/10 · Major
- Hot days now (above 109°F)
- 7 days/yr
- Hot days in 30 yrs
- 20 days/yr
Wind risk 9/10 · Severe
- Chance of severe wind over 30 yrs
- 99.0%
Air-quality risk 1/10 · Minimal
- Unhealthy air days now
- 0 days/yr
- Unhealthy air days in 30 yrs
- 0 days/yr
Risk factors via First Street. Map © Google.
Why this score? — see what drove the D+ grade
The composite is a weighted blend of 9 inputs, each scored 0–100. Each bar is that input's sub-score; the figure is the points it added to the 100-point composite (weight × sub-score).
- Cash flow +15.1/30.0
- ARV discount +14.4/15.0
- DSCR +4.6/10.0
- 1% rule +3.3/10.0
- Schools +3.2/10.0
- Livability +3.2/5.0
- Rent growth +2.5/5.0
- Condition / age +2.5/5.0
- Appreciation +0.0/10.0
$145,000
🖨 Deal sheet (PDF) 📄 Offer letter ✓ Due diligence
Listing remarks
Welcome to your next home in the heart of Crowley! This 3-bedroom, 2-bathroom property blends comfort and functionality with plenty of charm. Step inside to find a spacious living area perfect for relaxing or entertaining, a well-appointed kitchen with ample counter space, and a thoughtful layout that provides privacy and convenience. The primary suite includes an en-suite bathroom and generous closet space, while the additional bedrooms offer flexibility for guests, a home office, or hobbies. Outside, enjoy a nice-sized yard ideal for outdoor gatherings or quiet evenings. Conveniently located near local shops, dining, and schools, this home is ready for its next chapter!
Key facts
- 0.5 acre lot
- 2 parking spots
- Listed 318 days
Property features AI
Exterior
- Parking: Covered carport with 2 spaces; Total parking for 2 vehicles
- Utilities: Public sewer; Electric service: CLECO
- Home design: Single family residence
- Exterior features: Wood siding
Interior
- Bathrooms: 2 full bathrooms
- Interior features: Central heating; Central air conditioning
Neighborhood map
What this means for you Summary
Snapshot
- This is a 3-bed/2.0-bath single-family listed at $145k.
Deal economics
- At list price, monthly cash flow is $48 ($570/yr) — positive.
- The deal already cash-flows at list — no discount required.
- To meet the 1% rule (rent ≥ 1% of price), the offer needs to be $121k (16.5% below list).
- Recommended offer: $121k (16.5% below list) — sets the bar for 1% rule.
- Cap rate 6.7% vs local median 3.5% in Crowley — top-decile yield for the area; either an underpriced asset or a hidden risk that comps aren't pricing in. Stress-test before assuming the spread holds.
Location & tenants
- Location reads 65/100 on livability (#145 in LA) — a middle-class / working-renter tenant base. Strengths: cost of living A+, health & safety A+, housing A-; Watch: crime F, amenities F, commute F.
- Acadia Parish (rural): math 32% / reading 44% proficiency, ranked #28 of 98 in LA (top 29%) — families likely to look elsewhere, expect single-tenant / working-renter base with shorter leases; 62% free/reduced lunch — lower-income household profile, screen leases tightly.
- Zoned schools: North Crowley Elementary School (math 27% / reading 37%, grade F, #307 of 646 statewide, top 49%, 310 students, 89% FRL); Crowley Middle School (math 9% / reading 17%, grade F, #189 of 218 statewide, top 87%, 449 students, 83% FRL); Crowley High School (math 22% / reading 27%, grade F, #153 of 265 statewide, top 62%, 536 students, 76% FRL) — zoned schools average 83% FRL vs 62% district-wide (21 pts higher); higher-poverty schools than district average — tighter screening recommended.
- Zoned-school proficiency averages 23% at this address vs 38% district-wide (-15 pts) — the specific schools serving this property underperform the Acadia Parish average; the district grade overstates school quality for this exact location.
- Market conditions: 96 active listings in the ZIP; 137 units permitted in Acadia Parish in 2024 (0 in 5+ unit buildings).
Forward outlook
- Local home prices are declining (-3.0%/yr); year-one equity from $1k of loan paydown is wiped out by about $4k of value loss. Plan a longer hold.
Negotiation context
- It's been on market 319 days — a 12% lower offer ($128k) is reasonable based on typical stale-listing flexibility.
- 4 sale attempts since 25y ago; this cycle's ask has dropped $15k (9%) from the opening price — seller is motivated, your offer sets the floor, not the list.
Risks & watch-outs
- Climate carrying-cost: severe wind risk, 99% chance of damaging wind over 30y; extreme-heat days projected 7→20/yr by 2055 (HVAC capex compounding) — expect insurance premiums to compound above CPI over the hold.
Questions for the listing agent
- It's been on market 319 days. Have you received any prior offers? Is the seller open to a 17% concession, seller financing, or rate buy-down credit?
- Why hasn't it sold? Are there any deal-killer items the seller is aware of (foundation, flood, title, zoning, code violations)?
- Is there a deadline driving the sale (1031 exchange, divorce, estate, relocation)? That informs how much negotiation room exists.
- Schools are B-rated — typically a magnet for longer-tenancy family renters. What's the average tenant stay here, and is there a school-zone premium baked into asking?
- Crime grade is F in this area — have there been break-ins, vandalism, or insurance claims at this property in the last 3 years? What carrier currently insures it and at what premium?
- The area grade is low — what's the realistic commute time and amenity access for the typical tenant pool here? Any planned neighborhood developments (good or bad) we should know about?
- What's the average days-on-market for RENTAL listings here right now (not sales)? A rising rental-DOM trend means longer vacancies and softer asking-rent achievability than the comps imply.
- What's the recent tenant-quality profile in this submarket — average credit score on applications, eviction rate, late-payment / NSF rate, and stable-employment percentage? A property-management company in the area should have these aggregated.
- How much new for-sale + rental construction is in the pipeline within 1–3 miles? Heavy new supply typically softens prices + rents 12–24 months out; constrained supply supports both.
Investment metrics
- 1% rule
- 0.83% ✗
- Cap rate
- 6.69%
- Cash-on-cash
- 1.40%
- DSCR
- 1.06
- GRM
- 10.0
CMA / ARV
- ARV (on-the-fly)
- $171,268
- Comps found
- 4
Show comp detail 4 sales within ~0.75 mi
| Address | Dist | Beds/Ba | Sqft | Sold | Price | $/sf | Match |
|---|---|---|---|---|---|---|---|
| 1000 N Avenue D | 0.34mi | 3/2.0 | 1,791 (-2%) | 7mo | $169,000 | $94 | 76 |
| 728 W Northern Ave | 0.04mi | 3/2.0 | 1,600 (-12%) | 13mo | $140,000 | $88 | 67 |
| 1004 William Egan Ave | 0.34mi | 4/2.0 (+1) | 1,620 (-11%) | 4mo | $70,000 | $43 | 58 |
| 109 Festival Dr | 0.70mi | 4/2.0 (+1) | 1,836 (+1%) | 23mo | $211,500 | $115 | 42 |
Match score weights: distance 35% · size 25% · config 20% · recency 20%. Top-matched comps best support the ARV.
Projected returns pro-forma
-3.0% appreciation · 3.0% rent growth · sell at horizon
- IRR
- -14.1%
- Equity multiple
- 0.49×
- Total profit
- $-20,508
- Equity at exit
- $21,620
- IRR
- -5.3%
- Equity multiple
- 0.65×
- Total profit
- $-14,118
- Equity at exit
- $12,537
Cash invested: $40,600 (down + closing). Projections, not guarantees.
Landlord ↔ Tenant lean methodology
- Overall (STATE)
- 90 Strongly Landlord-Friendly
- State Louisiana
- 90 Strongly Landlord-Friendly · R+12
- County
- — inherits STATE
- City
- — inherits STATE
ZIP-level market 70526
- Active inventory
- 96
- Price-to-rent
- 10.0×
Monthly cashflow live
- Estimated rent
- $1,210 medium interval (Pro) →
- Mortgage (P&I)
- −$760
- Tax from tax record
- −$88 /mo · $1,054/yr
- Insurance
- −$60
- HOA
- −$0
- Vacancy / Maint / Mgmt
- −$254
- Net cashflow
- $48
Break-even live
Sensitivity live
| Price | -10% $130 | -5% $89 | +0% $48 | +5% $6 | +10% $-35 |
|---|---|---|---|---|---|
| Rent | -10% $-48 | -5% $0 | +0% $48 | +5% $95 | +10% $143 |
| Rate | -1.0pp $121 | -0.5pp $84 | base $48 | +0.5pp $10 | +1.0pp $-28 |
UW: 25.0% down · 7.5% · 30yr · 1.5% tax · 5.0% vac · 8.0% maint · 8.0% mgmt
Financing live
Cash to close
- Down payment
- $36,250
- Closing costs
- $4,350
- Reserves months
- —
- Total cash needed
- —
Loan-product check · same deal, 3 products live
Conventional
25% down · 7.5% · 30yr
- Down + closing
- —
- Monthly P&I
- —
- Monthly cashflow
- —
- DSCR
- —
- Eligible?
- —
Personal DTI + credit; lowest rate.
DSCR
20% down · 8.5% · 30yr
- Down + closing
- —
- Monthly P&I
- —
- Monthly cashflow
- —
- DSCR
- —
- Eligible?
- —
No personal income docs; deal must DSCR.
Hard money
10% down · 12.0% · 12mo
- Down + closing
- —
- Monthly P&I
- —
- Monthly cashflow
- —
- DSCR
- —
- Eligible?
- —
Short-term bridge; refi at stabilization.
Listing history 28 events
-
2026-06-22days on market $145,000 Active 319 DOM
-
2026-06-21days on market $145,000 Active 318 DOM
-
2026-06-21days on market $145,000 Active 317 DOM
-
2026-06-18days on market $145,000 Active 315 DOM
-
2026-06-17days on market $145,000 Active 314 DOM
-
2026-06-16days on market $145,000 Active 313 DOM
-
2026-06-15days on market $145,000 Active 312 DOM
-
2026-06-13days on market $145,000 Active 310 DOM
-
2026-06-12days on market $145,000 Active 309 DOM
-
2026-06-09days on market $145,000 Active 306 DOM
-
2026-06-08days on market $145,000 Active 305 DOM
-
2026-06-07days on market $145,000 Active 304 DOM
-
2026-06-07days on market $145,000 Active 303 DOM
-
2026-06-04days on market $145,000 Active 300 DOM
-
2026-06-02days on market $145,000 Active 299 DOM
-
2026-06-01days on market $145,000 Active 298 DOM
-
2026-05-31days on market $145,000 Active 297 DOM
-
2026-05-31days on market $145,000 Active 296 DOM
-
2025-09-19price $145,000
-
2025-09-03price $150,000
-
2025-08-20price $155,000
-
2025-08-07$160,000 Active
-
2025-07-31price $160,000
-
2023-11-02soldstatus $149,000
-
2023-11-02$149,000
-
2007-10-17soldstatus $32,436
-
2007-07-23$79,000
-
2001-12-28$69,000
ⓘ Source: listings_history table (triggers on properties + properties_extension) + one-shot
backfill from property_details.listing_events for pre-trigger history.
Tax reassessment forecast LA · Resets to sale price
- Current annual tax
- $1,054 · $88/mo
- Projected year-2 tax
- $1,054 · $88/mo
- Expected delta
- $0/yr ($0/mo · 0.0%)
ⓘ Screening estimate from a state-policy table — verify with the county assessor before closing.
Climate risk First Street
- Flood 1/10 Low FEMA zone X (shaded) · 0% chance over 30 yrs
- Wildfire 1/10 Low
- Heat 8/10 Severe 7 d/yr ≥109°F today · 20 d/yr by 30 yrs out
- Wind 9/10 Extreme 99% chance of damaging wind over 30 yrs
- Air quality 1/10 Low 0 unhealthy d/yr today · 0 by 30 yrs out
Nearby sold comps map
Loading sold comps map…
Walkable amenities ~0.75 mi
Loading nearby amenities…
Taxation est. · year 1
- Rental income
- $14,525
- − Mortgage interest
- −$8,122
- − Property taxes
- −$1,054
- − Insurance
- −$725
- − Repairs & maintenance
- −$1,162
- − Management
- −$1,162
- − Depreciation
- −$4,218
- Taxable loss
- −$1,919
- Est. tax savings @ 24.0%
- +$461
- After-tax cash flow
- $1,031/yr
For passive investors: Depreciation is non-cash, so a rental often shows a tax loss while cash-flowing — sheltering income. Rental losses are passive: they offset passive income freely, and up to $25,000/yr can offset ordinary (W-2) income if you actively participate and your MAGI is under $100k (phasing out to $0 by $150k); unused losses carry forward. On sale, claimed depreciation is recaptured at up to 25%, and gains may owe capital-gains tax (a 1031 exchange can defer both). Figures are a year-1 estimate at your 24.0% rate — not tax advice; consult a CPA.
Schools (NCES district)
- District
- Acadia Parish
- NCES district ID
- 2200030
- Math proficiency
- 32% ▼ -39.00%
- Reading proficiency
- 44% ▼ -32.00%
- Median HH income
- $38,012
- Composite
- 31.65/100
- National rank
- #5929
- State rank
- #28 of 98 in LA
Livability — Crowley
- Score
- 65/100
- State rank
- #145
- US rank
- #12669
Category grades
Schools grade is shown separately in the Schools card above.
Census & demographics
- Census place
- Crowley, LA
- City population
- 16,740
- Population (ZIP)
- 16,740
Population outlook (Acadia County) Hauer SSP2
- Today (2025)
- 63,846 people
- By 2030
- 64,141 · +0.5%
- By 2040
- 63,922 · +0.1%
- By 2050
- 62,263 · -2.5%
- By 2075
- 56,507 · -11.5%
- By 2100
- 46,316 · -27.5%
Race, ethnicity, and origin ACS 2023
- Neighborhood character
- Predominantly White (72%)
- Race & ethnicity
- White 72% Black 20% Two or more races 6% Hispanic / Latino 2%
- Common ancestry
- Lithuanian 14% Italian 2%
- Foreign-born
- 1% · Canada
- Languages at home
- 95% English-only · French/Haitian/Cajun 4% Spanish 1%
Political lean MEDSL · Acadia
- 2024 margin
- Solid R (+64.0) · D 17.6% · R 81.5%
- 2008→2024 swing
- -18.3pp toward R · 2008: -45.7pp · 2024: -64.0pp
- All cycles
- 2024: R+64.0 2020: R+60.3 2016: R+56.7 2012: R+49.8 2008: R+45.7
Not yet ingested
- Civics
- —
Market trends
- HPI YoY
- ▼ -52.11%
- Current HPI
- 88.3686
- Rent YoY
- —
- Metro
- —
- State GDP YoY
- ▲ 3.29%
- F500 in state
- 10
Industry mix (Fortune 500 HQ in LA)
| Industry | F500 HQs | Revenue |
|---|---|---|
| Telecommunications | 2 | $23B |
|
||
| Utilities | 1 | $12B |
|
||
| Wholesale / Distribution | 1 | $5B |
|
||
| Advertising | 1 | $2B |
|
||
Price history
+110.1% since first listed10 events — show timeline
- 2025-09-19 Price Changed $145,000 AcadianaMLS
- 2025-09-03 Price Changed $150,000 AcadianaMLS
- 2025-08-20 Price Changed $155,000 AcadianaMLS
- 2025-08-07 Listed $160,000 AcadianaMLS
- 2025-07-31 Price Changed $160,000 AcadianaMLS
- 2023-11-02 Listed $149,000 AcadianaMLS
- 2023-11-02 Sold (MLS) $149,000 AcadianaMLS
- 2007-10-17 Sold (Public Records) $32,436 Public Records
- 2007-07-23 Listed $79,000 AcadianaMLS
- 2001-12-28 Listed $69,000 AcadianaMLS
Property tax history
+10.0%/yrLatest (2025): $1,054 · +0.3% YoY. Source: county tax records.
Cash-flow waterfall
monthlySold comps — $/sqft
last 12 mo · ≤1 miLoading sold comps…