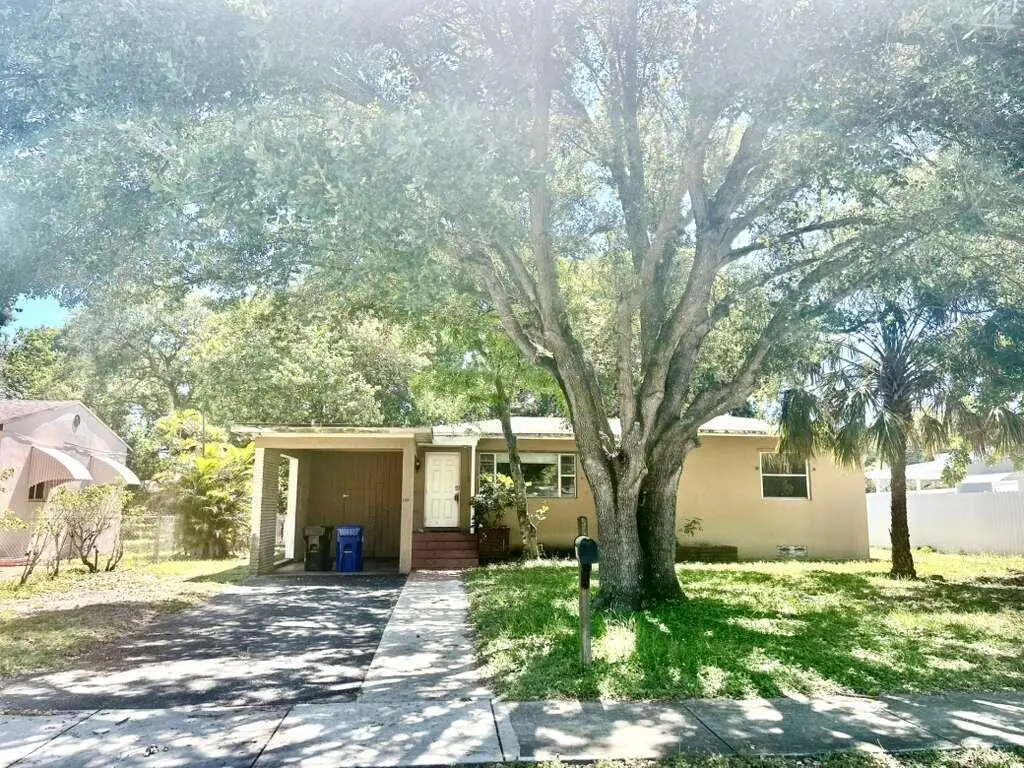
130 Carolina Ave · Fort Lauderdale, FL
Flood risk 1/10 · Minimal
- FEMA flood zone
- X (shaded)
- Chance of flooding over 30 yrs
- 0.0%
- Est. flood insurance / yr
- $507 – $1,088
Fire risk 1/10 · Minimal
- Est. fire insurance / yr
- $947 – $1,759
Heat risk 10/10 · Severe
- Hot days now (above 105°F)
- 6 days/yr
- Hot days in 30 yrs
- 22 days/yr
Wind risk 10/10 · Severe
- Chance of severe wind over 30 yrs
- 99.0%
Air-quality risk 2/10 · Minimal
- Unhealthy air days now
- 2 days/yr
- Unhealthy air days in 30 yrs
- 2 days/yr
Risk factors via First Street. Map © Google.
Why this score? — see what drove the C- grade
The composite is a weighted blend of 9 inputs, each scored 0–100. Each bar is that input's sub-score; the figure is the points it added to the 100-point composite (weight × sub-score).
- ARV discount +15.0/15.0
- Cash flow +14.4/30.0
- 1% rule +4.5/10.0
- DSCR +4.4/10.0
- Schools +4.1/10.0
- Livability +4.1/5.0
- Rent growth +2.8/5.0
- Condition / age +2.5/5.0
- Appreciation +0.0/10.0
$330,000
🖨 Deal sheet 📄 Offer letter ✓ Due diligence
Listing remarks MLS
Fabulous and remodeled 4bed/2bath n Ft. Lauderdale. Brand new appliances, with wood laminate flooring. Freshly painted and in move in ready condition. Great backyard space perfect for entertaining. High desired rental neighborhood which makes great invest ment opportunity! Conveniently located near major highways, shopping, and restaurants, and only minutes from the beach and the ever popular Hard Rock Casino.
Key facts
- 8,755 sq ft lot
- 2 parking spots
- Built 1950
Property features AI
Finance
- Other: Pets allowed with no restrictions
Exterior
- Parking: 2 parking spaces total; Attached carport (1 covered space); Driveway
- Security: Smoke detectors
- Utilities: Public water; Public sewer; Other utilities
- Home design: Single-family residence; One story; Entry level: 1; Faces west; Resale condition
- Construction: Built with stucco and CBS; Barrel roof; Slab foundation
- Exterior features: Back yard fencing (fenced); Other detached structure(s); City street frontage; Concrete road surface; Publicly maintained road; Not waterfront
Interior
- Bedrooms: 4 bedrooms on the main level
- Flooring: Tile; Wood; Other
- Bathrooms: 2 full bathrooms (main level)
- Heating & cooling: Central heating; Central air; Ceiling fans
- Interior features: Walk-in closets; Closet cabinetry; Satellite dish; Unfurnished; Blinds
- Laundry & utility: Washer hookup
Neighborhood map
What this means for you Summary
Snapshot
- This is a 3-bed/1.0-bath single-family listed at $330k.
Deal economics
- At list price, monthly cash flow is $64 ($767/yr) — positive.
- The deal already cash-flows at list — no discount required.
- To meet the 1% rule (rent ≥ 1% of price), the offer needs to be $312k (5.3% below list).
- Recommended offer: $312k (5.3% below list) — sets the bar for 1% rule.
- Cap rate 6.5% vs local median 2.2% in Fort Lauderdale — top-decile yield for the area; either an underpriced asset or a hidden risk that comps aren't pricing in. Stress-test before assuming the spread holds.
Location & tenants
- Location reads 82/100 on livability (#78 in FL, #1,293 nationally) — a professional / high-income tenant draw. Strengths: crime A+, amenities A+, health & safety A+; Watch: cost of living D-.
- Broward (suburban): math 42% / reading 53% proficiency, ranked #46 of 73 in FL (top 63%) — families likely to look elsewhere, expect single-tenant / working-renter base with shorter leases.
- Zoned schools: Westwood Heights Elementary School (math 18% / reading 26%, grade F, #2,080 of 2,144 statewide, top 97%, 522 students, 87% FRL); Parkway Middle School (math 25% / reading 40%, grade F, #443 of 571 statewide, top 78%, 1,198 students, 83% FRL); South Plantation High School (math 22% / reading 46%, grade F, #394 of 667 statewide, top 60%, 2,224 students, 59% FRL) — zoned schools average 76% FRL vs 51% district-wide (25 pts higher); higher-poverty schools than district average — tighter screening recommended.
- Zoned-school proficiency averages 30% at this address vs 48% district-wide (-18 pts) — the specific schools serving this property underperform the Broward average; the district grade overstates school quality for this exact location.
- Market conditions: Rents rising (+1.3%/yr); 412 active listings in the ZIP; 40 comparable units currently listed for rent nearby; rentals at typical pace (median 24d on market — plan ~3-4 weeks tenant-placement turnaround); solid renter incomes; 2,111 units permitted in Broward County in 2024 (1,265 in 5+ unit buildings).
Forward outlook
- Local home prices are declining (-3.0%/yr); year-one equity from $2k of loan paydown is wiped out by about $10k of value loss. Plan a longer hold.
- Broward County population projected at +34% by 2050 — long-run rental-demand tailwind backs the buy-and-hold thesis.
Negotiation context
- Only 2 days on market — expect competitive offers; lowballing is unlikely to land.
- 2 sale attempts since 12y ago with the ask held roughly flat each time — persistent listings suggest the price (not the market) is what's stuck; bring a comps-based counter.
- Current owner paid $150k; list at $330k implies a 120% gain — meaningful room to come down on a strong offer.
Risks & watch-outs
- Watch-outs: built in 1950 — expect roof / HVAC / electrical / plumbing capex.
- Climate carrying-cost: severe wind risk, 99% chance of damaging wind over 30y; extreme-heat days projected 6→22/yr by 2055 (HVAC capex compounding) — expect insurance premiums to compound above CPI over the hold.
Questions for the listing agent
- Built in 1950 — when were the roof, HVAC, electrical panel, plumbing, and water heater last replaced?
- Is there a deadline driving the sale (1031 exchange, divorce, estate, relocation)? That informs how much negotiation room exists.
- Schools are B-rated — typically a magnet for longer-tenancy family renters. What's the average tenant stay here, and is there a school-zone premium baked into asking?
- What's the average days-on-market for RENTAL listings here right now (not sales)? A rising rental-DOM trend means longer vacancies and softer asking-rent achievability than the comps imply.
- What's the recent tenant-quality profile in this submarket — average credit score on applications, eviction rate, late-payment / NSF rate, and stable-employment percentage? A property-management company in the area should have these aggregated.
- How much new for-sale + rental construction is in the pipeline within 1–3 miles? Heavy new supply typically softens prices + rents 12–24 months out; constrained supply supports both.
Investment metrics
- 1% rule
- 0.95% ✗
- Cap rate
- 6.53%
- Cash-on-cash
- 0.83%
- DSCR
- 1.04
- GRM
- 8.8
CMA / ARV
- ARV (on-the-fly)
- $403,712
- Comps found
- 9
Show comp detail 9 sales within ~0.75 mi
| Address | Dist | Beds/Ba | Sqft | Sold | Price | $/sf | Match |
|---|---|---|---|---|---|---|---|
| 680 SW 31st Ave | 0.49mi | 3/2.0 | 1,319 (-1%) | 1mo | $350,000 | $265 | 71 |
| 2741 SW 2nd Ct | 0.47mi | 3/2.0 | 1,335 (+0%) | 9mo | $525,000 | $393 | 66 |
| 3100 NW 4th Ct | 0.40mi | 2/1.0 (-1) | 1,393 (+5%) | 5mo | $235,000 | $169 | 64 |
| 510 SW 29th Ave | 0.43mi | 3/2.0 | 1,370 (+3%) | 10mo | $485,000 | $354 | 62 |
| 201 SW 28th Ter | 0.27mi | 2/1.0 (-1) | 1,299 (-2%) | 23mo | $395,000 | $304 | 60 |
| 415 NW 29th Ave | 0.47mi | 3/2.0 | 1,232 (-7%) | 6mo | $400,000 | $325 | 57 |
| 3490 NW 3rd St | 0.54mi | 3/2.0 | 1,302 (-2%) | 24mo | $450,000 | $346 | 48 |
| 213 NW 28th Ave | 0.51mi | 3/2.0 | 1,466 (+10%) | 10mo | $389,900 | $266 | 47 |
| 3640 NW 4th St | 0.74mi | 3/1.0 | 1,140 (-14%) | 7mo | $340,000 | $298 | 36 |
Match score weights: distance 35% · size 25% · config 20% · recency 20%. Top-matched comps best support the ARV.
Projected returns pro-forma
-3.0% appreciation · 1.3% rent growth · sell at horizon
- IRR
- -17.0%
- Equity multiple
- 0.41×
- Total profit
- $-54,537
- Equity at exit
- $49,204
- IRR
- -12.4%
- Equity multiple
- 0.32×
- Total profit
- $-62,588
- Equity at exit
- $28,532
Cash invested: $92,400 (down + closing). Projections, not guarantees.
Landlord ↔ Tenant lean methodology
- Overall (STATE)
- 87 Strongly Landlord-Friendly
- State Florida
- 87 Strongly Landlord-Friendly · R+3
- County
- — inherits STATE
- City
- — inherits STATE
ZIP-level market 33312
- Rents YoY
- 1.3%
- Active inventory
- 412
- Price-to-rent
- 8.8×
Monthly cashflow live
- Estimated rent
- $3,124 high interval (Pro) →
- Mortgage (P&I)
- −$1,731
- Tax from tax record
- −$536 /mo · $6,431/yr
- Insurance
- −$138
- HOA
- −$0
- Vacancy / Maint / Mgmt
- −$656
- Net cashflow
- $64
Break-even live
UW: 25.0% down · 7.5% · 30yr · 1.5% tax · 5.0% vac · 8.0% maint · 8.0% mgmt
Financing live
Cash to close
- Down payment
- $82,500
- Closing costs
- $9,900
- Reserves months
- —
- Total cash needed
- —
Loan-product check · same deal, 3 products live
Conventional
25% down · 7.5% · 30yr
- Down + closing
- —
- Monthly P&I
- —
- Monthly cashflow
- —
- DSCR
- —
- Eligible?
- —
Personal DTI + credit; lowest rate.
DSCR
20% down · 8.5% · 30yr
- Down + closing
- —
- Monthly P&I
- —
- Monthly cashflow
- —
- DSCR
- —
- Eligible?
- —
No personal income docs; deal must DSCR.
Hard money
10% down · 12.0% · 12mo
- Down + closing
- —
- Monthly P&I
- —
- Monthly cashflow
- —
- DSCR
- —
- Eligible?
- —
Short-term bridge; refi at stabilization.
Rent comps 40 comps
| Address | Beds | Baths | Sqft | Rent | $/sqft | DOM | Units | Dist |
|---|---|---|---|---|---|---|---|---|
| 280 NW 31st Ave Fort Lauderdale, FL | 3.0 | 2.0 | 884 | $2,700 | $3.05 | 17d | 1 | 0.28mi |
| 10 NW 28th Way Fort Lauderdale, FL | 3.0 | 1.0 | 1232 | $1,950 | $1.58 | 3d | 1 | 0.37mi |
| 2841 SW 4th Ct Unit 1258737P Fort Lauderdale, FL | 3.0 | 2.0 | 1689 | $4,617 | $2.73 | 5d | 1 | 0.41mi |
| 2836 SW 4th Ct Fort Lauderdale, FL | 3.0 | 2.0 | 1617 | $3,300 | $2.04 | 24d | 1 | 0.41mi |
| 610 Carolina Ave Unit 2 Fort Lauderdale, FL | 4.0 | 3.0 | 1865 | $2,000 | $1.07 | 15d | 1 | 0.46mi |
| 2781 SW 4th St Unit 2781 Fort Lauderdale, FL | 3.0 | 2.0 | 1413 | $3,200 | $2.26 | 22d | 1 | 0.47mi |
| 2750 SW 2nd Ct Fort Lauderdale, FL | 3.0 | 1.0 | 1187 | $2,385 | $2.01 | 16d | 1 | 0.48mi |
| 3551 SW 1st St Fort Lauderdale, FL | 4.0 | 2.0 | 1720 | $3,150 | $1.83 | 24d | 1 | 0.48mi |
| 2825 SW 5th St Fort Lauderdale, FL | 3.0 | 1.0 | 1311 | $3,000 | $2.29 | 24d | 1 | 0.49mi |
| 3440 NW 4th St Lauderhill, FL | 3.0 | 2.0 | 1525 | $2,900 | $1.90 | 24d | 1 | 0.49mi |
| 204 NW 28th Ave Unit 1 Fort Lauderdale, FL | 2.0 | 1.0 | 1236 | $1,850 | $1.50 | 3d | 1 | 0.51mi |
| 540 NW 31st Ave Fort Lauderdale, FL | 4.0 | 2.0 | 1097 | $2,900 | $2.64 | 7d | 1 | 0.53mi |
| 483 W Melrose Cir Fort Lauderdale, FL | 3.0 | 2.0 | 1560 | $3,500 | $2.24 | 24d | 1 | 0.55mi |
| 630 SW 28th Dr Fort Lauderdale, FL | 3.0 | 2.0 | 1467 | $3,300 | $2.25 | 24d | 1 | 0.58mi |
| 180 Penn Way Fort Lauderdale, FL | 4.0 | 2.0 | 1378 | $3,550 | $2.58 | 7d | 1 | 0.59mi |
| 2900 NW 5th Ct Fort Lauderdale, FL | 4.0 | 2.0 | 1112 | $3,250 | $2.92 | 18d | 1 | 0.61mi |
| 420 SW 27th Ave Fort Lauderdale, FL | 3.0 | 1.0–2.0 | 1024 | $3,759 | $3.67 | 24d | 1 | 0.66mi |
| 830 E Evanston Cir Fort Lauderdale, FL | 3.0 | 2.0 | 1361 | $2,680 | $1.97 | 24d | 1 | 0.72mi |
| 3451 NW 6th St Lauderhill, FL | 4.0 | 2.0 | 1700 | $3,000 | $1.76 | 24d | 1 | 0.72mi |
| 720 NW 33rd Ter Lauderhill, FL | 3.0 | 1.0 | 1340 | $2,560 | $1.91 | 22d | 1 | 0.76mi |
| 2850 NW 7th St Fort Lauderdale, FL | 3.0 | 2.0 | 1169 | $3,000 | $2.57 | 24d | 1 | 0.76mi |
| 649 W Evanston Cir Fort Lauderdale, FL | 4.0 | 2.0 | 1576 | $3,315 | $2.10 | 24d | 1 | 0.77mi |
| 950 E Dayton Cir Fort Lauderdale, FL | 3.0 | 2.0 | 1521 | $2,699 | $1.77 | 15d | 1 | 0.77mi |
| 2621 Riverland Dr Unit 2 Fort Lauderdale, FL | 3.0 | 1.0 | 1012 | $2,300 | $2.27 | 22d | 1 | 0.78mi |
| 401 SW 25th Ave Fort Lauderdale, FL | 3.0 | 1.5 | 1065 | $3,200 | $3.00 | 7d | 1 | 0.79mi |
| 2810 NW 7th St Fort Lauderdale, FL | 4.0 | 2.0 | 1501 | $2,999 | $2.00 | 24d | 1 | 0.79mi |
| 2804 NW 7th Ct Unit 2804 Fort Lauderdale, FL | 3.0 | 2.0 | 1381 | $3,500 | $2.53 | 20d | 1 | 0.84mi |
| 2804 NW 7th Ct Fort Lauderdale, FL | 3.0 | 2.0 | 1381 | $1,300 | $0.94 | 24d | 1 | 0.84mi |
| 2217 SW 1st Ct Unit 2217 Fort Lauderdale, FL | 3.0 | 2.0 | 1350 | $3,650 | $2.70 | 24d | 1 | 0.85mi |
| 2217 SW 1st Ct Unit 2217 Fort Lauderdale, FL | 3.0 | 2.0 | 1350 | $3,650 | $2.70 | 7d | 1 | 0.85mi |
| 1172 Arizona Ave Fort Lauderdale, FL | 3.0 | 2.0 | 1176 | $3,200 | $2.72 | 24d | 1 | 0.87mi |
| 2488 SW 6th Ct Fort Lauderdale, FL | 3.0 | 2.0 | 1132 | $2,900 | $2.56 | 4d | 1 | 0.90mi |
| 101 SW 22nd Ave Fort Lauderdale, FL | 3.0 | 2.0 | 1010 | $7,500 | $7.43 | 16d | 1 | 0.90mi |
| 600 NW 38th Ave Lauderhill, FL | 4.0 | 2.0 | 1428 | $2,700 | $1.89 | 24d | 1 | 0.91mi |
| 2810 NW 8th Ct Fort Lauderdale, FL | 3.0 | 2.0 | 1435 | $2,850 | $1.99 | 24d | 1 | 0.91mi |
| 3025 NW 8th Rd Fort Lauderdale, FL | 3.0 | 1.0 | 947 | $2,520 | $2.66 | 24d | 1 | 0.91mi |
| 331 NW 39th Ave #1 Plantation, FL | 4.0 | 1.0 | 1096 | $3,000 | $2.74 | 24d | 1 | 0.91mi |
| 2418 SW 6th Ct Fort Lauderdale, FL | 3.0 | 1.0 | 1394 | $2,725 | $1.95 | 2d | 1 | 0.93mi |
| 3120 SW 12th Pl Fort Lauderdale, FL | 3.0 | 2.0 | 1532 | $2,950 | $1.93 | 24d | 1 | 0.97mi |
| 335 N State Road 7 Plantation, FL | 1.0–3.0 | 1.0–2.0 | 1051 | $3,000 | $2.85 | 2d | 26 | 1.00mi |
Listing history 11 events
-
2026-05-21status Pending
-
2026-05-19$330,000 Active
-
2015-01-21soldstatus $150,000
-
2015-01-19soldstatus $150,000 Sold 413-char remark
Show marketing remark (413 chars)
Fabulous and remodeled 4bed/2bath n Ft. Lauderdale. Brand new appliances, with wood laminate flooring. Freshly painted and in move in ready condition. Great backyard space perfect for entertaining. High desired rental neighborhood which makes great invest ment opportunity! Conveniently located near major highways, shopping, and restaurants, and only minutes from the beach and the ever popular Hard Rock Casino.
-
2014-12-23status Pending 413-char remark
Show marketing remark (413 chars)
Fabulous and remodeled 4bed/2bath n Ft. Lauderdale. Brand new appliances, with wood laminate flooring. Freshly painted and in move in ready condition. Great backyard space perfect for entertaining. High desired rental neighborhood which makes great invest ment opportunity! Conveniently located near major highways, shopping, and restaurants, and only minutes from the beach and the ever popular Hard Rock Casino.
-
2014-11-21$170,000 Active 413-char remark
Show marketing remark (413 chars)
Fabulous and remodeled 4bed/2bath n Ft. Lauderdale. Brand new appliances, with wood laminate flooring. Freshly painted and in move in ready condition. Great backyard space perfect for entertaining. High desired rental neighborhood which makes great invest ment opportunity! Conveniently located near major highways, shopping, and restaurants, and only minutes from the beach and the ever popular Hard Rock Casino.
-
2010-09-30soldstatus $65,500
-
2002-09-23soldstatus $124,000
-
2000-03-27soldstatus $114,500
-
1999-08-11soldstatus $59,800
-
1977-06-01soldstatus $27,000
ⓘ Source: listings_history table (triggers on properties + properties_extension) + one-shot
backfill from property_details.listing_events for pre-trigger history.
Tax reassessment forecast FL · Resets to sale price
- Current annual tax
- $6,431 · $536/mo
- Projected year-2 tax
- $6,431 · $536/mo
- Expected delta
- $0/yr ($0/mo · 0.0%)
ⓘ Screening estimate from a state-policy table — verify with the county assessor before closing.
Climate risk First Street
- Flood 1/10 Low FEMA zone X (shaded) · 0% chance over 30 yrs
- Wildfire 1/10 Low
- Heat 10/10 Extreme 6 d/yr ≥105°F today · 22 d/yr by 30 yrs out
- Wind 10/10 Extreme 99% chance of damaging wind over 30 yrs
- Air quality 2/10 Low 2 unhealthy d/yr today · 2 by 30 yrs out
Nearby sold comps map
Loading sold comps map…
Walkable amenities ~0.75 mi
Loading nearby amenities…
Taxation est. · year 1
- Rental income
- $37,487
- − Mortgage interest
- −$18,485
- − Property taxes
- −$6,431
- − Insurance
- −$1,650
- − Repairs & maintenance
- −$2,999
- − Management
- −$2,999
- − Depreciation
- −$9,600
- Taxable loss
- −$4,677
- Est. tax savings @ 24.0%
- +$1,123
- After-tax cash flow
- $1,889/yr
For passive investors: Depreciation is non-cash, so a rental often shows a tax loss while cash-flowing — sheltering income. Rental losses are passive: they offset passive income freely, and up to $25,000/yr can offset ordinary (W-2) income if you actively participate and your MAGI is under $100k (phasing out to $0 by $150k); unused losses carry forward. On sale, claimed depreciation is recaptured at up to 25%, and gains may owe capital-gains tax (a 1031 exchange can defer both). Figures are a year-1 estimate at your 24.0% rate — not tax advice; consult a CPA.
Schools (NCES district)
- District
- Broward
- NCES district ID
- 1200180
- Math proficiency
- 42% ▼ -18.00%
- Reading proficiency
- 53% ▼ -5.00%
- Median HH income
- $52,139
- Composite
- 40.88/100
- National rank
- #3621
- State rank
- #46 of 73 in FL
Livability — Fort Lauderdale
- Score
- 82/100
- State rank
- #78
- US rank
- #1293
Category grades
Schools grade is shown separately in the Schools card above.
Census & demographics
- Census place
- Fort Lauderdale, FL
- County
- Broward County · 1,963,430 people
- City population
- 235,769
- Metro
- Miami-Fort Lauderdale-Pompano Beach, FL
- Population (ZIP)
- 52,798
- Household income
- $75,952
- Rent vs Own
- Severe rent burden
- 1903.0
Population outlook (Broward County) Hauer SSP2
- Today (2025)
- 2,207,033 people
- By 2030
- 2,360,704 · +7.0%
- By 2040
- 2,661,208 · +20.6%
- By 2050
- 2,946,698 · +33.5%
- By 2075
- 3,602,273 · +63.2%
- By 2100
- 3,970,984 · +79.9%
Race, ethnicity, and origin ACS 2023
- Neighborhood character
- Highly diverse neighborhood (Simpson 0.70)
- Race & ethnicity
- White 34% Hispanic / Latino 32% Black 29% Two or more races 20% Asian 2%
- Hispanic origin (detail)
- Mexican 2% Puerto Rican 5% Cuban 6% Salvadoran 1%
- Common ancestry
- Hispanic 6% Romanian 3% Italian 1%
- Foreign-born
- 33% · Canada, Jamaica, Dominican Republic
- Languages at home
- 59% English-only · Spanish 29% French/Haitian/Cajun 7% Other Indo-European 2%
Political lean MEDSL · Broward
- 2024 margin
- D (+17.0) · D 58.0% · R 41.0%
- 2008→2024 swing
- -17.8pp toward R · 2008: 34.7pp · 2024: 17.0pp
- All cycles
- 2024: D+17.0 2020: D+29.8 2016: D+35.0 2012: D+34.9 2008: D+34.7
Not yet ingested
- Civics
- —
Market trends
- HPI YoY
- ▼ -323.99%
- Current HPI
- 382.6298
- Rent YoY
- ▲ 1.30%
- Metro
- Miami-Fort Lauderdale-Pompano Beach, FL
- State GDP YoY
- ▲ 3.28%
- F500 in state
- 36
Industry mix (Fortune 500 HQ in FL)
| Industry | F500 HQs | Revenue |
|---|---|---|
| Industrial Technology | 2 | $29B |
|
||
| Insurance | 2 | $17B |
|
||
| Retail | 1 | $60B |
|
||
| Technology Distribution | 1 | $58B |
|
||
| Homebuilding | 1 | $35B |
|
||
| Technology Manufacturing | 1 | $35B |
|
||
Price history
+1122.2% since first listed11 events — show timeline
- 2026-05-21 Pending — Beaches MLS
- 2026-05-19 Listed $330,000 Beaches MLS
- 2015-01-21 Sold (Public Records) $150,000 Public Records
- 2015-01-19 Sold (MLS) $150,000 MARMLS
- 2014-12-23 Pending — MARMLS
- 2014-11-21 Listed $170,000 MARMLS
- 2010-09-30 Sold (Public Records) $65,500 Public Records
- 2002-09-23 Sold (Public Records) $124,000 Public Records
- 2000-03-27 Sold (Public Records) $114,500 Public Records
- 1999-08-11 Sold (Public Records) $59,800 Public Records
- 1977-06-01 Sold (Public Records) $27,000 Public Records
Property tax history
+11.6%/yrLatest (2025): $6,431 · +9.3% YoY. Source: county tax records.
Cash-flow waterfall
monthlySold comps — $/sqft
last 12 mo · ≤1 miLoading sold comps…