 6-Plex
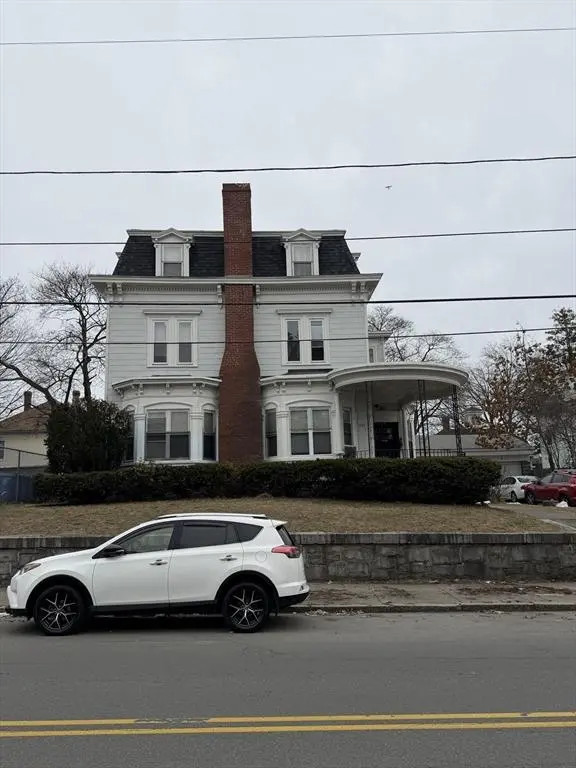
229 Jackson St · Lawrence, MA
Flood risk 1/10 · Minimal
- FEMA flood zone
- X (unshaded)
- Chance of flooding over 30 yrs
- 0.0%
- Est. flood insurance / yr
- $507 – $1,088
Fire risk 1/10 · Minimal
- Est. fire insurance / yr
- $915 – $1,699
Heat risk 5/10 · Moderate
- Hot days now (above 98°F)
- 7 days/yr
- Hot days in 30 yrs
- 16 days/yr
Wind risk 6/10 · Moderate
- Chance of severe wind over 30 yrs
- 27.0%
Air-quality risk 2/10 · Minimal
- Unhealthy air days now
- 2 days/yr
- Unhealthy air days in 30 yrs
- 2 days/yr
Risk factors via First Street. Map © Google.
Why this score? — see what drove the C- grade
The composite is a weighted blend of 9 inputs, each scored 0–100. Each bar is that input's sub-score; the figure is the points it added to the 100-point composite (weight × sub-score).
- Cash flow +26.9/30.0
- DSCR +9.3/10.0
- 1% rule +6.2/10.0
- Livability +3.5/5.0
- Rent growth +2.5/5.0
- Condition / age +2.5/5.0
- Schools +1.2/10.0
- ARV discount +0.0/15.0
- Appreciation +0.0/10.0
$1,149,000
🖨 Deal sheet 📄 Offer letter ✓ Due diligence
Multi-family units
County records classify this as Multi-Family (5+ Unit). Listing-text estimate: 6 units. confirmed
5+ unit building — per-unit beds/baths from public records are typically unavailable; the breakdown below (if shown) is an estimate from the listing text.
Listing remarks MLS
This 6-unit multi-family residence property consists of (4) one-bedroom units, (1) three- bedroom unit, and (1) Studio. Having all separate utilities provides a lower cost of ownership for an investor that is looking for cash flow and income growth potential. The property encompasses 4583 square feet of living area, situated upon a generous 7520 square foot lot. This 6-unit property has a mansard roof that is in good condition, separate gas heating systems, separate electrical electrical panels and meters,vinyl replacement windows, and a recently updated Fire Alarm Panel. Three dedicated garage spaces, with remote openers, offering convenient vehicle accommodations and the potential for additional income. Great commuter location just 1.2 miles from the commuter rail. Close to local shops and downtown restaurants. A short drive to Route 114, Route 495, Route 93, Route 28, the Methuen Loop shopping center, and tax-free shopping in Salem, NH.
Key facts
- 7,520 sq ft lot
- 3 garage spots
- Community pool
Neighborhood map
What this means for you Summary
Snapshot
- This is a 4×1bd/1ba + 1×3bd/1ba + 1×?bd/1ba units multifamily listed at $1.15M.
Deal economics
- At list price, monthly cash flow is $3k ($38k/yr) — positive. Per door: $533/mo.
- The deal already cash-flows at list — no discount required.
- Meets the 1% rule at list price ($13k rent vs $1.15M).
- Recommended offer: $1.08M (6.0% below list) — sets the bar for market timing.
- Cap rate 9.6% vs local median 4.1% in Lawrence — top-decile yield for the area; either an underpriced asset or a hidden risk that comps aren't pricing in. Stress-test before assuming the spread holds.
Location & tenants
- Location reads 70/100 on livability (#133 in MA) — a middle-class / working-renter tenant base. Strengths: commute A+, health & safety A+; Watch: crime C-, schools D, amenities D.
- Lawrence (suburban): math 10% / reading 19% proficiency, ranked #300 of 302 in MA (top 99%) — low school quality limits family demand, transient renter base, plan for 1-2y turnover; 83% free/reduced lunch — lower-income household profile, screen leases tightly.
- Market conditions: 14 active listings in the ZIP; 1,032 units permitted in Essex County in 2024 (590 in 5+ unit buildings).
Forward outlook
- Local home prices are declining (-3.0%/yr); year-one equity from $8k of loan paydown is wiped out by about $34k of value loss. Plan a longer hold.
- Essex County population projected at +15% by 2050 — long-run rental-demand tailwind backs the buy-and-hold thesis.
- At projected returns (-3.0% appreciation + 3.0% rent growth), your $322k cash investment doubles in ~10 years — after that, you're playing with house money.
Negotiation context
- It's been on market 84 days — a 6% lower offer ($1.08M) is reasonable based on typical stale-listing flexibility.
- Current owner paid $80k; list at $1.15M implies a 1336% gain — meaningful room to come down on a strong offer.
Risks & watch-outs
- Watch-outs: built in 1910 — expect roof / HVAC / electrical / plumbing capex.
- Climate carrying-cost: major wind risk, 27% chance of damaging wind over 30y; extreme-heat days projected 7→16/yr by 2055 (HVAC capex compounding) — expect insurance premiums to compound above CPI over the hold.
Questions for the listing agent
- It's been on market 84 days. Have you received any prior offers? Is the seller open to a 6% concession, seller financing, or rate buy-down credit?
- Can we see the unit-by-unit rent roll, current vacancy, and any below-market leases? What's the average tenancy length?
- What capital expenditures (roof, boiler, parking lot, exteriors) have been made in the last 5 years, and what's planned in the next 2?
- Built in 1910 — when were the roof, HVAC, electrical panel, plumbing, and water heater last replaced?
- Why hasn't it sold? Are there any deal-killer items the seller is aware of (foundation, flood, title, zoning, code violations)?
- Is there a deadline driving the sale (1031 exchange, divorce, estate, relocation)? That informs how much negotiation room exists.
- Schools are D-rated, which usually means shorter tenancies and higher turnover. Who's the typical renter profile here, and what's been the actual vacancy rate?
- What's the average days-on-market for RENTAL listings here right now (not sales)? A rising rental-DOM trend means longer vacancies and softer asking-rent achievability than the comps imply.
- What's the recent tenant-quality profile in this submarket — average credit score on applications, eviction rate, late-payment / NSF rate, and stable-employment percentage? A property-management company in the area should have these aggregated.
- How much new apartment / multifamily construction is in the pipeline within 1–3 miles? Heavy new supply (>2% of stock underway) typically softens rents 12–24 months out; light construction supports rent growth.
Investment metrics
- 1% rule
- 1.12% ✓
- Cap rate
- 9.63%
- Cash-on-cash
- 11.93%
- DSCR
- 1.53
- GRM
- 7.4
CMA / ARV
- ARV (median comp)
- $847,466
- List price
- $1,149,000
- Delta
- 35.58%
- Verdict
- OVERPRICED
- Comps
- 20 within 1.0 mi
Projected returns pro-forma
-3.0% appreciation · 3.0% rent growth · sell at horizon
- IRR
- 1.4%
- Equity multiple
- 1.05×
- Total profit
- $17,126
- Equity at exit
- $171,320
- IRR
- 11.0%
- Equity multiple
- 1.86×
- Total profit
- $275,651
- Equity at exit
- $99,345
Cash invested: $321,720 (down + closing). Projections, not guarantees.
Landlord ↔ Tenant lean methodology
- Overall (STATE)
- 20 Strongly Tenant-Friendly
- State Massachusetts
- 20 Strongly Tenant-Friendly · D+15
- County
- — inherits STATE
- City
- — inherits STATE
ZIP-level market 01841
- Home prices YoY
- -21.6%
- Active inventory
- 14
- Price-to-rent
- 45.3×
Monthly cashflow live
- Estimated rent
- $12,911 high interval (Pro) →
- Mortgage (P&I)
- −$6,025
- Tax from tax record
- −$497 /mo · $5,967/yr
- Insurance
- −$479
- HOA
- −$0
- Vacancy / Maint / Mgmt
- −$2,711
- Net cashflow
- $3,198
Break-even live
6-unit breakdown (identical units grouped — click to expand)
| Units | Beds | Baths | Est. rent |
|---|---|---|---|
| 4× units | 1 | 1 | $8,452 |
| #1 | 1 | 1 | $2,113 |
| #2 | 1 | 1 | $2,113 |
| #3 | 1 | 1 | $2,113 |
| #4 | 1 | 1 | $2,113 |
| 1× unit | 3 | 1 | $2,307 |
| 1× unit | 0 | 1 | $2,152 |
| Total (6 units) | $12,911 | ||
UW: 25.0% down · 7.5% · 30yr · 1.5% tax · 5.0% vac · 8.0% maint · 8.0% mgmt
Financing live
Cash to close
- Down payment
- $287,250
- Closing costs
- $34,470
- Reserves months
- —
- Total cash needed
- —
Loan-product check · same deal, 3 products live
Conventional
25% down · 7.5% · 30yr
- Down + closing
- —
- Monthly P&I
- —
- Monthly cashflow
- —
- DSCR
- —
- Eligible?
- —
Personal DTI + credit; lowest rate.
DSCR
20% down · 8.5% · 30yr
- Down + closing
- —
- Monthly P&I
- —
- Monthly cashflow
- —
- DSCR
- —
- Eligible?
- —
No personal income docs; deal must DSCR.
Hard money
10% down · 12.0% · 12mo
- Down + closing
- —
- Monthly P&I
- —
- Monthly cashflow
- —
- DSCR
- —
- Eligible?
- —
Short-term bridge; refi at stabilization.
Listing history 17 events
-
2026-06-18days on market $1,149,000 Active 84 DOM
-
2026-06-17days on market $1,149,000 Active 83 DOM
-
2026-06-16days on market $1,149,000 Active 82 DOM
-
2026-06-15days on market $1,149,000 Active 81 DOM
-
2026-06-13days on market $1,149,000 Active 79 DOM
-
2026-06-13days on market $1,149,000 Active 78 DOM
-
2026-06-09days on market $1,149,000 Active 75 DOM
-
2026-06-08days on market $1,149,000 Active 74 DOM
-
2026-06-07days on market $1,149,000 Active 73 DOM
-
2026-06-04days on market $1,149,000 Active 70 DOM
-
2026-06-03days on market $1,149,000 Active 69 DOM
-
2026-06-02days on market $1,149,000 Active 68 DOM
-
2026-06-01days on market $1,149,000 Active 67 DOM
-
2026-05-31days on market $1,149,000 Active 66 DOM
-
2026-05-17price $1,149,000 954-char remark
Show marketing remark (954 chars)
This 6-unit multi-family residence property consists of (4) one-bedroom units, (1) three- bedroom unit, and (1) Studio. Having all separate utilities provides a lower cost of ownership for an investor that is looking for cash flow and income growth potential. The property encompasses 4583 square feet of living area, situated upon a generous 7520 square foot lot. This 6-unit property has a mansard roof that is in good condition, separate gas heating systems, separate electrical electrical panels and meters,vinyl replacement windows, and a recently updated Fire Alarm Panel. Three dedicated garage spaces, with remote openers, offering convenient vehicle accommodations and the potential for additional income. Great commuter location just 1.2 miles from the commuter rail. Close to local shops and downtown restaurants. A short drive to Route 114, Route 495, Route 93, Route 28, the Methuen Loop shopping center, and tax-free shopping in Salem, NH.
-
2026-03-26$1,199,000 New 954-char remark
Show marketing remark (954 chars)
This 6-unit multi-family residence property consists of (4) one-bedroom units, (1) three- bedroom unit, and (1) Studio. Having all separate utilities provides a lower cost of ownership for an investor that is looking for cash flow and income growth potential. The property encompasses 4583 square feet of living area, situated upon a generous 7520 square foot lot. This 6-unit property has a mansard roof that is in good condition, separate gas heating systems, separate electrical electrical panels and meters,vinyl replacement windows, and a recently updated Fire Alarm Panel. Three dedicated garage spaces, with remote openers, offering convenient vehicle accommodations and the potential for additional income. Great commuter location just 1.2 miles from the commuter rail. Close to local shops and downtown restaurants. A short drive to Route 114, Route 495, Route 93, Route 28, the Methuen Loop shopping center, and tax-free shopping in Salem, NH.
-
1998-10-15soldstatus $80,000
ⓘ Source: listings_history table (triggers on properties + properties_extension) + one-shot
backfill from property_details.listing_events for pre-trigger history.
Tax reassessment forecast MA · Partial reset (capped growth)
- Current annual tax
- $5,967 · $497/mo
- Projected year-2 tax
- $10,050 · $837/mo
- Expected delta
- +$4,083/yr (+$340/mo · 68.4%)
ⓘ Screening estimate from a state-policy table — verify with the county assessor before closing.
Climate risk First Street
- Flood 1/10 Low FEMA zone X (unshaded) · 0% chance over 30 yrs
- Wildfire 1/10 Low
- Heat 5/10 Major 7 d/yr ≥98°F today · 16 d/yr by 30 yrs out
- Wind 6/10 Major 27% chance of damaging wind over 30 yrs
- Air quality 2/10 Low 2 unhealthy d/yr today · 2 by 30 yrs out
Nearby sold comps map
Loading sold comps map…
Walkable amenities ~0.75 mi
Loading nearby amenities…
Taxation est. · year 1
- Rental income
- $154,932
- − Mortgage interest
- −$64,362
- − Property taxes
- −$5,967
- − Insurance
- −$5,745
- − Repairs & maintenance
- −$12,395
- − Management
- −$12,395
- − Depreciation
- −$33,425
- Taxable income
- $20,644
- Est. tax owed @ 24.0%
- −$4,954
- After-tax cash flow
- $33,424/yr
For passive investors: Depreciation is non-cash, so a rental often shows a tax loss while cash-flowing — sheltering income. Rental losses are passive: they offset passive income freely, and up to $25,000/yr can offset ordinary (W-2) income if you actively participate and your MAGI is under $100k (phasing out to $0 by $150k); unused losses carry forward. On sale, claimed depreciation is recaptured at up to 25%, and gains may owe capital-gains tax (a 1031 exchange can defer both). Figures are a year-1 estimate at your 24.0% rate — not tax advice; consult a CPA.
Schools (NCES district)
- District
- Lawrence
- NCES district ID
- 2506660
- Math proficiency
- 10% ▼ -21.00%
- Reading proficiency
- 19% ▼ -11.00%
- Median HH income
- $34,802
- Composite
- 11.87/100
- National rank
- #9672
- State rank
- #300 of 302 in MA
Livability — Lawrence
- Score
- 70/100
- State rank
- #133
- US rank
- #7750
Category grades
Schools grade is shown separately in the Schools card above.
Census & demographics
- Census place
- Lawrence, MA
- City population
- 35,967
- Population (ZIP)
- 52,761
Population outlook (Essex County) Hauer SSP2
- Today (2025)
- 840,920 people
- By 2030
- 872,201 · +3.7%
- By 2040
- 927,918 · +10.3%
- By 2050
- 970,206 · +15.4%
- By 2075
- 1,077,993 · +28.2%
- By 2100
- 1,103,053 · +31.2%
Race, ethnicity, and origin ACS 2023
- Neighborhood character
- Predominantly Hispanic (87%)
- Race & ethnicity
- Hispanic / Latino 87% Two or more races 20% White 10% Black 2%
- Hispanic origin (detail)
- Mexican 1% Puerto Rican 16% Dominican 56%
- Common ancestry
- Lithuanian 2% Romanian 1% Russian 1%
- Foreign-born
- 46% · Canada, Vietnam
- Languages at home
- 19% English-only · Spanish 78% Arabic 1% Other Indo-European 1%
Political lean MEDSL · Essex
- 2024 margin
- Strong D (+20.3) · D 59.2% · R 38.9% · Other 1.9%
- 2008→2024 swing
- 0.0pp no change · 2008: 20.3pp · 2024: 20.3pp
- All cycles
- 2024: D+20.3 2020: D+29.1 2016: D+22.5 2012: D+16.2 2008: D+20.3
Not yet ingested
- Civics
- —
Market trends
- HPI YoY
- ▼ -148.71%
- Current HPI
- 538.2935
- Rent YoY
- —
- Metro
- —
- State GDP YoY
- ▲ 2.28%
- F500 in state
- 38
Industry mix (Fortune 500 HQ in MA)
| Industry | F500 HQs | Revenue |
|---|---|---|
| Technology | 3 | $17B |
|
||
| Insurance | 2 | $84B |
|
||
| Retail | 2 | $76B |
|
||
| Life Sciences | 1 | $43B |
|
||
| Energy Technology | 1 | $31B |
|
||
| Aerospace / Defense | 1 | $18B |
|
||
Price history
+1336.2% since first listed3 events — show timeline
- 2026-05-17 Price Changed $1,149,000 MLS PIN
- 2026-03-26 Listed $1,199,000 MLS PIN
- 1998-10-15 Sold (Public Records) $80,000 Public Records
Property tax history
+3.3%/yrLatest (2023): $5,967 · +1.8% YoY. Source: county tax records.
Cash-flow waterfall
monthlySold comps — $/sqft
last 12 mo · ≤1 miLoading sold comps…