11 Oak St · Louisa, KY
Flood risk 5/10 · Moderate
- FEMA flood zone
- X (shaded)
- Chance of flooding over 30 yrs
- 0.26%
- Est. flood insurance / yr
- $507 – $1,088
Fire risk 5/10 · Moderate
- Est. fire insurance / yr
- $839 – $1,559
Heat risk 4/10 · Minor
- Hot days now (above 102°F)
- 7 days/yr
- Hot days in 30 yrs
- 19 days/yr
Wind risk 2/10 · Minimal
- Chance of severe wind over 30 yrs
- 2.0%
Air-quality risk 1/10 · Minimal
- Unhealthy air days now
- 0 days/yr
- Unhealthy air days in 30 yrs
- 0 days/yr
Risk factors via First Street. Map © Google.
Why this score? — see what drove the B grade
The composite is a weighted blend of 9 inputs, each scored 0–100. Each bar is that input's sub-score; the figure is the points it added to the 100-point composite (weight × sub-score).
- Cash flow +26.8/30.0
- DSCR +9.2/10.0
- Appreciation +8.6/10.0
- ARV discount +7.5/15.0
- 1% rule +7.2/10.0
- Livability +3.1/5.0
- Schools +2.7/10.0
- Rent growth +2.5/5.0
- Condition / age +2.5/5.0
$90,000
🖨 Deal sheet 📄 Offer letter ✓ Due diligence
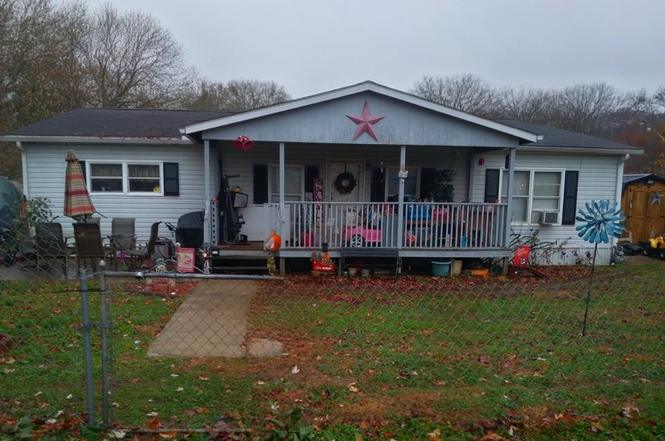
Listing remarks
Conveniently located, this manufactured home offers 3 bedrooms and 2 baths on a 0.126 acre lot. With easy access to town and everyday amenities, it's a great option for comfortable living on a manageable lot. MLS # 126904
Key facts
- 5,489 sq ft lot
- Built 1995
Neighborhood map
What this means for you Summary
Snapshot
- This is a 3-bed/2.0-bath manufactured listed at $90k.
Deal economics
- At list price, monthly cash flow is $247 ($3k/yr) — positive.
- The deal already cash-flows at list — no discount required.
- Meets the 1% rule at list price ($1k rent vs $90k).
- Cap rate 9.6% vs local median 3.9% in Louisa — top-decile yield for the area; either an underpriced asset or a hidden risk that comps aren't pricing in. Stress-test before assuming the spread holds.
Location & tenants
- Location reads 61/100 on livability (#381 in KY) — a middle-class / working-renter tenant base. Strengths: cost of living A+, crime A, housing B; Watch: amenities F, commute F, employment F.
- Lawrence County (town): math 23% / reading 42% proficiency, ranked #95 of 165 in KY (top 58%) — families likely to look elsewhere, expect single-tenant / working-renter base with shorter leases.
- Zoned schools: Lawrence County High School (math 32% / reading 47%, grade F, #40 of 254 statewide, top 19%, 738 students, 63% FRL).
- Market conditions: 63 active listings in the ZIP.
Forward outlook
- In year one you build about $7k of equity ($622 loan paydown + $6k appreciation (7.2% local appreciation)).
- Lawrence County population projected at -14% by 2050 — secular population decline; favor cash flow + early exit over multi-decade hold.
- At projected returns (7.2% appreciation + 3.0% rent growth), your $25k cash investment doubles in ~3 years — after that, you're playing with house money.
- By year 5, paydown + projected appreciation supports a ~$32k cash-out refi (75% LTV) — recoverable capital for the next deal without selling this one.
Negotiation context
- Only 0 days on market — expect competitive offers; lowballing is unlikely to land.
Risks & watch-outs
- Climate carrying-cost: moderate flood risk; moderate wildfire risk — expect insurance premiums to compound above CPI over the hold.
Questions for the listing agent
- Is there a deadline driving the sale (1031 exchange, divorce, estate, relocation)? That informs how much negotiation room exists.
- Schools are D-rated, which usually means shorter tenancies and higher turnover. Who's the typical renter profile here, and what's been the actual vacancy rate?
- What's the average days-on-market for RENTAL listings here right now (not sales)? A rising rental-DOM trend means longer vacancies and softer asking-rent achievability than the comps imply.
- What's the recent tenant-quality profile in this submarket — average credit score on applications, eviction rate, late-payment / NSF rate, and stable-employment percentage? A property-management company in the area should have these aggregated.
- How much new for-sale + rental construction is in the pipeline within 1–3 miles? Heavy new supply typically softens prices + rents 12–24 months out; constrained supply supports both.
Investment metrics
- 1% rule
- 1.22% ✓
- Cap rate
- 9.58%
- Cash-on-cash
- 11.74%
- DSCR
- 1.52
- GRM
- 6.8
CMA / ARV
No comps found within radius.
Projected returns pro-forma
7.17% appreciation · 3.0% rent growth · sell at horizon
- IRR
- 27.5%
- Equity multiple
- 2.91×
- Total profit
- $48,067
- Equity at exit
- $63,345
- IRR
- 25.1%
- Equity multiple
- 6.08×
- Total profit
- $127,914
- Equity at exit
- $121,221
Cash invested: $25,200 (down + closing). Projections, not guarantees.
Landlord ↔ Tenant lean methodology
- Overall (STATE)
- 83 Strongly Landlord-Friendly
- State Kentucky
- 83 Strongly Landlord-Friendly · R+16
- County
- — inherits STATE
- City
- — inherits STATE
ZIP-level market 41230
- Home prices YoY
- 4.2%
- Active inventory
- 63
- Price-to-rent
- 6.8×
Monthly cashflow live
- Estimated rent
- $1,099 medium interval (Pro) →
- Mortgage (P&I)
- −$472
- Tax est. 1.5%
- −$112 /mo · $1,350/yr
- Insurance
- −$38
- HOA
- −$0
- Vacancy / Maint / Mgmt
- −$231
- Net cashflow
- $247
Break-even live
UW: 25.0% down · 7.5% · 30yr · 1.5% tax · 5.0% vac · 8.0% maint · 8.0% mgmt
Financing live
Cash to close
- Down payment
- $22,500
- Closing costs
- $2,700
- Reserves months
- —
- Total cash needed
- —
Loan-product check · same deal, 3 products live
Conventional
25% down · 7.5% · 30yr
- Down + closing
- —
- Monthly P&I
- —
- Monthly cashflow
- —
- DSCR
- —
- Eligible?
- —
Personal DTI + credit; lowest rate.
DSCR
20% down · 8.5% · 30yr
- Down + closing
- —
- Monthly P&I
- —
- Monthly cashflow
- —
- DSCR
- —
- Eligible?
- —
No personal income docs; deal must DSCR.
Hard money
10% down · 12.0% · 12mo
- Down + closing
- —
- Monthly P&I
- —
- Monthly cashflow
- —
- DSCR
- —
- Eligible?
- —
Short-term bridge; refi at stabilization.
Climate risk First Street
- Flood 5/10 Major FEMA zone X (shaded) · 26% chance over 30 yrs
- Wildfire 5/10 Major
- Heat 4/10 Moderate 7 d/yr ≥102°F today · 19 d/yr by 30 yrs out
- Wind 2/10 Low 2% chance of damaging wind over 30 yrs
- Air quality 1/10 Low 0 unhealthy d/yr today · 0 by 30 yrs out
Nearby sold comps map
Loading sold comps map…
Walkable amenities ~0.75 mi
Loading nearby amenities…
Taxation est. · year 1
- Rental income
- $13,193
- − Mortgage interest
- −$5,041
- − Property taxes
- −$1,350
- − Insurance
- −$450
- − Repairs & maintenance
- −$1,055
- − Management
- −$1,055
- − Depreciation
- −$2,618
- Taxable income
- $1,623
- Est. tax owed @ 24.0%
- −$389
- After-tax cash flow
- $2,570/yr
For passive investors: Depreciation is non-cash, so a rental often shows a tax loss while cash-flowing — sheltering income. Rental losses are passive: they offset passive income freely, and up to $25,000/yr can offset ordinary (W-2) income if you actively participate and your MAGI is under $100k (phasing out to $0 by $150k); unused losses carry forward. On sale, claimed depreciation is recaptured at up to 25%, and gains may owe capital-gains tax (a 1031 exchange can defer both). Figures are a year-1 estimate at your 24.0% rate — not tax advice; consult a CPA.
Schools (NCES district)
- District
- Lawrence County
- NCES district ID
- 2103240
- Math proficiency
- 23% ▼ -17.00%
- Reading proficiency
- 42% ▼ -18.00%
- Median HH income
- $32,668
- Composite
- 26.55/100
- National rank
- #7189
- State rank
- #95 of 165 in KY
Livability — Louisa
- Score
- 61/100
- State rank
- #381
- US rank
- #18153
Category grades
Schools grade is shown separately in the Schools card above.
Census & demographics
- Population (ZIP)
- 12,399
Population outlook (Lawrence County) Hauer SSP2
- Today (2025)
- 15,462 people
- By 2030
- 15,038 · -2.7%
- By 2040
- 14,142 · -8.5%
- By 2050
- 13,292 · -14.0%
- By 2075
- 11,353 · -26.6%
- By 2100
- 9,417 · -39.1%
Race, ethnicity, and origin ACS 2023
- Neighborhood character
- Predominantly White (96%)
- Race & ethnicity
- White 96% Asian 2% Two or more races 1%
- Common ancestry
- Slovak 2% Serbian 1% Italian 1%
- Foreign-born
- 2%
- Languages at home
- 98% English-only · Chinese 2%
Political lean MEDSL · Lawrence
- 2024 margin
- Solid R (+67.2) · D 15.9% · R 83.1%
- 2008→2024 swing
- -41.3pp toward R · 2008: -26.0pp · 2024: -67.2pp
- All cycles
- 2024: R+67.2 2020: R+63.2 2016: R+62.5 2012: R+44.3 2008: R+26.0
Not yet ingested
- Civics
- —
Market trends
- HPI YoY
- ▲ 7.17%
- Current HPI
- 177.9918
- Rent YoY
- —
- Metro
- —
- State GDP YoY
- ▲ 1.81%
- F500 in state
- 4
Industry mix (Fortune 500 HQ in KY)
| Industry | F500 HQs | Revenue |
|---|---|---|
| Healthcare | 1 | $118B |
|
||
| Food / Beverage | 1 | $7B |
|
||
Property tax history
+0.6%/yrLatest (2024): $140 · +1.4% YoY. Source: county tax records.
Cash-flow waterfall
monthlySold comps — $/sqft
last 12 mo · ≤1 miLoading sold comps…