2607 Ramon Dr · Sierra View, PA
Flood risk No data
- FEMA flood zone
- —
- Chance of flooding over 30 yrs
- %
- Est. flood insurance / yr
- —
Fire risk No data
- Est. fire insurance / yr
- —
Heat risk No data
- Hot days now (above °F)
- days/yr
- Hot days in 30 yrs
- days/yr
Wind risk No data
- Chance of severe wind over 30 yrs
- %
Air-quality risk No data
- Unhealthy air days now
- days/yr
- Unhealthy air days in 30 yrs
- days/yr
Risk factors via First Street. Map © Google.
Why this score? — see what drove the C grade
The composite is a weighted blend of 9 inputs, each scored 0–100. Each bar is that input's sub-score; the figure is the points it added to the 100-point composite (weight × sub-score).
- Cash flow +16.3/30.0
- ARV discount +12.6/15.0
- Appreciation +5.2/10.0
- DSCR +5.0/10.0
- 1% rule +4.5/10.0
- Schools +4.0/10.0
- Livability +3.1/5.0
- Rent growth +2.5/5.0
- Condition / age +2.5/5.0
$315,000
🖨 Deal sheet 📄 Offer letter ✓ Due diligence
Listing remarks
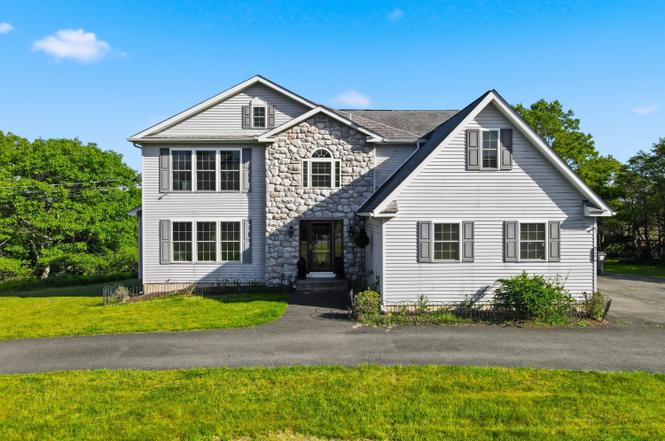
Spacious 4-Bedroom Colonial on 1 Acre in the Pocono Mountains Opportunity awaits in this spacious Colonial home set on a beautiful 1-acre lot in a desirable Pocono community. Featuring 4 bedrooms, 3 bathrooms, a 2-car garage, and a massive unfinished basement, this home offers space, functionality, and endless potential. Inside, you'll find hardwood flooring throughout much of the home, soaring ceilings, oversized windows, and a grand living room filled with natural light. The spacious family room features a beautiful stone propane fireplace, creating a warm and inviting gathering space. The true eat-in kitchen offers abundant cabinet and counter space, a center island, stainless steel a
Key facts
- Hardwood flooring
- 1 acre lot
- Eat-in kitchen
Tags
Neighborhood map
What this means for you Summary
Snapshot
- This is a 4-bed/2.5-bath single-family listed at $315k.
Deal economics
- At list price, monthly cash flow is $172 ($2k/yr) — positive.
- The deal already cash-flows at list — no discount required.
- To meet the 1% rule (rent ≥ 1% of price), the offer needs to be $300k (4.8% below list).
- Recommended offer: $300k (4.8% below list) — sets the bar for 1% rule.
- Cap rate 6.9% vs local median 3.5% in Sierra View — top-decile yield for the area; either an underpriced asset or a hidden risk that comps aren't pricing in. Stress-test before assuming the spread holds.
Location & tenants
- Location reads 62/100 on livability (#1,371 in PA) — a middle-class / working-renter tenant base. Strengths: cost of living A+, housing A+, crime B+; Watch: health & safety D, schools F, amenities F.
- Pocono Mountain SD (rural): math 37% / reading 55% proficiency, ranked #245 of 539 in PA (top 46%) — families likely to look elsewhere, expect single-tenant / working-renter base with shorter leases.
- Market conditions: 90 active listings in the ZIP; 1 comparable units currently listed for rent nearby; 278 units permitted in Monroe County in 2024 (52 in 5+ unit buildings).
Forward outlook
- In year one you build about $4k of equity ($2k loan paydown + $1k appreciation (0.5% local appreciation)).
- Monroe County population projected at -11% by 2050 — secular population decline; favor cash flow + early exit over multi-decade hold.
- At projected returns (0.5% appreciation + 3.0% rent growth), your $88k cash investment doubles in ~10 years — after that, you're playing with house money.
- By year 8, paydown + projected appreciation supports a ~$32k cash-out refi (75% LTV) — recoverable capital for the next deal without selling this one.
Negotiation context
- Only 1 days on market — expect competitive offers; lowballing is unlikely to land.
Questions for the listing agent
- What does the HOA fee cover, when was the last increase, and are there any pending special assessments or reserve-fund shortfalls?
- Is there a deadline driving the sale (1031 exchange, divorce, estate, relocation)? That informs how much negotiation room exists.
- Schools are F-rated, which usually means shorter tenancies and higher turnover. Who's the typical renter profile here, and what's been the actual vacancy rate?
- What's the average days-on-market for RENTAL listings here right now (not sales)? A rising rental-DOM trend means longer vacancies and softer asking-rent achievability than the comps imply.
- What's the recent tenant-quality profile in this submarket — average credit score on applications, eviction rate, late-payment / NSF rate, and stable-employment percentage? A property-management company in the area should have these aggregated.
- How much new for-sale + rental construction is in the pipeline within 1–3 miles? Heavy new supply typically softens prices + rents 12–24 months out; constrained supply supports both.
Investment metrics
- 1% rule
- 0.95% ✗
- Cap rate
- 6.95%
- Cash-on-cash
- 2.34%
- DSCR
- 1.10
- GRM
- 8.8
CMA / ARV
- ARV (on-the-fly)
- $355,488
- Comps found
- 12
Show comp detail 12 sales within ~0.75 mi
| Address | Dist | Beds/Ba | Sqft | Sold | Price | $/sf | Match |
|---|---|---|---|---|---|---|---|
| 2227 Cheyenne Dr | 0.06mi | 4/3.0 | 2,136 (+1%) | 10mo | $280,300 | $131 | 85 |
| 2337 Cheyenne Dr | 0.20mi | 4/2.5 | 2,024 (-4%) | 8mo | $414,900 | $205 | 77 |
| 1683 Allegheny Dr | 0.25mi | 3/2.0 (-1) | 2,160 (+2%) | 6mo | $289,000 | $134 | 73 |
| 2136 Palisades Dr | 0.53mi | 4/2.5 | 2,200 (+4%) | 9mo | $350,500 | $159 | 62 |
| 1977 Sun Valley Dr | 0.39mi | 3/2.0 (-1) | 2,008 (-5%) | 10mo | $319,000 | $159 | 58 |
| 2641 Yellowstone Dr | 0.57mi | 4/2.5 | 1,925 (-9%) | 4mo | $390,000 | $203 | 55 |
| 2111 Cheyenne Dr | 0.11mi | 3/2.0 (-1) | 1,820 (-14%) | 11mo | $337,000 | $185 | 55 |
| 2637 Marquette Dr | 0.41mi | 3/2.5 (-1) | 2,263 (+7%) | 18mo | $325,000 | $144 | 49 |
| 1139 Kindling Dr | 0.53mi | 4/3.0 | 2,014 (-5%) | 21mo | $425,000 | $211 | 48 |
| 2421 Allegheny Dr | 0.34mi | 4/2.5 | 2,360 (+12%) | 22mo | $270,001 | $114 | 46 |
| 1960 Sun Valley Dr | 0.58mi | 3/2.5 (-1) | 1,800 (-15%) | 13mo | $350,000 | $194 | 32 |
| 2538 Allegheny Dr | 0.55mi | 3/2.0 (-1) | 1,840 (-13%) | 22mo | $310,000 | $168 | 27 |
Match score weights: distance 35% · size 25% · config 20% · recency 20%. Top-matched comps best support the ARV.
Projected returns pro-forma
0.47% appreciation · 3.0% rent growth · sell at horizon
- IRR
- 2.0%
- Equity multiple
- 1.10×
- Total profit
- $8,799
- Equity at exit
- $98,907
- IRR
- 7.1%
- Equity multiple
- 1.81×
- Total profit
- $71,401
- Equity at exit
- $125,003
Cash invested: $88,200 (down + closing). Projections, not guarantees.
Landlord ↔ Tenant lean methodology
- Overall (STATE)
- 62 Landlord-Friendly
- State Pennsylvania
- 62 Landlord-Friendly · EVEN
- County
- — inherits STATE
- City
- — inherits STATE
ZIP-level market 18610
- Home prices YoY
- 0.3%
- Active inventory
- 90
- Price-to-rent
- 8.8×
Monthly cashflow live
- Estimated rent
- $3,000 medium interval (Pro) →
- Mortgage (P&I)
- −$1,652
- Tax est. 1.5%
- −$394 /mo · $4,725/yr
- Insurance
- −$131
- HOA
- −$21
- Vacancy / Maint / Mgmt
- −$630
- Net cashflow
- $172
Break-even live
UW: 25.0% down · 7.5% · 30yr · 1.5% tax · 5.0% vac · 8.0% maint · 8.0% mgmt
Financing live
Cash to close
- Down payment
- $78,750
- Closing costs
- $9,450
- Reserves months
- —
- Total cash needed
- —
Loan-product check · same deal, 3 products live
Conventional
25% down · 7.5% · 30yr
- Down + closing
- —
- Monthly P&I
- —
- Monthly cashflow
- —
- DSCR
- —
- Eligible?
- —
Personal DTI + credit; lowest rate.
DSCR
20% down · 8.5% · 30yr
- Down + closing
- —
- Monthly P&I
- —
- Monthly cashflow
- —
- DSCR
- —
- Eligible?
- —
No personal income docs; deal must DSCR.
Hard money
10% down · 12.0% · 12mo
- Down + closing
- —
- Monthly P&I
- —
- Monthly cashflow
- —
- DSCR
- —
- Eligible?
- —
Short-term bridge; refi at stabilization.
Rent comps 1 comps
| Address | Beds | Baths | Sqft | Rent | $/sqft | DOM | Units | Dist |
|---|---|---|---|---|---|---|---|---|
| 2662 Tacoma Dr Blakeslee, PA | 4.0 | 3.5 | 2412 | $3,000 | $1.24 | 21d | 1 | 0.34mi |
HOA detail
- Monthly dues
- $21 · $252/yr
Listing history 2 events
-
2026-06-19remarks 699-char remark
-
2026-06-19$315,000 Active 1 DOM
ⓘ Source: listings_history table (triggers on properties + properties_extension) + one-shot
backfill from property_details.listing_events for pre-trigger history.
Nearby sold comps map
Loading sold comps map…
Walkable amenities ~0.75 mi
Loading nearby amenities…
Taxation est. · year 1
- Rental income
- $36,000
- − Mortgage interest
- −$17,645
- − Property taxes
- −$4,725
- − Insurance
- −$1,575
- − Repairs & maintenance
- −$2,880
- − Management
- −$2,880
- − HOA
- −$252
- − Depreciation
- −$9,164
- Taxable loss
- −$3,121
- Est. tax savings @ 24.0%
- +$749
- After-tax cash flow
- $2,814/yr
For passive investors: Depreciation is non-cash, so a rental often shows a tax loss while cash-flowing — sheltering income. Rental losses are passive: they offset passive income freely, and up to $25,000/yr can offset ordinary (W-2) income if you actively participate and your MAGI is under $100k (phasing out to $0 by $150k); unused losses carry forward. On sale, claimed depreciation is recaptured at up to 25%, and gains may owe capital-gains tax (a 1031 exchange can defer both). Figures are a year-1 estimate at your 24.0% rate — not tax advice; consult a CPA.
Schools (NCES district)
- District
- Pocono Mountain SD
- NCES district ID
- 4219500
- Math proficiency
- 37% ▼ -5.00%
- Reading proficiency
- 55% ▲ 1.00%
- Median HH income
- $55,317
- Composite
- 39.91/100
- National rank
- #3856
- State rank
- #245 of 539 in PA
Livability — Sierra View
- Score
- 62/100
- State rank
- #1371
- US rank
- #17228
Category grades
Schools grade is shown separately in the Schools card above.
Census & demographics
- Census place
- Sierra View, PA
- Population (ZIP)
- 4,373
Population outlook (Monroe County) Hauer SSP2
- Today (2025)
- 164,099 people
- By 2030
- 161,412 · -1.6%
- By 2040
- 154,616 · -5.8%
- By 2050
- 146,710 · -10.6%
- By 2075
- 140,830 · -14.2%
- By 2100
- 138,472 · -15.6%
Race, ethnicity, and origin ACS 2023
- Neighborhood character
- Highly diverse neighborhood (Simpson 0.73)
- Race & ethnicity
- White 46% Hispanic / Latino 17% Black 15% Two or more races 10% Asian 7%
- Hispanic origin (detail)
- Puerto Rican 13%
- Common ancestry
- Romanian 6% Subsaharan African 2% Iranian 1%
- Foreign-born
- 9% · Canada
- Languages at home
- 85% English-only · Spanish 9% Tagalog/Filipino 3% Russian/Polish/Slavic 2%
Political lean MEDSL · Monroe
- 2024 margin
- Toss-up / Even · D 49.1% · R 49.9%
- 2008→2024 swing
- -17.1pp toward R · 2008: 16.3pp · 2024: -0.8pp
- All cycles
- 2024: R+0.8 2020: D+6.4 2016: D+0.3 2012: D+14.0 2008: D+16.3
Not yet ingested
- Civics
- —
Market trends
- HPI YoY
- ▲ 0.47%
- Current HPI
- 181.9087
- Rent YoY
- —
- Metro
- —
- State GDP YoY
- ▲ 1.68%
- F500 in state
- 34
Industry mix (Fortune 500 HQ in PA)
| Industry | F500 HQs | Revenue |
|---|---|---|
| Healthcare | 2 | $309B |
|
||
| Insurance | 2 | $27B |
|
||
| Telecommunications / Media | 1 | $124B |
|
||
| Industrial Distribution | 1 | $22B |
|
||
| Financial Services | 1 | $20B |
|
||
| Chemicals / Materials | 1 | $18B |
|
||
Cash-flow waterfall
monthlySold comps — $/sqft
last 12 mo · ≤1 miLoading sold comps…