 Duplex
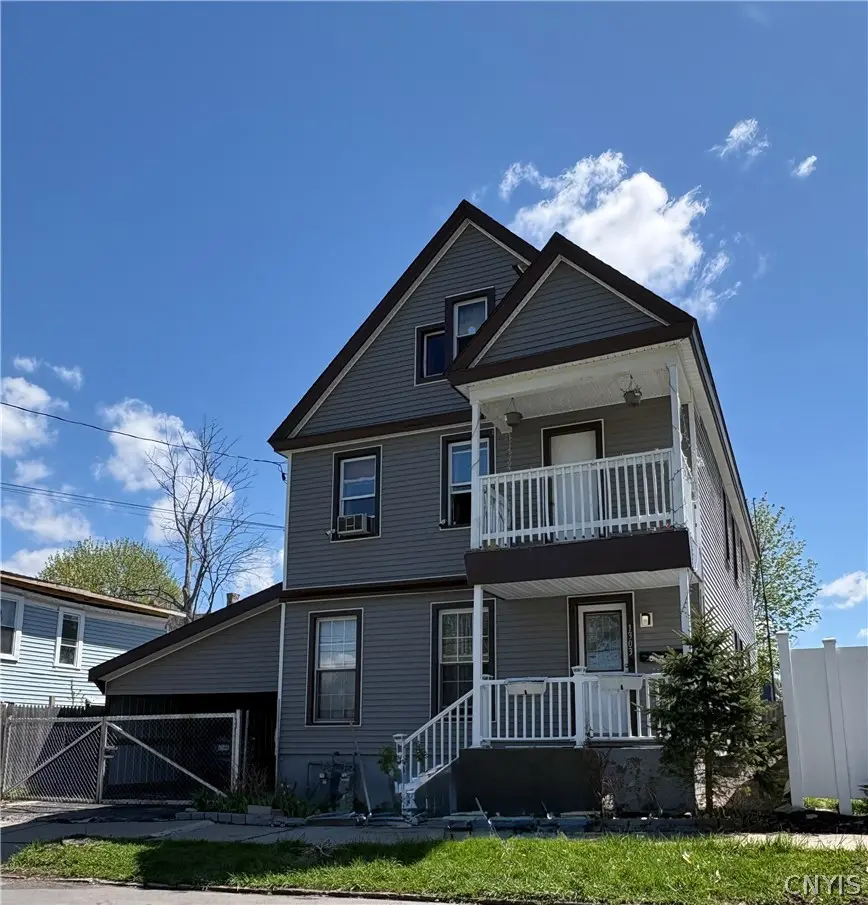
1303 Neilson St · Utica, NY
Flood risk 1/10 · Minimal
- FEMA flood zone
- X (unshaded)
- Chance of flooding over 30 yrs
- 0.0%
- Est. flood insurance / yr
- $473 – $860
Fire risk 1/10 · Minimal
- Est. fire insurance / yr
- $691 – $1,283
Heat risk 3/10 · Minor
- Hot days now (above 95°F)
- 7 days/yr
- Hot days in 30 yrs
- 17 days/yr
Wind risk 2/10 · Minimal
- Chance of severe wind over 30 yrs
- 1.0%
Air-quality risk 2/10 · Minimal
- Unhealthy air days now
- 0 days/yr
- Unhealthy air days in 30 yrs
- 1 days/yr
Risk factors via First Street. Map © Google.
Why this score? — see what drove the B- grade
The composite is a weighted blend of 9 inputs, each scored 0–100. Each bar is that input's sub-score; the figure is the points it added to the 100-point composite (weight × sub-score).
- Cash flow +29.5/30.0
- DSCR +10.0/10.0
- Appreciation +10.0/10.0
- 1% rule +7.0/10.0
- Livability +4.0/5.0
- Schools +2.9/10.0
- Rent growth +2.5/5.0
- Condition / age +2.5/5.0
- ARV discount +0.0/15.0
$249,000
🖨 Deal sheet (PDF) 📄 Offer letter ✓ Due diligence
Multi-family units
County records classify this as Multi-Family (2-4 Unit). Listing-text estimate: 2 units. confirmed
Listing remarks
Beautiful, well-maintained two-family home with a finished attic and numerous upgrades. Recent improvements include new water heaters, furnaces, roof, siding, and spray foam insulation throughout the home and basement. The first-floor unit features three bedrooms, while the second-floor unit offers two spacious bedrooms.
Key facts
- 2,760 sq ft lot
- Parking
- Built 1920
Property features AI
Finance
- Other: Operating expenses include insurance, maintenance (structure and general), snow removal, and water/sewer
- Financial info: Two-unit property with separate gas and electric meters for each unit; Tenant(s) pay all utilities; Reported rent for one unit: $700 (month-to-month)
Exterior
- Parking: Carport
- Utilities: Public water (connected); Sewer connected
- Home design: Two-story building; Existing property (resale)
- Construction: Vinyl siding; Spray foam insulation
- Exterior features: Rectangular residential lot; City street frontage; Lot dimensions approximately 46 x 60
Interior
- Kitchen: Oven/Range; Refrigerator; Formal dining area
- Bedrooms: One unit with 2 bedrooms; One unit with 3 bedrooms
- Flooring: Tile; Vinyl; Varies
- Bathrooms: Three full bathrooms total (unit breakdown: one unit with 2 full baths, one unit with 1 full bath)
- Heating & cooling: Gas forced-air heating
- Interior features: Attic; Full basement
- Laundry & utility: Electric water heater
Neighborhood map
What this means for you Summary
Snapshot
- This is a 2 × 2-bed/1.5-bath units multifamily listed at $249k.
Deal economics
- At list price, monthly cash flow is $890 ($11k/yr) — positive. Per door: $445/mo.
- The deal already cash-flows at list — no discount required.
- Meets the 1% rule at list price ($3k rent vs $249k).
- Recommended offer: $242k (3.0% below list) — sets the bar for market timing.
- Cap rate 10.6% vs local median 7.7% in Utica — top-decile yield for the area; either an underpriced asset or a hidden risk that comps aren't pricing in. Stress-test before assuming the spread holds.
Location & tenants
- Location reads 80/100 on livability (#104 in NY, #1,589 nationally) — a professional / high-income tenant draw. Strengths: commute A+, cost of living A+, housing A+; Watch: employment D, crime F.
- Utica City School District (urban): math 33% / reading 38% proficiency, ranked #562 of 590 in NY (top 95%) — families likely to look elsewhere, expect single-tenant / working-renter base with shorter leases; 71% free/reduced lunch — lower-income household profile, screen leases tightly.
- Zoned schools: Martin Luther King Jr Elementary School (math 17% / reading 27%, grade F, #1,923 of 2,108 statewide, top 92%, 303 students, 91% FRL); John F Kennedy Middle School (math 27% / reading 35%, grade F, #534 of 729 statewide, top 73%, 695 students, 77% FRL); Thomas R Proctor High School (math 86% / reading 62%, grade B+, #659 of 1,100 statewide, top 60%, 2,675 students, 76% FRL).
- Market conditions: 144 active listings in the ZIP; 204 units permitted in Oneida County in 2024 (68 in 5+ unit buildings).
Forward outlook
- In year one you build about $27k of equity ($2k loan paydown + $25k appreciation (10.0% local appreciation)).
- Oneida County population projected at -12% by 2050 — secular population decline; favor cash flow + early exit over multi-decade hold.
- At projected returns (10.0% appreciation + 3.0% rent growth), your $70k cash investment doubles in ~2 years — after that, you're playing with house money.
- By year 2, paydown + projected appreciation supports a ~$43k cash-out refi (75% LTV) — recoverable capital for the next deal without selling this one.
Negotiation context
- It's been on market 56 days — a 3% lower offer ($242k) is reasonable based on typical stale-listing flexibility.
- 2 sale attempts since 20y ago with the ask held roughly flat each time — persistent listings suggest the price (not the market) is what's stuck; bring a comps-based counter.
- Current owner paid $16k; list at $249k implies a 1453% gain — meaningful room to come down on a strong offer.
Risks & watch-outs
- Watch-outs: built in 1920 — expect roof / HVAC / electrical / plumbing capex.
Questions for the listing agent
- It's been on market 56 days. Have you received any prior offers? Is the seller open to a 3% concession, seller financing, or rate buy-down credit?
- Can we see the unit-by-unit rent roll, current vacancy, and any below-market leases? What's the average tenancy length?
- What capital expenditures (roof, boiler, parking lot, exteriors) have been made in the last 5 years, and what's planned in the next 2?
- Built in 1920 — when were the roof, HVAC, electrical panel, plumbing, and water heater last replaced?
- Is there a deadline driving the sale (1031 exchange, divorce, estate, relocation)? That informs how much negotiation room exists.
- Schools are D-rated, which usually means shorter tenancies and higher turnover. Who's the typical renter profile here, and what's been the actual vacancy rate?
- Crime grade is F in this area — have there been break-ins, vandalism, or insurance claims at this property in the last 3 years? What carrier currently insures it and at what premium?
- What's the average days-on-market for RENTAL listings here right now (not sales)? A rising rental-DOM trend means longer vacancies and softer asking-rent achievability than the comps imply.
- What's the recent tenant-quality profile in this submarket — average credit score on applications, eviction rate, late-payment / NSF rate, and stable-employment percentage? A property-management company in the area should have these aggregated.
- How much new apartment / multifamily construction is in the pipeline within 1–3 miles? Heavy new supply (>2% of stock underway) typically softens rents 12–24 months out; light construction supports rent growth.
Investment metrics
- 1% rule
- 1.20% ✓
- Cap rate
- 10.58%
- Cash-on-cash
- 15.32%
- DSCR
- 1.68
- GRM
- 7.0
CMA / ARV
- ARV (median comp)
- $202,001
- List price
- $249,000
- Delta
- 23.27%
- Verdict
- OVERPRICED
- Comps
- 20 within 1.0 mi
Show comp detail 9 sales within ~0.75 mi
| Address | Dist | Beds/Ba | Sqft | Sold | Price | $/sf | Match |
|---|---|---|---|---|---|---|---|
| 1534 Brinckerhoff Ave | 0.31mi | 5/2.0 (-1) | 2,044 (+2%) | 1mo | $158,000 | $77 | 76 |
| 141 Eagle St | 0.35mi | 5/2.0 (-1) | 2,193 (+10%) | 6mo | $36,500 | $17 | 58 |
| 1529 Dudley Ave | 0.31mi | 6/2.0 | 2,194 (+10%) | 21mo | $55,000 | $25 | 52 |
| 1004 Rudolph Pl | 0.67mi | 6/2.0 | 2,112 (+6%) | 10mo | $145,000 | $69 | 51 |
| 514 Mary St | 0.68mi | 5/2.0 (-1) | 2,096 (+5%) | 13mo | $75,000 | $36 | 44 |
| 1415 Elm St | 0.39mi | 5/2.0 (-1) | 2,260 (+13%) | 19mo | $90,000 | $40 | 39 |
| 629 Lansing St | 0.72mi | 6/2.0 | 1,840 (-8%) | 18mo | $59,900 | $33 | 38 |
| 504 Arthur St | 0.31mi | 6/3.0 | 2,288 (+14%) | 24mo | $130,000 | $57 | 38 |
| 1681 West St | 0.66mi | 6/2.0 | 2,216 (+11%) | 21mo | $200,000 | $90 | 34 |
Match score weights: distance 35% · size 25% · config 20% · recency 20%. Top-matched comps best support the ARV.
Projected returns pro-forma
10.0% appreciation · 3.0% rent growth · sell at horizon
- IRR
- 35.6%
- Equity multiple
- 3.76×
- Total profit
- $192,172
- Equity at exit
- $224,319
- IRR
- 30.6%
- Equity multiple
- 8.47×
- Total profit
- $521,121
- Equity at exit
- $483,752
Cash invested: $69,720 (down + closing). Projections, not guarantees.
Landlord ↔ Tenant lean methodology
- Overall (STATE)
- 15 Strongly Tenant-Friendly
- State New York
- 15 Strongly Tenant-Friendly · D+10
- County
- — inherits STATE
- City
- — inherits STATE
ZIP-level market 13501
- Home prices YoY
- 5.6%
- Active inventory
- 144
- Price-to-rent
- 13.9×
Monthly cashflow live
- Estimated rent
- $2,978 high interval (Pro) →
- Mortgage (P&I)
- −$1,306
- Tax from tax record
- −$53 /mo · $639/yr
- Insurance
- −$104
- HOA
- −$0
- Lot rent
- −$0
- Vacancy / Maint / Mgmt
- −$625
- Net cashflow
- $890
Break-even live
Sensitivity live
| Price | -10% $1,031 | -5% $960 | +0% $890 | +5% $819 | +10% $749 |
|---|---|---|---|---|---|
| Rent | -10% $655 | -5% $772 | +0% $890 | +5% $1,007 | +10% $1,125 |
| Rate | -1.0pp $1,015 | -0.5pp $953 | base $890 | +0.5pp $825 | +1.0pp $760 |
2-unit breakdown (identical units grouped — click to expand)
| Units | Beds | Baths | Est. rent |
|---|---|---|---|
| 2× units | 2 | 1.5 | $2,978 |
| #1 | 2 | 1.5 | $1,489 |
| #2 | 2 | 1.5 | $1,489 |
| Total (2 units) | $2,978 | ||
UW: 25.0% down · 7.5% · 30yr · 1.5% tax · 5.0% vac · 8.0% maint · 8.0% mgmt
Financing live
Cash to close
- Down payment
- $62,250
- Closing costs
- $7,470
- Reserves months
- —
- Total cash needed
- —
Loan-product check · same deal, 3 products live
Conventional
25% down · 7.5% · 30yr
- Down + closing
- —
- Monthly P&I
- —
- Monthly cashflow
- —
- DSCR
- —
- Eligible?
- —
Personal DTI + credit; lowest rate.
DSCR
20% down · 8.5% · 30yr
- Down + closing
- —
- Monthly P&I
- —
- Monthly cashflow
- —
- DSCR
- —
- Eligible?
- —
No personal income docs; deal must DSCR.
Hard money
10% down · 12.0% · 12mo
- Down + closing
- —
- Monthly P&I
- —
- Monthly cashflow
- —
- DSCR
- —
- Eligible?
- —
Short-term bridge; refi at stabilization.
Listing history 22 events
-
2026-06-23days on market $249,000 Active 56 DOM
-
2026-06-22days on market $249,000 Active 55 DOM
-
2026-06-19days on market $249,000 Active 53 DOM
-
2026-06-18days on market $249,000 Active 52 DOM
-
2026-06-17days on market $249,000 Active 51 DOM
-
2026-06-16days on market $249,000 Active 50 DOM
-
2026-06-15days on market $249,000 Active 49 DOM
-
2026-06-14days on market $249,000 Active 47 DOM
-
2026-06-13days on market $249,000 Active 46 DOM
-
2026-06-10days on market $249,000 Active 44 DOM
-
2026-06-09days on market $249,000 Active 43 DOM
-
2026-06-08days on market $249,000 Active 42 DOM
-
2026-06-07days on market $249,000 Active 41 DOM
-
2026-06-03days on market $249,000 Active 37 DOM
-
2026-06-02days on market $249,000 Active 36 DOM
-
2026-06-01days on market $249,000 Active 35 DOM
-
2026-05-31days on market $249,000 Active 34 DOM
-
2026-05-30days on market $249,000 Active 33 DOM
-
2026-04-27$249,000 Active 322-char remark
-
2006-11-08historical
-
2006-09-05$59,900
-
2002-02-13soldstatus $16,038
ⓘ Source: listings_history table (triggers on properties + properties_extension) + one-shot
backfill from property_details.listing_events for pre-trigger history.
Tax reassessment forecast NY · Partial reset (capped growth)
- Current annual tax
- $639 · $53/mo
- Projected year-2 tax
- $2,424 · $202/mo
- Expected delta
- +$1,784/yr (+$149/mo · 279.2%)
ⓘ Screening estimate from a state-policy table — verify with the county assessor before closing.
Climate risk First Street
- Flood 1/10 Low FEMA zone X (unshaded) · 0% chance over 30 yrs
- Wildfire 1/10 Low
- Heat 3/10 Moderate 7 d/yr ≥95°F today · 17 d/yr by 30 yrs out
- Wind 2/10 Low 100% chance of damaging wind over 30 yrs
- Air quality 2/10 Low 0 unhealthy d/yr today · 1 by 30 yrs out
Nearby sold comps map
Loading sold comps map…
Walkable amenities ~0.75 mi
Loading nearby amenities…
Taxation est. · year 1
- Rental income
- $35,736
- − Mortgage interest
- −$13,948
- − Property taxes
- −$639
- − Insurance
- −$1,245
- − Repairs & maintenance
- −$2,859
- − Management
- −$2,859
- − Depreciation
- −$7,244
- Taxable income
- $6,943
- Est. tax owed @ 24.0%
- −$1,666
- After-tax cash flow
- $9,012/yr
For passive investors: Depreciation is non-cash, so a rental often shows a tax loss while cash-flowing — sheltering income. Rental losses are passive: they offset passive income freely, and up to $25,000/yr can offset ordinary (W-2) income if you actively participate and your MAGI is under $100k (phasing out to $0 by $150k); unused losses carry forward. On sale, claimed depreciation is recaptured at up to 25%, and gains may owe capital-gains tax (a 1031 exchange can defer both). Figures are a year-1 estimate at your 24.0% rate — not tax advice; consult a CPA.
Schools (NCES district)
- District
- Utica City School District
- NCES district ID
- 3629370
- Math proficiency
- 33% ▼ -7.00%
- Reading proficiency
- 38% ▲ 2.00%
- Median HH income
- $31,834
- Composite
- 29.01/100
- National rank
- #6613
- State rank
- #562 of 590 in NY
Livability — Utica
- Score
- 80/100
- State rank
- #104
- US rank
- #1589
Category grades
Schools grade is shown separately in the Schools card above.
Census & demographics
- Census place
- Utica, NY
- County
- Oneida County · 89,710 people
- City population
- 72,968
- Metro
- Utica-Rome, NY
- Population (ZIP)
- 38,931
- Household income
- $52,548
- Rent vs Own
- Severe rent burden
- 2251.0
Population outlook (Oneida County) Hauer SSP2
- Today (2025)
- 225,223 people
- By 2030
- 220,384 · -2.1%
- By 2040
- 209,071 · -7.2%
- By 2050
- 197,920 · -12.1%
- By 2075
- 175,541 · -22.1%
- By 2100
- 148,491 · -34.1%
Race, ethnicity, and origin ACS 2023
- Neighborhood character
- Highly diverse neighborhood (Simpson 0.70)
- Race & ethnicity
- White 49% Two or more races 15% Hispanic / Latino 14% Black 14% Asian 14%
- Hispanic origin (detail)
- Puerto Rican 8% Dominican 4%
- Common ancestry
- American 8% Romanian 3% Lithuanian 1%
- Foreign-born
- 25% · Canada, Philippines, Vietnam
- Languages at home
- 62% English-only · Other Asian/Pacific 11% Russian/Polish/Slavic 10% Spanish 9%
Political lean MEDSL · Oneida
- 2024 margin
- Strong R (+21.3) · D 39.4% · R 60.6%
- 2008→2024 swing
- -15.2pp toward R · 2008: -6.1pp · 2024: -21.3pp
- All cycles
- 2024: R+21.3 2020: R+15.5 2016: R+21.1 2012: R+5.3 2008: R+6.1
Not yet ingested
- Civics
- —
Market trends
- HPI YoY
- ▲ 20.28%
- Current HPI
- 382.3726
- Rent YoY
- —
- Metro
- Utica-Rome, NY
- State GDP YoY
- ▲ 2.60%
- F500 in state
- 92
Industry mix (Fortune 500 HQ in NY)
| Industry | F500 HQs | Revenue |
|---|---|---|
| Financial Services | 10 | $950B |
|
||
| Consumer Goods | 9 | $162B |
|
||
| Insurance | 4 | $225B |
|
||
| Telecommunications | 2 | $144B |
|
||
| Pharmaceuticals | 2 | $112B |
|
||
| Media / Entertainment | 2 | $69B |
|
||
Price history
+1452.6% since first listed4 events — show timeline
- 2026-04-27 Listed $249,000 CNYIS
- 2006-11-08 Listing Removed — CNYIS
- 2006-09-05 Listed $59,900 CNYIS
- 2002-02-13 Sold (Public Records) $16,038 Public Records
Property tax history
-4.4%/yrLatest (2025): $639 · +101.7% YoY. Source: county tax records.
Cash-flow waterfall
monthlySold comps — $/sqft
last 12 mo · ≤1 miLoading sold comps…