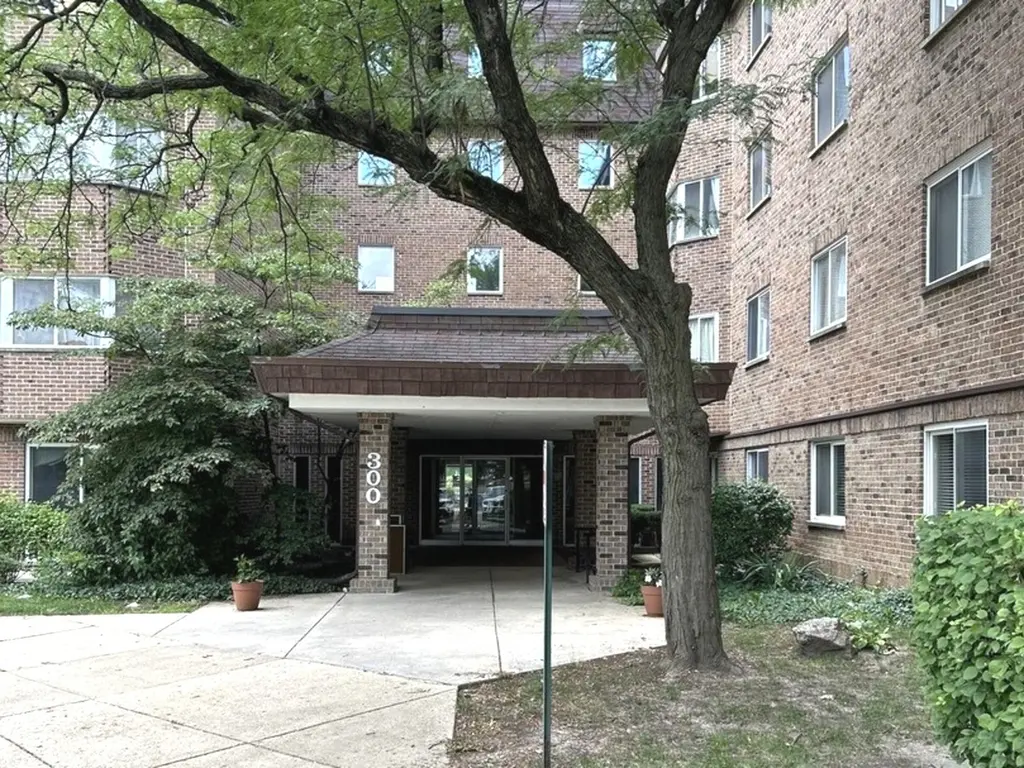
300 Roselle Rd #419 · Schaumburg, IL
Flood risk 4/10 · Minor
- FEMA flood zone
- X (unshaded)
- Chance of flooding over 30 yrs
- 0.2%
- Est. flood insurance / yr
- $507 – $1,088
Fire risk 1/10 · Minimal
- Est. fire insurance / yr
- $804 – $1,492
Heat risk 3/10 · Minor
- Hot days now (above 101°F)
- 7 days/yr
- Hot days in 30 yrs
- 14 days/yr
Wind risk 2/10 · Minimal
- Chance of severe wind over 30 yrs
- 0.0%
Air-quality risk 3/10 · Minor
- Unhealthy air days now
- 3 days/yr
- Unhealthy air days in 30 yrs
- 3 days/yr
Risk factors via First Street. Map © Google.
Why this score? — see what drove the D grade
The composite is a weighted blend of 9 inputs, each scored 0–100. Each bar is that input's sub-score; the figure is the points it added to the 100-point composite (weight × sub-score).
- Cash flow +13.3/30.0
- ARV discount +7.5/15.0
- 1% rule +6.0/10.0
- DSCR +4.0/10.0
- Schools +4.0/10.0
- Livability +4.0/5.0
- Rent growth +3.3/5.0
- Condition / age +2.5/5.0
- Appreciation +0.0/10.0
$174,900
🖨 Deal sheet (PDF) 📄 Offer letter ✓ Due diligence
Listing remarks
Great opportunity for a 4th floor, one bedroom condo in the desirable Town Square community in the heart of Schaumburg. The open-concept floorplan offers a bright and spacious living room with bay window that flows into a dining area. The kitchen boasts plenty of cabinet space for storage and a newer stove. Enjoy a generously sized bedroom and a full bath with a tub. Resort-style amenities include an outdoor pool, clubhouse, tennis courts, and more. Conveniently located near Tony's Fresh Market, Oberweis Dairy, Bone Fish Grill, Schaumburg Township Public Library, Dirksen Elementary School, the Metra station, and easy access to the interstate. Great investment opportunity!
Key facts
- Newer stove
- 4th floor
- Bay window
Tags
Property features AI
Finance
- Financial info: Special Service Area: No
- HOA & community: Monthly association fee of $289; Association fee includes heat, water, parking, insurance, pool, exterior maintenance, lawn care, and snow removal; Building amenities: coin laundry, storage, park, party room, pool, service elevators, tennis courts, on-site manager; Pets allowed (cats OK); management on-site
Exterior
- Parking: Two parking spaces (unassigned, off-street)
- Security: Security door locks available in building
- Utilities: Water source: Lake Michigan; Public sewer; Electric service with circuit breakers
- Home design: Attached single condo; Entry on fourth level; Property is in a mid-century building (built 51–60 years ago)
- Construction: Brick construction; Building constructed prior to 1978
- Exterior features: Common lot/grounds; Access to commuter train
Interior
- Kitchen: Galley kitchen with eating area/table space (Fourth level); Range; Dishwasher; Refrigerator; Disposal
- Bedrooms: Master bedroom (Fourth level) — carpet flooring, 14 x 12; Additional bedrooms (listed) — carpet flooring
- Flooring: Carpet in living areas and bedrooms; Vinyl flooring in kitchen
- Bathrooms: 1 full bathroom
- Heating & cooling: Natural gas forced air heating; Central air conditioning
- Interior features: Four total rooms; All windows have window treatments; CO detectors installed
- Laundry & utility: Laundry in common area
Neighborhood map
What this means for you Summary
Snapshot
- This is a 1-bed/1.0-bath condo listed at $175k.
Deal economics
- At list price, monthly cash flow is $-1 ($-17/yr) — negative.
- To cash-flow at today's rent, offer at most $175k (0.1% below list).
- Meets the 1% rule at list price ($2k rent vs $175k).
- Recommended offer: $175k (0.1% below list) — sets the bar for cash-flow.
- Cap rate 6.3% vs local median 3.7% in Schaumburg — top-decile yield for the area; either an underpriced asset or a hidden risk that comps aren't pricing in. Stress-test before assuming the spread holds.
Location & tenants
- Location reads 79/100 on livability (#124 in IL, #2,162 nationally) — a middle-class / working-renter tenant base. Strengths: employment A+, housing A+, crime B+; Watch: health & safety C-, amenities D+, commute F.
- Township Hsd 211 (urban): math 45% / reading 43% proficiency, ranked #89 of 620 in IL (top 14%) — families likely to look elsewhere, expect single-tenant / working-renter base with shorter leases.
- Zoned schools: Everett Dirksen Elementary Sch (math 37% / reading 42%, grade F, #392 of 2,056 statewide, top 21%, 529 students, 0% FRL); Robert Frost Jhs (math 48% / reading 47%, grade C-, #69 of 665 statewide, top 11%, 677 students, 0% FRL); Schaumburg High School (math 48% / reading 40%, grade F, #68 of 693 statewide, top 10%, 2,340 students, 0% FRL).
- Market conditions: Rents rising (+3.3%/yr); 100 active listings in the ZIP; 17 comparable units currently listed for rent nearby; rentals at typical pace (median 15d on market — plan ~3-4 weeks tenant-placement turnaround); solid renter incomes; 6,272 units permitted in Cook County in 2024 (4,658 in 5+ unit buildings).
Forward outlook
- Local home prices are declining (-3.0%/yr); year-one equity from $1k of loan paydown is wiped out by about $5k of value loss. Plan a longer hold.
Negotiation context
- Only 9 days on market — expect competitive offers; lowballing is unlikely to land.
- 10 sale attempts since 20y ago with the ask held roughly flat each time — persistent listings suggest the price (not the market) is what's stuck; bring a comps-based counter.
- Current owner paid $96k; list at $175k implies a 82% gain — meaningful room to come down on a strong offer.
Questions for the listing agent
- What do current leases actually rent for vs. the listed asking? Can we see a recent rent roll and the last 12 months of T-12 income?
- Built in 1970 — when were the roof, HVAC, electrical panel, plumbing, and water heater last replaced?
- What does the HOA fee cover, when was the last increase, and are there any pending special assessments or reserve-fund shortfalls?
- Any open or pending special assessments — roof, HVAC, plumbing, elevator, façade? What's the per-unit balance and payoff schedule, and is the seller paying it off at close or rolling it to the buyer?
- Is there a deadline driving the sale (1031 exchange, divorce, estate, relocation)? That informs how much negotiation room exists.
- Schools are A-rated — typically a magnet for longer-tenancy family renters. What's the average tenant stay here, and is there a school-zone premium baked into asking?
- The area grade is low — what's the realistic commute time and amenity access for the typical tenant pool here? Any planned neighborhood developments (good or bad) we should know about?
- What's the average days-on-market for RENTAL listings here right now (not sales)? A rising rental-DOM trend means longer vacancies and softer asking-rent achievability than the comps imply.
- What's the recent tenant-quality profile in this submarket — average credit score on applications, eviction rate, late-payment / NSF rate, and stable-employment percentage? A property-management company in the area should have these aggregated.
- How much new apartment / multifamily construction is in the pipeline within 1–3 miles? Heavy new supply (>2% of stock underway) typically softens rents 12–24 months out; light construction supports rent growth.
Investment metrics
- 1% rule
- 1.10% ✓
- Cap rate
- 6.28%
- Cash-on-cash
- -0.04%
- DSCR
- 1.00
- GRM
- 7.6
CMA / ARV
No comps found within radius.
Projected returns pro-forma
-3.0% appreciation · 3.32% rent growth · sell at horizon
- IRR
- -15.8%
- Equity multiple
- 0.44×
- Total profit
- $-27,589
- Equity at exit
- $26,078
- IRR
- -6.4%
- Equity multiple
- 0.58×
- Total profit
- $-20,674
- Equity at exit
- $15,122
Cash invested: $48,972 (down + closing). Projections, not guarantees.
Landlord ↔ Tenant lean methodology
- Overall (STATE)
- 43 Moderately Tenant-Leaning
- State Illinois
- 43 Moderately Tenant-Leaning · D+7
- County
- — inherits STATE
- City
- — inherits STATE
ZIP-level market 60193
- Rents YoY
- 3.3%
- Active inventory
- 100
- Price-to-rent
- 7.6×
Monthly cashflow live
- Estimated rent
- $1,925 high interval (Pro) →
- Mortgage (P&I)
- −$917
- Tax from tax record
- −$243 /mo · $2,914/yr
- Insurance
- −$73
- HOA
- −$289
- Vacancy / Maint / Mgmt
- −$404
- Net cashflow
- $-1
Break-even live
Sensitivity live
| Price | -10% $98 | -5% $48 | +0% $-1 | +5% $-51 | +10% $-100 |
|---|---|---|---|---|---|
| Rent | -10% $-153 | -5% $-77 | +0% $-1 | +5% $75 | +10% $151 |
| Rate | -1.0pp $87 | -0.5pp $43 | base $-1 | +0.5pp $-47 | +1.0pp $-93 |
UW: 25.0% down · 7.5% · 30yr · 1.5% tax · 5.0% vac · 8.0% maint · 8.0% mgmt
Financing live
Cash to close
- Down payment
- $43,725
- Closing costs
- $5,247
- Reserves months
- —
- Total cash needed
- —
Loan-product check · same deal, 3 products live
Conventional
25% down · 7.5% · 30yr
- Down + closing
- —
- Monthly P&I
- —
- Monthly cashflow
- —
- DSCR
- —
- Eligible?
- —
Personal DTI + credit; lowest rate.
DSCR
20% down · 8.5% · 30yr
- Down + closing
- —
- Monthly P&I
- —
- Monthly cashflow
- —
- DSCR
- —
- Eligible?
- —
No personal income docs; deal must DSCR.
Hard money
10% down · 12.0% · 12mo
- Down + closing
- —
- Monthly P&I
- —
- Monthly cashflow
- —
- DSCR
- —
- Eligible?
- —
Short-term bridge; refi at stabilization.
Rent comps 17 comps
| Address | Beds | Baths | Sqft | Rent | $/sqft | DOM | Units | Dist |
|---|---|---|---|---|---|---|---|---|
| 220 S Roselle Rd #224 Schaumburg, IL | 2.0 | 1.5 | 925 | $1,850 | $2.00 | 1d | 1 | 0.13mi |
| 60 E Beech Dr Schaumburg, IL | 2.0 | 2.0 | 994 | $2,015 | $2.03 | 4d | 1 | 0.13mi |
| 112 Mullingar Ct Unit 3C Schaumburg, IL | 1.0 | 1.0 | 890 | $1,650 | $1.85 | 24d | 1 | 0.47mi |
| 93 Lambert Dr Unit C2 Schaumburg, IL | 2.0 | 1.0 | 1000 | $2,150 | $2.15 | 14d | 1 | 0.50mi |
| 951 Glouchester Cir Schaumburg, IL | 2.0 | 1.0 | 1000 | $2,250 | $2.25 | 26d | 1 | 0.93mi |
| 1020 Brunswick Hbr #5001 Schaumburg, IL | 2.0 | 1.0 | 950 | $2,400 | $2.53 | 26d | 1 | 1.00mi |
| 600 Eastview Ct Schaumburg, IL | 2.0 | 1.0 | 1068 | $2,150 | $2.01 | 26d | 1 | 1.00mi |
| 600 Eastview Ct Unit X1 Schaumburg, IL | 2.0 | 1.0 | 1068 | $2,150 | $2.01 | 9d | 1 | 1.00mi |
| 206 Nantucket Hbr #206 Schaumburg, IL | 2.0 | 1.0 | 1000 | $2,300 | $2.30 | 12d | 1 | 1.07mi |
| 242 Nantucket Hbr Schaumburg, IL | 2.0 | 1.5 | 1100 | $2,300 | $2.09 | 7d | 1 | 1.08mi |
| 1851 Fox Run Dr Unit B Elk Grove Village, IL | 2.0 | 2.0 | 1069 | $2,450 | $2.29 | 12d | 1 | 1.13mi |
| 305 Cambia Dr Schaumburg, IL | 1.0–3.0 | 1.0–1.5 | 850 | $1,529 | $1.80 | 1d | 20 | 1.16mi |
| 722 Whitesail Dr Unit 1 Schaumburg, IL | 2.0 | 1.5 | 850 | $1,990 | $2.34 | 26d | 1 | 1.24mi |
| 722 Whitesail Dr Schaumburg, IL | 2.0 | 1.5 | 850 | $1,990 | $2.34 | 24d | 1 | 1.24mi |
| 228 N Waterford Dr Unit 12C Schaumburg, IL | 2.0 | 1.5 | 1100 | $2,400 | $2.18 | 24d | 1 | 1.24mi |
| 880 Hadley Run Ln Schaumburg, IL | 1.0–2.0 | 1.0 | 825 | $1,895 | $2.30 | 0d | 8 | 1.31mi |
| 120 Inverness Ct Elk Grove Village, IL | 1.0 | 1.0 | 975 | $2,100 | $2.15 | 22d | 1 | 1.39mi |
HOA detail condo
- Monthly dues
- $289 · $3,468/yr
- Likely covers
- pool
- Assessments
- None detected in remarks — confirm with the listing agent.
Listing history 41 events
-
2026-06-21days on market $174,900 Active 9 DOM
-
2026-06-18days on market $174,900 Active 6 DOM
-
2026-06-17days on market $174,900 Active 5 DOM
-
2026-06-16days on market $174,900 Active 4 DOM
-
2026-06-15days on market $174,900 Active 3 DOM
-
2026-06-13pricedays on market $174,900 Active 1 DOM
-
2026-06-09days on market $179,000 Active 28 DOM
-
2026-06-08days on market $179,000 Active 27 DOM
-
2026-06-07days on market $179,000 Active 26 DOM
-
2026-06-03days on market $179,000 Active 22 DOM
-
2026-06-02days on market $179,000 Active 21 DOM
-
2026-06-01days on market $179,000 Active 20 DOM
-
2026-05-31days on market $179,000 Active 19 DOM
-
2026-05-12$179,000 Active
-
2025-11-12historical
-
2025-10-10Active
-
2025-10-10historical
-
2025-07-16Active
-
2020-02-18soldstatus $96,000
-
2020-02-07soldstatus $96,000 Closed Sale
-
2020-01-10historical Contingent
-
2019-11-07status Reactivated
-
2019-10-30historical Contingent
-
2019-09-18price $106,900
-
2019-08-18$109,900 New
-
2017-11-08soldstatus $90,000
-
2017-10-31soldstatus $87,000 Closed Sale
-
2017-09-08historical Contingent
-
2017-09-02$89,900 New
-
2011-01-19historical
-
2010-08-26New
-
2008-08-11historical
-
2008-02-15historical
-
2008-02-15
-
2007-07-14
-
2007-05-09soldstatus $107,000
-
2007-04-27soldstatus $107,000
-
2007-03-26historical
-
2006-10-19$121,900
-
1996-08-12soldstatus $49,500
-
1993-03-26soldstatus $38,000
ⓘ Source: listings_history table (triggers on properties + properties_extension) + one-shot
backfill from property_details.listing_events for pre-trigger history.
Tax reassessment forecast IL · Partial reset (capped growth)
- Current annual tax
- $2,914 · $243/mo
- Projected year-2 tax
- $3,442 · $287/mo
- Expected delta
- +$528/yr (+$44/mo · 18.1%)
ⓘ Screening estimate from a state-policy table — verify with the county assessor before closing.
Climate risk First Street
- Flood 4/10 Moderate FEMA zone X (unshaded) · 20% chance over 30 yrs
- Wildfire 1/10 Low
- Heat 3/10 Moderate 7 d/yr ≥101°F today · 14 d/yr by 30 yrs out
- Wind 2/10 Low 0% chance of damaging wind over 30 yrs
- Air quality 3/10 Moderate 3 unhealthy d/yr today · 3 by 30 yrs out
Nearby sold comps map
Loading sold comps map…
Walkable amenities ~0.75 mi
Loading nearby amenities…
Taxation est. · year 1
- Rental income
- $23,095
- − Mortgage interest
- −$9,797
- − Property taxes
- −$2,914
- − Insurance
- −$874
- − Repairs & maintenance
- −$1,848
- − Management
- −$1,848
- − HOA
- −$3,468
- − Depreciation
- −$5,088
- Taxable loss
- −$2,741
- Est. tax savings @ 24.0%
- +$658
- After-tax cash flow
- $641/yr
For passive investors: Depreciation is non-cash, so a rental often shows a tax loss while cash-flowing — sheltering income. Rental losses are passive: they offset passive income freely, and up to $25,000/yr can offset ordinary (W-2) income if you actively participate and your MAGI is under $100k (phasing out to $0 by $150k); unused losses carry forward. On sale, claimed depreciation is recaptured at up to 25%, and gains may owe capital-gains tax (a 1031 exchange can defer both). Figures are a year-1 estimate at your 24.0% rate — not tax advice; consult a CPA.
Schools (NCES district)
- District
- Township Hsd 211
- NCES district ID
- 1730450
- Math proficiency
- 45% ▼ -8.00%
- Reading proficiency
- 43% ▼ -4.00%
- Median HH income
- $72,942
- Composite
- 40.02/100
- National rank
- #3824
- State rank
- #89 of 620 in IL
Livability — Schaumburg
- Score
- 79/100
- State rank
- #124
- US rank
- #2162
Category grades
Schools grade is shown separately in the Schools card above.
Census & demographics
- Census place
- Schaumburg, IL
- County
- Cook County · 4,486,803 people
- City population
- 77,949
- Metro
- Chicago-Naperville-Elgin, IL-IN-WI
- Population (ZIP)
- 40,146
- Household income
- $95,972
- Rent vs Own
- Severe rent burden
- 545.0
Population outlook (Cook County) Hauer SSP2
- Today (2025)
- 5,347,519 people
- By 2030
- 5,357,703 · +0.2%
- By 2040
- 5,324,924 · -0.4%
- By 2050
- 5,230,762 · -2.2%
- By 2075
- 4,785,735 · -10.5%
- By 2100
- 4,188,836 · -21.7%
Race, ethnicity, and origin ACS 2023
- Neighborhood character
- Predominantly White (67%)
- Race & ethnicity
- White 67% Asian 14% Hispanic / Latino 12% Two or more races 10% Black 3%
- Hispanic origin (detail)
- Mexican 7%
- Common ancestry
- Romanian 15% Subsaharan African 3% French 1%
- Foreign-born
- 25% · Canada, South Korea, China
- Languages at home
- 66% English-only · Russian/Polish/Slavic 11% Other Indo-European 7% Spanish 7%
Political lean MEDSL · Cook
- 2024 margin
- Solid D (+42.0) · D 70.4% · R 28.4% · Other 1.2%
- 2008→2024 swing
- -11.4pp toward R · 2008: 53.4pp · 2024: 42.0pp
- All cycles
- 2024: D+42.0 2020: D+50.3 2016: D+53.0 2012: D+49.4 2008: D+53.4
Not yet ingested
- Civics
- —
Market trends
- HPI YoY
- ▼ -294.70%
- Current HPI
- 204.9823
- Rent YoY
- ▲ 3.32%
- Metro
- Chicago-Naperville-Elgin, IL-IN-WI
- State GDP YoY
- ▲ 1.59%
- F500 in state
- 60
Industry mix (Fortune 500 HQ in IL)
| Industry | F500 HQs | Revenue |
|---|---|---|
| Insurance | 4 | $201B |
|
||
| Consumer Goods | 4 | $87B |
|
||
| Industrial Machinery | 3 | $64B |
|
||
| Healthcare | 2 | $55B |
|
||
| Retail / Pharmacy | 1 | $148B |
|
||
| Agriculture / Food | 1 | $86B |
|
||
Price history
+371.1% since first listed28 events — show timeline
- 2026-05-12 Listed $179,000 MRED as Distributed by MLS Grid
- 2025-11-12 Listing Removed — MRED as Distributed by MLS Grid
- 2025-10-10 Listing Removed — MRED as Distributed by MLS Grid
- 2025-10-10 Listed — MRED as Distributed by MLS Grid
- 2025-07-16 Listed — MRED as Distributed by MLS Grid
- 2020-02-18 Sold (Public Records) $96,000 Public Records
- 2020-02-07 Sold (MLS) $96,000 MRED as Distributed by MLS Grid
- 2020-01-10 Contingent — MRED as Distributed by MLS Grid
- 2019-11-07 Relisted — MRED as Distributed by MLS Grid
- 2019-10-30 Contingent — MRED as Distributed by MLS Grid
- 2019-09-18 Price Changed $106,900 MRED as Distributed by MLS Grid
- 2019-08-18 Listed $109,900 MRED as Distributed by MLS Grid
- 2017-11-08 Sold (Public Records) $90,000 Public Records
- 2017-10-31 Sold (MLS) $87,000 MRED as Distributed by MLS Grid
- 2017-09-08 Contingent — MRED as Distributed by MLS Grid
- 2017-09-02 Listed $89,900 MRED as Distributed by MLS Grid
- 2011-01-19 Listing Removed — MRED as Distributed by MLS Grid
- 2010-08-26 Listed — MRED as Distributed by MLS Grid
- 2008-08-11 Listing Removed — MRED as Distributed by MLS Grid
- 2008-02-15 Listing Removed — MRED as Distributed by MLS Grid
- 2008-02-15 Listed — MRED as Distributed by MLS Grid
- 2007-07-14 Listed — MRED as Distributed by MLS Grid
- 2007-05-09 Sold (Public Records) $107,000 Public Records
- 2007-04-27 Sold (MLS) $107,000 MRED as Distributed by MLS Grid
- 2007-03-26 Listing Removed — MRED as Distributed by MLS Grid
- 2006-10-19 Listed $121,900 MRED as Distributed by MLS Grid
- 1996-08-12 Sold (Public Records) $49,500 Public Records
- 1993-03-26 Sold (Public Records) $38,000 Public Records
Property tax history
+2.4%/yrLatest (2023): $2,914 · +3.1% YoY. Source: county tax records.
Cash-flow waterfall
monthlySold comps — $/sqft
last 12 mo · ≤1 miLoading sold comps…