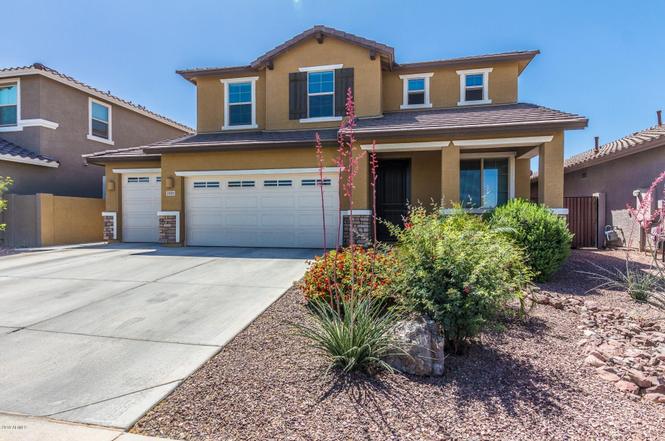
3501 E Apricot Ln · Gilbert, AZ
Flood risk 1/10 · Minimal
- FEMA flood zone
- X (shaded)
- Chance of flooding over 30 yrs
- 0.0%
- Est. flood insurance / yr
- $507 – $1,088
Fire risk 5/10 · Moderate
- Est. fire insurance / yr
- $610 – $1,132
Heat risk 9/10 · Severe
- Hot days now (above 111°F)
- 7 days/yr
- Hot days in 30 yrs
- 19 days/yr
Wind risk 1/10 · Minimal
- Chance of severe wind over 30 yrs
- —
Air-quality risk 2/10 · Minimal
- Unhealthy air days now
- 1 days/yr
- Unhealthy air days in 30 yrs
- 1 days/yr
Risk factors via First Street. Map © Google.
Why this score? — see what drove the D- grade
The composite is a weighted blend of 9 inputs, each scored 0–100. Each bar is that input's sub-score; the figure is the points it added to the 100-point composite (weight × sub-score).
- Appreciation +9.2/10.0
- ARV discount +7.2/15.0
- Cash flow +5.8/30.0
- Schools +5.2/10.0
- Livability +4.4/5.0
- Rent growth +3.6/5.0
- Condition / age +2.5/5.0
- 1% rule +0.2/10.0
- DSCR +0.2/10.0
$799,000
🖨 Deal sheet 📄 Offer letter ✓ Due diligence
Listing remarks
Two homes under 1 roof! There are 4 bedrooms, loft plus a Guest quarters with separate entrance but with access to main home. Enter in the front door into the formal living and dining area. Then on to the kitchen that is open to the family room with access to backyard. Kitchen boasts granite counters, stainless appliances, tile backsplash and island. Upstairs you will find large loft , 3 bedrooms and the Primary suite. Sparkling pool and covered patio in backyard. Guest quarters with private entrance, kitchenette, living room, bed room, full bath and a place to add a space for stackable washer and dryer in closet. North/South exposure & greenbelt out the front door. Higley School Dist
Key facts
- 6,050 sq ft lot
- 3 garage spots
- Pool
Property features AI
Finance
- HOA & community: Homeowners association with quarterly fee of $405; HOA covers grounds maintenance and street maintenance
Exterior
- Parking: Three covered parking spaces; Three open parking spaces; Three-car garage with direct access and garage door opener
- Utilities: City water; Public sewer
- Home design: Single-family residence; Fee simple ownership
- Construction: Stucco, wood frame, and stone exterior; Tile roof
- Exterior features: Private pool with play pool area; Block fencing; Sprinklers front and rear with automatic timers; Gravel/stone front and back landscaping; Asphalt road access; Lake, playground, and biking/walking path in the community
Interior
- Kitchen: Built-in microwave; Refrigerator; Dishwasher; Garbage disposal; Kitchen island; Pantry; Eat-in kitchen and breakfast bar
- Bedrooms: Master bedrooms present; Up to 6 possible bedrooms; Upstairs bedrooms
- Flooring: Carpet; Tile
- Bathrooms: Three full bathrooms; One half bathroom; Total of four bathrooms
- Heating & cooling: Natural gas heating; Central air; Ceiling fans
- Interior features: High-speed internet; Smart home features; Granite counters; Double vanity; Eat-in kitchen; Breakfast bar; 9+ foot flat ceilings; Kitchen island; Pantry; Two master bathrooms; Master bedroom with 3/4 bath; Dual-pane windows; Multi-zone cooling/heating
- Laundry & utility: Inside laundry; Upstairs laundry
Neighborhood map
What this means for you Summary
Snapshot
- This is a 5-bed/5.0-bath single-family listed at $799k.
Deal economics
- At list price, monthly cash flow is $-2k ($-19k/yr) — negative.
- To cash-flow at today's rent, offer at most $516k (35.4% below list).
- To meet the 1% rule (rent ≥ 1% of price), the offer needs to be $416k (48.0% below list).
- Recommended offer: $416k (48.0% below list) — sets the bar for 1% rule.
- Cap rate 3.9% vs local median 3.2% in Gilbert — meaningfully above typical; check what's discounted (condition, days-on-market, listing class) to confirm the premium yield is real.
Location & tenants
- Location reads 87/100 on livability (#1 in AZ, #240 nationally) — a professional / high-income tenant draw. Strengths: amenities A+, employment A+, housing A+; Watch: health & safety C-, cost of living F.
- Higley Unified School District (4248) (suburban): math 56% / reading 58% proficiency, ranked #21 of 249 in AZ (top 8%) — acceptable for families but not a draw, mixed tenant base, ~2y average lease; only 15% free/reduced lunch — higher-income household profile.
- Zoned schools: Bridges Elementary School (math 80% / reading 79%, grade A, #13 of 1,109 statewide, top 1%, 759 students, 7% FRL); Sossaman Middle School (math 59% / reading 60%, grade B, #4 of 218 statewide, top 1%, 1,043 students, 13% FRL); Higley High School (math 49% / reading 47%, grade D, #46 of 381 statewide, top 12%, 2,137 students, 12% FRL) — zoned schools at 11% FRL track the district average.
- Market conditions: Rents rising fast (+4.3%/yr); 329 active listings in the ZIP; 10 comparable units currently listed for rent nearby; rentals at typical pace (median 15d on market — plan ~3-4 weeks tenant-placement turnaround); high-income renter base; 36,011 units permitted in Maricopa County in 2024 (12,801 in 5+ unit buildings).
- This rent runs 32% of the median local income ($156k/yr) — at the standard rent-burdened threshold; future hikes will face affordability resistance.
Forward outlook
- In year one you build about $72k of equity ($6k loan paydown + $67k appreciation (8.4% local appreciation)).
- Maricopa County population projected at +38% by 2050 — long-run rental-demand tailwind backs the buy-and-hold thesis.
- By year 2, paydown + projected appreciation supports a ~$116k cash-out refi (75% LTV) — recoverable capital for the next deal without selling this one.
Negotiation context
- It's been on market 127 days — a 12% lower offer ($703k) is reasonable based on typical stale-listing flexibility.
- 5 sale attempts since 12y ago with the ask held roughly flat each time — persistent listings suggest the price (not the market) is what's stuck; bring a comps-based counter.
- Current owner paid $460k; list at $799k implies a 74% gain — meaningful room to come down on a strong offer.
Risks & watch-outs
- Climate carrying-cost: moderate wildfire risk; extreme-heat days projected 7→19/yr by 2055 (HVAC capex compounding) — expect insurance premiums to compound above CPI over the hold.
Questions for the listing agent
- What do current leases actually rent for vs. the listed asking? Can we see a recent rent roll and the last 12 months of T-12 income?
- It's been on market 127 days. Have you received any prior offers? Is the seller open to a 48% concession, seller financing, or rate buy-down credit?
- What does the HOA fee cover, when was the last increase, and are there any pending special assessments or reserve-fund shortfalls?
- Why hasn't it sold? Are there any deal-killer items the seller is aware of (foundation, flood, title, zoning, code violations)?
- Is there a deadline driving the sale (1031 exchange, divorce, estate, relocation)? That informs how much negotiation room exists.
- Schools are A-rated — typically a magnet for longer-tenancy family renters. What's the average tenant stay here, and is there a school-zone premium baked into asking?
- The area grade is low — what's the realistic commute time and amenity access for the typical tenant pool here? Any planned neighborhood developments (good or bad) we should know about?
- What's the average days-on-market for RENTAL listings here right now (not sales)? A rising rental-DOM trend means longer vacancies and softer asking-rent achievability than the comps imply.
- What's the recent tenant-quality profile in this submarket — average credit score on applications, eviction rate, late-payment / NSF rate, and stable-employment percentage? A property-management company in the area should have these aggregated.
- How much new for-sale + rental construction is in the pipeline within 1–3 miles? Heavy new supply typically softens prices + rents 12–24 months out; constrained supply supports both.
Investment metrics
- 1% rule
- 0.52% ✗
- Cap rate
- 3.89%
- Cash-on-cash
- -8.58%
- DSCR
- 0.62
- GRM
- 16.0
CMA / ARV
- ARV (on-the-fly)
- $794,096
- Comps found
- 12
Show comp detail 12 sales within ~0.75 mi
| Address | Dist | Beds/Ba | Sqft | Sold | Price | $/sf | Match |
|---|---|---|---|---|---|---|---|
| 5012 S Girard St | 0.25mi | 5/4.0 | 3,456 (+8%) | 1mo | $739,500 | $214 | 70 |
| 4868 S Hemet St | 0.17mi | 4/3.0 (-1) | 3,465 (+8%) | 3mo | $1,250,000 | $361 | 63 |
| 5124 S Ponderosa Dr | 0.36mi | 5/3.5 | 3,501 (+9%) | 1mo | $970,000 | $277 | 61 |
| 3296 E Thornton Ave | 0.30mi | 5/3.0 | 2,918 (-9%) | 3mo | $725,000 | $248 | 61 |
| 3558 E Latham Way | 0.46mi | 5/3.0 | 3,039 (-5%) | 3mo | $699,000 | $230 | 60 |
| 3249 E Nightingale Ln | 0.41mi | 4/3.5 (-1) | 3,392 (+6%) | 2mo | $1,000,000 | $295 | 58 |
| 3455 E Rosa Ln | 0.66mi | 5/3.0 | 3,193 (-0%) | 6mo | $700,000 | $219 | 56 |
| 3834 E Diamond Rd | 0.53mi | 4/3.5 (-1) | 3,328 (+4%) | 2mo | $720,000 | $216 | 56 |
| 3767 E Mia Ln | 0.46mi | 4/3.5 (-1) | 3,499 (+9%) | 0mo | $1,145,000 | $327 | 52 |
| 3291 E Devonshire Ave | 0.47mi | 5/2.5 | 2,971 (-7%) | 5mo | $684,000 | $230 | 52 |
| 3807 E Latham Ct | 0.57mi | 4/2.5 (-1) | 3,221 (+1%) | 7mo | $665,000 | $206 | 52 |
| 3904 E Carob Dr | 0.75mi | 4/3.0 (-1) | 2,912 (-9%) | 1mo | $1,200,000 | $412 | 36 |
Match score weights: distance 35% · size 25% · config 20% · recency 20%. Top-matched comps best support the ARV.
Projected returns pro-forma
8.36% appreciation · 4.31% rent growth · sell at horizon
- IRR
- 14.7%
- Equity multiple
- 2.12×
- Total profit
- $251,144
- Equity at exit
- $626,855
- IRR
- 14.7%
- Equity multiple
- 4.65×
- Total profit
- $816,945
- Equity at exit
- $1,263,709
Cash invested: $223,720 (down + closing). Projections, not guarantees.
Landlord ↔ Tenant lean methodology
- Overall (STATE)
- 87 Strongly Landlord-Friendly
- State Arizona
- 87 Strongly Landlord-Friendly · R+3
- County
- — inherits STATE
- City
- — inherits STATE
ZIP-level market 85298
- Home prices YoY
- 2.5%
- Rents YoY
- 4.3%
- Active inventory
- 329
- Price-to-rent
- 16.0×
Monthly cashflow live
- Estimated rent
- $4,158 high interval (Pro) →
- Mortgage (P&I)
- −$4,190
- Tax from tax record
- −$226 /mo · $2,712/yr
- Insurance
- −$333
- HOA
- −$135
- Vacancy / Maint / Mgmt
- −$873
- Net cashflow
- $-1,599
Break-even live
UW: 25.0% down · 7.5% · 30yr · 1.5% tax · 5.0% vac · 8.0% maint · 8.0% mgmt
Financing live
Cash to close
- Down payment
- $199,750
- Closing costs
- $23,970
- Reserves months
- —
- Total cash needed
- —
Loan-product check · same deal, 3 products live
Conventional
25% down · 7.5% · 30yr
- Down + closing
- —
- Monthly P&I
- —
- Monthly cashflow
- —
- DSCR
- —
- Eligible?
- —
Personal DTI + credit; lowest rate.
DSCR
20% down · 8.5% · 30yr
- Down + closing
- —
- Monthly P&I
- —
- Monthly cashflow
- —
- DSCR
- —
- Eligible?
- —
No personal income docs; deal must DSCR.
Hard money
10% down · 12.0% · 12mo
- Down + closing
- —
- Monthly P&I
- —
- Monthly cashflow
- —
- DSCR
- —
- Eligible?
- —
Short-term bridge; refi at stabilization.
Rent comps 10 comps
| Address | Beds | Baths | Sqft | Rent | $/sqft | DOM | Units | Dist |
|---|---|---|---|---|---|---|---|---|
| 3355 E Indigo St Gilbert, AZ | 6.0 | 5.0 | 4036 | $6,900 | $1.71 | 3d | 1 | 0.47mi |
| 4091 E Carriage Way Gilbert, AZ | 5.0 | 3.0 | 2667 | $3,420 | $1.28 | 1d | 1 | 0.77mi |
| 5434 S Forest Ave Gilbert, AZ | 4.0 | 2.0 | 2341 | $2,900 | $1.24 | 18d | 1 | 0.83mi |
| 4231 E Marshall Ave Gilbert, AZ | 4.0 | 2.0 | 2209 | $2,700 | $1.22 | 3d | 1 | 0.99mi |
| 3582 E Santa Fe Ln Gilbert, AZ | 5.0 | 2.5 | 3094 | $4,500 | $1.45 | 24d | 1 | 1.19mi |
| 3484 E Coconino Way Gilbert, AZ | 5.0 | 3.0 | 2928 | $3,400 | $1.16 | 15d | 1 | 1.28mi |
| 2954 E Coconino Dr Gilbert, AZ | 4.0 | 2.0 | 2180 | $2,590 | $1.19 | 3d | 1 | 1.38mi |
| 5475 S Cardinal St Gilbert, AZ | 4.0 | 2.5 | 2708 | $4,000 | $1.48 | 1d | 1 | 1.41mi |
| 4157 E Santa Fe Ln Gilbert, AZ | 4.0 | 2.5 | 2163 | $2,550 | $1.18 | 20d | 1 | 1.42mi |
| 4631 E Buckboard Ct Gilbert, AZ | 4.0 | 2.0 | 2400 | $2,999 | $1.25 | 22d | 1 | 1.48mi |
HOA detail
- Monthly dues
- $135 · $1,620/yr
- Likely covers
- pool
Listing history 34 events
-
2026-06-13days on market $799,000 Active 127 DOM
-
2026-06-09days on market $799,000 Active 123 DOM
-
2026-06-08days on market $799,000 Active 122 DOM
-
2026-06-07days on market $799,000 Active 121 DOM
-
2026-06-04days on market $799,000 Active 118 DOM
-
2026-06-03days on market $799,000 Active 117 DOM
-
2026-06-02days on market $799,000 Active 116 DOM
-
2026-06-01days on market $799,000 Active 115 DOM
-
2026-05-31days on market $799,000 Active 114 DOM
-
2026-03-31price $799,000
-
2026-02-06$815,000 Active
-
2025-12-08historical
-
2025-10-09$800,000 Active
-
2025-07-03historical
-
2025-05-23price $849,999
-
2025-04-09price $875,000
-
2025-03-16price $900,000
-
2025-02-01$950,000 Active
-
2018-07-12soldstatus $459,900 Closed
-
2018-07-12soldstatus $459,900
-
2018-05-20status Pending
-
2018-05-10price $459,900
-
2018-04-25$464,900 Active
-
2015-05-28historical
-
2015-05-27soldstatus $360,000 Closed
-
2015-05-18status Pending
-
2015-03-18price $369,990
-
2015-03-18price $370,990
-
2014-12-24price $375,990
-
2014-12-24price $374,990
-
2014-09-26price $374,990
-
2014-09-26price $375,990
-
2014-08-15$379,990 Active
-
2013-03-22soldstatus $6,413,000
ⓘ Source: listings_history table (triggers on properties + properties_extension) + one-shot
backfill from property_details.listing_events for pre-trigger history.
Tax reassessment forecast AZ · Resets to sale price
- Current annual tax
- $2,712 · $226/mo
- Projected year-2 tax
- $5,273 · $439/mo
- Expected delta
- +$2,561/yr (+$213/mo · 94.4%)
ⓘ Screening estimate from a state-policy table — verify with the county assessor before closing.
Climate risk First Street
- Flood 1/10 Low FEMA zone X (shaded) · 0% chance over 30 yrs
- Wildfire 5/10 Major
- Heat 9/10 Extreme 7 d/yr ≥111°F today · 19 d/yr by 30 yrs out
- Wind 1/10 Low
- Air quality 2/10 Low 1 unhealthy d/yr today · 1 by 30 yrs out
Nearby sold comps map
Loading sold comps map…
Walkable amenities ~0.75 mi
Loading nearby amenities…
Taxation est. · year 1
- Rental income
- $49,893
- − Mortgage interest
- −$44,756
- − Property taxes
- −$2,712
- − Insurance
- −$3,995
- − Repairs & maintenance
- −$3,991
- − Management
- −$3,991
- − HOA
- −$1,620
- − Depreciation
- −$23,244
- Taxable loss
- −$34,417
- Est. tax savings @ 24.0%
- +$8,260
- After-tax cash flow
- $-10,932/yr
For passive investors: Depreciation is non-cash, so a rental often shows a tax loss while cash-flowing — sheltering income. Rental losses are passive: they offset passive income freely, and up to $25,000/yr can offset ordinary (W-2) income if you actively participate and your MAGI is under $100k (phasing out to $0 by $150k); unused losses carry forward. On sale, claimed depreciation is recaptured at up to 25%, and gains may owe capital-gains tax (a 1031 exchange can defer both). Figures are a year-1 estimate at your 24.0% rate — not tax advice; consult a CPA.
Schools (NCES district)
- District
- Higley Unified School District (4248)
- NCES district ID
- 0403780
- Math proficiency
- 56% ▼ -10.00%
- Reading proficiency
- 58% ▼ -8.00%
- Median HH income
- $82,526
- Composite
- 51.7/100
- National rank
- #1688
- State rank
- #21 of 249 in AZ
Livability — Gilbert
- Score
- 87/100
- State rank
- #1
- US rank
- #240
Category grades
Schools grade is shown separately in the Schools card above.
Census & demographics
- Census place
- Gilbert, AZ
- County
- Maricopa County · 4,537,380 people
- City population
- 281,769
- Metro
- Phoenix-Mesa-Chandler, AZ
- Population (ZIP)
- 44,114
- Household income
- $156,425
- Rent vs Own
- Severe rent burden
- 173.0
Population outlook (Maricopa County) Hauer SSP2
- Today (2025)
- 4,979,203 people
- By 2030
- 5,378,229 · +8.0%
- By 2040
- 6,156,598 · +23.6%
- By 2050
- 6,872,376 · +38.0%
- By 2075
- 8,401,270 · +68.7%
- By 2100
- 9,247,439 · +85.7%
Race, ethnicity, and origin ACS 2023
- Neighborhood character
- Predominantly White (72%)
- Race & ethnicity
- White 72% Hispanic / Latino 14% Two or more races 11% Asian 7% Black 2%
- Hispanic origin (detail)
- Mexican 10%
- Common ancestry
- Italian 4% Romanian 3% Lithuanian 3%
- Foreign-born
- 9% · Canada, China, Vietnam
- Languages at home
- 85% English-only · Spanish 7% Other Indo-European 2% Chinese 1%
Political lean MEDSL · Maricopa
- 2024 margin
- Toss-up / Even · D 47.7% · R 51.2% · Other 1.1%
- 2008→2024 swing
- +7.1pp toward D · 2008: -10.6pp · 2024: -3.5pp
- All cycles
- 2024: R+3.5 2020: D+2.2 2016: R+3.5 2012: R+12.0 2008: R+10.6
Not yet ingested
- Civics
- —
Market trends
- HPI YoY
- ▲ 8.36%
- Current HPI
- 343.6932
- Rent YoY
- ▲ 4.31%
- Metro
- Phoenix-Mesa-Chandler, AZ
- State GDP YoY
- ▲ 4.54%
- F500 in state
- 20
Industry mix (Fortune 500 HQ in AZ)
| Industry | F500 HQs | Revenue |
|---|---|---|
| Technology | 2 | $13B |
|
||
| Mining / Metals | 1 | $23B |
|
||
| Environmental Services | 1 | $16B |
|
||
| Metals / Steel | 1 | $14B |
|
||
| Technology Distribution | 1 | $9B |
|
||
| Homebuilding | 1 | $8B |
|
||
Price history
-87.5% since first listed25 events — show timeline
- 2026-03-31 Price Changed $799,000 ARMLS
- 2026-02-06 Listed $815,000 ARMLS
- 2025-12-08 Listing Removed — ARMLS
- 2025-10-09 Listed $800,000 ARMLS
- 2025-07-03 Listing Removed — ARMLS
- 2025-05-23 Price Changed $849,999 ARMLS
- 2025-04-09 Price Changed $875,000 ARMLS
- 2025-03-16 Price Changed $900,000 ARMLS
- 2025-02-01 Listed $950,000 ARMLS
- 2018-07-12 Sold (Public Records) $459,900 Public Records
- 2018-07-12 Sold (MLS) $459,900 ARMLS
- 2018-05-20 Pending — ARMLS
- 2018-05-10 Price Changed $459,900 ARMLS
- 2018-04-25 Listed $464,900 ARMLS
- 2015-05-28 Listing Removed — ARMLS
- 2015-05-27 Sold (MLS) $360,000 ARMLS
- 2015-05-18 Pending — ARMLS
- 2015-03-18 Price Changed $370,990 ARMLS
- 2015-03-18 Price Changed $369,990 ARMLS
- 2014-12-24 Price Changed $374,990 ARMLS
- 2014-12-24 Price Changed $375,990 ARMLS
- 2014-09-26 Price Changed $375,990 ARMLS
- 2014-09-26 Price Changed $374,990 ARMLS
- 2014-08-15 Listed $379,990 ARMLS
- 2013-03-22 Sold (Public Records) $6,413,000 Public Records
Property tax history
+10.9%/yrLatest (2025): $2,712 · -6.3% YoY. Source: county tax records.
Cash-flow waterfall
monthlySold comps — $/sqft
last 12 mo · ≤1 miLoading sold comps…