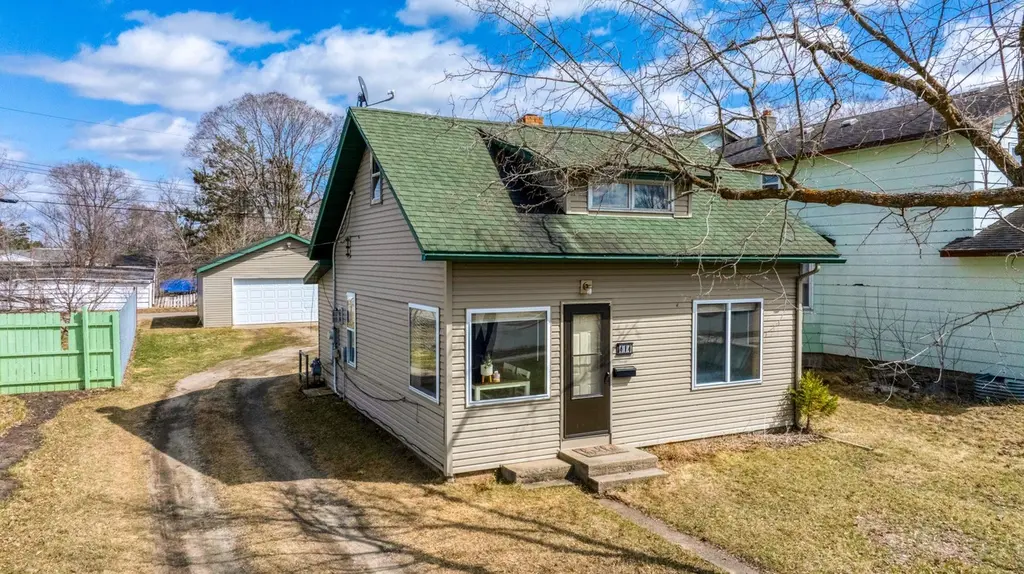
414 Scott Ave SE · Bemidji, MN
Flood risk 1/10 · Minimal
- FEMA flood zone
- —
- Chance of flooding over 30 yrs
- 0.0%
- Est. flood insurance / yr
- —
Fire risk 6/10 · Moderate
- Est. fire insurance / yr
- $888 – $1,650
Heat risk 1/10 · Minimal
- Hot days now (above 93°F)
- 7 days/yr
- Hot days in 30 yrs
- 12 days/yr
Wind risk 1/10 · Minimal
- Chance of severe wind over 30 yrs
- —
Air-quality risk 3/10 · Minor
- Unhealthy air days now
- 3 days/yr
- Unhealthy air days in 30 yrs
- 3 days/yr
Risk factors via First Street. Map © Google.
Why this score? — see what drove the D grade
The composite is a weighted blend of 9 inputs, each scored 0–100. Each bar is that input's sub-score; the figure is the points it added to the 100-point composite (weight × sub-score).
- Cash flow +12.9/30.0
- ARV discount +7.5/15.0
- DSCR +3.9/10.0
- Schools +3.9/10.0
- Livability +3.7/5.0
- Rent growth +3.5/5.0
- 1% rule +2.8/10.0
- Condition / age +2.5/5.0
- Appreciation +0.0/10.0
$159,000
🖨 Deal sheet (PDF) 📄 Offer letter ✓ Due diligence
Listing remarks MLS
Check out this cute 2 bedroom, one bathroom house located on the southeast side of Bemidji for under $130,00! Features include seamless steel siding and a freestanding gas fireplace to keep you cozy warm in the winter. Conveniently located next to Bemidji's Sanford Center, restaurants, Lueken's south grocery store, and much more! Schedule your showing today!
Key facts
- Steel siding
- Gas fireplace
- Detached garage
Tags
Property features AI
Exterior
- Parking: Gravel parking; 2-car garage
- Utilities: City water connected; City sewer connected; Electric service with circuit breakers (Ottertail Power); Fuel: Electric and Natural Gas
- Home design: Residential property; One and one-half levels; Main entry on main level
- Construction: Stone foundation; Roof older than 8 years
- Exterior features: Light tree coverage; No fencing; City street with curbs and paved streets; storm sewer; public maintained road
Interior
- Kitchen: Kitchen window; Range; Dishwasher; Refrigerator
- Bedrooms: 2 bedrooms (including a main floor primary bedroom)
- Bathrooms: 1 full bathroom (main floor)
- Heating & cooling: Baseboard heating; Window air conditioning units
- Interior features: Free-standing gas fireplace; Breakfast area / Eat-in kitchen / Kitchen-dining combination; Main floor primary bedroom; Main floor bedroom; Main floor laundry
- Laundry & utility: Washer hookup; Dryer hookup (electric); Washer and dryer located in kitchen / main level
Neighborhood map
What this means for you Summary
Snapshot
- This is a 2-bed/1.0-bath single-family listed at $159k.
Deal economics
- At list price, monthly cash flow is $-12 ($-140/yr) — negative.
- To cash-flow at today's rent, offer at most $157k (1.3% below list).
- To meet the 1% rule (rent ≥ 1% of price), the offer needs to be $125k (21.5% below list).
- Recommended offer: $125k (21.5% below list) — sets the bar for 1% rule.
- Cap rate 6.2% vs local median 4.3% in Bemidji — top-decile yield for the area; either an underpriced asset or a hidden risk that comps aren't pricing in. Stress-test before assuming the spread holds.
Location & tenants
- Location reads 73/100 on livability (#252 in MN) — a middle-class / working-renter tenant base. Strengths: amenities A+, cost of living A+, health & safety A+; Watch: crime F, commute F, employment F.
- Bemidji Public School District (rural): math 42% / reading 50% proficiency, ranked #173 of 301 in MN (top 58%) — families likely to look elsewhere, expect single-tenant / working-renter base with shorter leases.
- Zoned schools: Lincoln Elementary (math 67% / reading 62%, grade B, #130 of 857 statewide, top 18%, 328 students, 50% FRL); Bemidji Middle (math 37% / reading 46%, grade F, #138 of 258 statewide, top 55%, 1,013 students, 48% FRL); Bemidji Senior High (math 47% / reading 67%, grade C, #64 of 471 statewide, top 16%, 1,432 students, 38% FRL) — zoned schools at 45% FRL track the district average.
- Market conditions: Rents rising fast (+4.0%/yr); 346 active listings in the ZIP; 165 units permitted in Beltrami County in 2024 (81 in 5+ unit buildings).
Forward outlook
- Local home prices are declining (-3.0%/yr); year-one equity from $1k of loan paydown is wiped out by about $5k of value loss. Plan a longer hold.
Negotiation context
- It's been on market 23 days — a 2% lower offer ($157k) is reasonable based on typical stale-listing flexibility.
- 4 sale attempts since 13y ago with the ask held roughly flat each time — persistent listings suggest the price (not the market) is what's stuck; bring a comps-based counter.
Risks & watch-outs
- Watch-outs: built in 1940 — expect roof / HVAC / electrical / plumbing capex.
- Climate carrying-cost: major wildfire risk — expect insurance premiums to compound above CPI over the hold.
Questions for the listing agent
- What do current leases actually rent for vs. the listed asking? Can we see a recent rent roll and the last 12 months of T-12 income?
- Built in 1940 — when were the roof, HVAC, electrical panel, plumbing, and water heater last replaced?
- Is there a deadline driving the sale (1031 exchange, divorce, estate, relocation)? That informs how much negotiation room exists.
- Schools are B-rated — typically a magnet for longer-tenancy family renters. What's the average tenant stay here, and is there a school-zone premium baked into asking?
- Crime grade is F in this area — have there been break-ins, vandalism, or insurance claims at this property in the last 3 years? What carrier currently insures it and at what premium?
- The area grade is low — what's the realistic commute time and amenity access for the typical tenant pool here? Any planned neighborhood developments (good or bad) we should know about?
- What's the average days-on-market for RENTAL listings here right now (not sales)? A rising rental-DOM trend means longer vacancies and softer asking-rent achievability than the comps imply.
- What's the recent tenant-quality profile in this submarket — average credit score on applications, eviction rate, late-payment / NSF rate, and stable-employment percentage? A property-management company in the area should have these aggregated.
- How much new for-sale + rental construction is in the pipeline within 1–3 miles? Heavy new supply typically softens prices + rents 12–24 months out; constrained supply supports both.
Investment metrics
- 1% rule
- 0.78% ✗
- Cap rate
- 6.20%
- Cash-on-cash
- -0.31%
- DSCR
- 0.99
- GRM
- 10.6
CMA / ARV
No comps found within radius.
Projected returns pro-forma
-3.0% appreciation · 4.02% rent growth · sell at horizon
- IRR
- -15.8%
- Equity multiple
- 0.43×
- Total profit
- $-25,258
- Equity at exit
- $23,707
- IRR
- -5.9%
- Equity multiple
- 0.60×
- Total profit
- $-17,709
- Equity at exit
- $13,747
Cash invested: $44,520 (down + closing). Projections, not guarantees.
Landlord ↔ Tenant lean methodology
- Overall (STATE)
- 46 Balanced
- State Minnesota
- 46 Balanced · D+2
- County
- — inherits STATE
- City
- — inherits STATE
ZIP-level market 56601
- Home prices YoY
- -26.4%
- Rents YoY
- 4.0%
- Active inventory
- 346
- Price-to-rent
- 10.6×
Monthly cashflow live
- Estimated rent
- $1,248 medium interval (Pro) →
- Mortgage (P&I)
- −$834
- Tax from tax record
- −$97 /mo · $1,168/yr
- Insurance
- −$66
- HOA
- −$0
- Vacancy / Maint / Mgmt
- −$262
- Net cashflow
- $-12
Break-even live
Sensitivity live
| Price | -10% $78 | -5% $33 | +0% $-12 | +5% $-57 | +10% $-102 |
|---|---|---|---|---|---|
| Rent | -10% $-110 | -5% $-61 | +0% $-12 | +5% $38 | +10% $87 |
| Rate | -1.0pp $68 | -0.5pp $29 | base $-12 | +0.5pp $-53 | +1.0pp $-95 |
UW: 25.0% down · 7.5% · 30yr · 1.5% tax · 5.0% vac · 8.0% maint · 8.0% mgmt
Financing live
Cash to close
- Down payment
- $39,750
- Closing costs
- $4,770
- Reserves months
- —
- Total cash needed
- —
Loan-product check · same deal, 3 products live
Conventional
25% down · 7.5% · 30yr
- Down + closing
- —
- Monthly P&I
- —
- Monthly cashflow
- —
- DSCR
- —
- Eligible?
- —
Personal DTI + credit; lowest rate.
DSCR
20% down · 8.5% · 30yr
- Down + closing
- —
- Monthly P&I
- —
- Monthly cashflow
- —
- DSCR
- —
- Eligible?
- —
No personal income docs; deal must DSCR.
Hard money
10% down · 12.0% · 12mo
- Down + closing
- —
- Monthly P&I
- —
- Monthly cashflow
- —
- DSCR
- —
- Eligible?
- —
Short-term bridge; refi at stabilization.
Listing history 10 events
-
2026-05-07historical Contingent - Inspection 204-char remark
-
2026-04-27$159,000 Active 204-char remark
-
2022-09-09soldstatus $130,000 Sold 360-char remark
Show marketing remark (360 chars)
Check out this cute 2 bedroom, one bathroom house located on the southeast side of Bemidji for under $130,00! Features include seamless steel siding and a freestanding gas fireplace to keep you cozy warm in the winter. Conveniently located next to Bemidji's Sanford Center, restaurants, Lueken's south grocery store, and much more! Schedule your showing today!
-
2022-09-09soldstatus $130,000
Show marketing remark (360 chars)
Check out this cute 2 bedroom, one bathroom house located on the southeast side of Bemidji for under $130,00! Features include seamless steel siding and a freestanding gas fireplace to keep you cozy warm in the winter. Conveniently located next to Bemidji's Sanford Center, restaurants, Lueken's south grocery store, and much more! Schedule your showing today!
-
2022-07-29status Pending 360-char remark
Show marketing remark (360 chars)
Check out this cute 2 bedroom, one bathroom house located on the southeast side of Bemidji for under $130,00! Features include seamless steel siding and a freestanding gas fireplace to keep you cozy warm in the winter. Conveniently located next to Bemidji's Sanford Center, restaurants, Lueken's south grocery store, and much more! Schedule your showing today!
-
2022-07-26$128,888 Active 360-char remark
Show marketing remark (360 chars)
Check out this cute 2 bedroom, one bathroom house located on the southeast side of Bemidji for under $130,00! Features include seamless steel siding and a freestanding gas fireplace to keep you cozy warm in the winter. Conveniently located next to Bemidji's Sanford Center, restaurants, Lueken's south grocery store, and much more! Schedule your showing today!
-
2013-12-10soldstatus $65,000
-
2013-12-04soldstatus $65,000
Show marketing remark (130 chars)
Just the right size - 2 bed home w/ 2 car garage. Seamless steel siding on house, nice size kitchen, electric & gas fireplace.
-
2013-03-12$72,000
Show marketing remark (130 chars)
Just the right size - 2 bed home w/ 2 car garage. Seamless steel siding on house, nice size kitchen, electric & gas fireplace.
-
2013-03-10$72,000
ⓘ Source: listings_history table (triggers on properties + properties_extension) + one-shot
backfill from property_details.listing_events for pre-trigger history.
Tax reassessment forecast MN · Partial reset (capped growth)
- Current annual tax
- $1,168 · $97/mo
- Projected year-2 tax
- $1,474 · $123/mo
- Expected delta
- +$306/yr (+$26/mo · 26.2%)
ⓘ Screening estimate from a state-policy table — verify with the county assessor before closing.
Climate risk First Street
- Flood 1/10 Low 0% chance over 30 yrs
- Wildfire 6/10 Major
- Heat 1/10 Low 7 d/yr ≥93°F today · 12 d/yr by 30 yrs out
- Wind 1/10 Low
- Air quality 3/10 Moderate 3 unhealthy d/yr today · 3 by 30 yrs out
Nearby sold comps map
Loading sold comps map…
Walkable amenities ~0.75 mi
Loading nearby amenities…
Taxation est. · year 1
- Rental income
- $14,973
- − Mortgage interest
- −$8,906
- − Property taxes
- −$1,168
- − Insurance
- −$795
- − Repairs & maintenance
- −$1,198
- − Management
- −$1,198
- − Depreciation
- −$4,625
- Taxable loss
- −$2,918
- Est. tax savings @ 24.0%
- +$700
- After-tax cash flow
- $560/yr
For passive investors: Depreciation is non-cash, so a rental often shows a tax loss while cash-flowing — sheltering income. Rental losses are passive: they offset passive income freely, and up to $25,000/yr can offset ordinary (W-2) income if you actively participate and your MAGI is under $100k (phasing out to $0 by $150k); unused losses carry forward. On sale, claimed depreciation is recaptured at up to 25%, and gains may owe capital-gains tax (a 1031 exchange can defer both). Figures are a year-1 estimate at your 24.0% rate — not tax advice; consult a CPA.
Schools (NCES district)
- District
- Bemidji Public School District
- NCES district ID
- 2704440
- Math proficiency
- 42% ▼ -9.00%
- Reading proficiency
- 50% ▼ -5.00%
- Median HH income
- $47,735
- Composite
- 39.22/100
- National rank
- #4013
- State rank
- #173 of 301 in MN
Livability — Bemidji
- Score
- 73/100
- State rank
- #252
- US rank
- #5416
Category grades
Schools grade is shown separately in the Schools card above.
Census & demographics
- Census place
- Bemidji, MN
- County
- Beltrami County · 34,784 people
- City population
- 34,784
- Metro
- Bemidji, MN
- Population (ZIP)
- 34,784
- Household income
- $72,262
- Rent vs Own
- Severe rent burden
- 940.0
Population outlook (Beltrami County) Hauer SSP2
- Today (2025)
- 46,437 people
- By 2030
- 46,736 · +0.6%
- By 2040
- 46,804 · +0.8%
- By 2050
- 46,299 · -0.3%
- By 2075
- 44,037 · -5.2%
- By 2100
- 38,567 · -16.9%
Race, ethnicity, and origin ACS 2023
- Neighborhood character
- Predominantly White (80%)
- Race & ethnicity
- White 80% Native American 8% Two or more races 7% Hispanic / Latino 3% Black 1%
- Common ancestry
- Portuguese 19% Lithuanian 3% Romanian 2%
- Foreign-born
- 2% · Canada
- Languages at home
- 97% English-only · Spanish 1%
Political lean MEDSL · Beltrami
- 2024 margin
- Lean R (+5.7) · D 46.3% · R 52.0% · Other 1.7%
- 2008→2024 swing
- -15.8pp toward R · 2008: 10.2pp · 2024: -5.7pp
- All cycles
- 2024: R+5.7 2020: R+3.1 2016: R+9.8 2012: D+9.9 2008: D+10.2
Not yet ingested
- Civics
- —
Market trends
- HPI YoY
- ▼ -93.95%
- Current HPI
- 261.5734
- Rent YoY
- ▲ 4.02%
- Metro
- Bemidji, MN
- State GDP YoY
- ▲ 2.41%
- F500 in state
- 34
Industry mix (Fortune 500 HQ in MN)
| Industry | F500 HQs | Revenue |
|---|---|---|
| Healthcare | 2 | $407B |
|
||
| Retail | 2 | $150B |
|
||
| Consumer Goods | 2 | $32B |
|
||
| Industrial Machinery | 2 | $6B |
|
||
| Agriculture | 1 | $40B |
|
||
| Healthcare / Medical Devices | 1 | $32B |
|
||
Price history
+120.8% since first listed12 events — show timeline
- 2026-06-17 Sold (MLS) $159,000 NORTHSTARMLS as Distributed by MLS Grid
- 2026-05-21 Pending — NORTHSTARMLS as Distributed by MLS Grid
- 2026-05-07 Contingent — NORTHSTARMLS as Distributed by MLS Grid
- 2026-04-27 Listed $159,000 NORTHSTARMLS as Distributed by MLS Grid
- 2022-09-09 Sold (Public Records) $130,000 Public Records
- 2022-09-09 Sold (MLS) $130,000 NORTHSTARMLS as Distributed by MLS Grid
- 2022-07-29 Pending — NORTHSTARMLS as Distributed by MLS Grid
- 2022-07-26 Listed $128,888 NORTHSTARMLS as Distributed by MLS Grid
- 2013-12-10 Sold (Public Records) $65,000 Public Records
- 2013-12-04 Sold (MLS) $65,000 NORTHSTARMLS as Distributed by MLS Grid
- 2013-03-12 Listed $72,000 NORTHSTARMLS as Distributed by MLS Grid
- 2013-03-10 Listed $72,000 NORTHSTARMLS as Distributed by MLS Grid
Property tax history
-0.3%/yrLatest (2025): $1,168 · -3.5% YoY. Source: county tax records.
Cash-flow waterfall
monthlySold comps — $/sqft
last 12 mo · ≤1 miLoading sold comps…