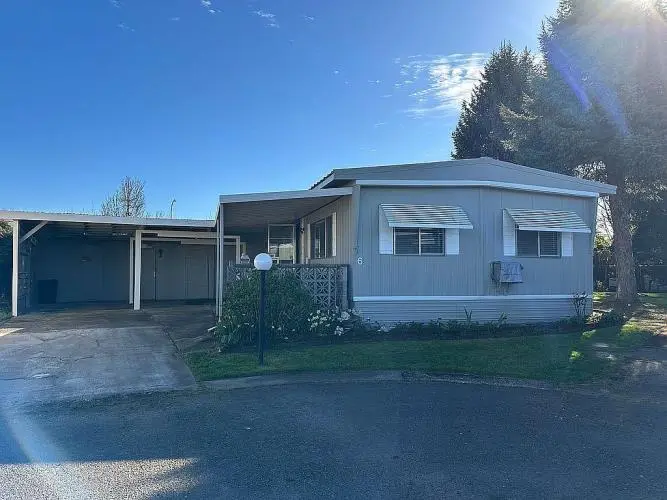
612 N Cascade Dr Unit 6 · Woodburn, OR
Flood risk 1/10 · Minimal
- FEMA flood zone
- X (unshaded)
- Chance of flooding over 30 yrs
- 0.0%
- Est. flood insurance / yr
- $507 – $1,088
Fire risk 3/10 · Minor
- Est. fire insurance / yr
- $498 – $926
Heat risk 3/10 · Minor
- Hot days now (above 92°F)
- 7 days/yr
- Hot days in 30 yrs
- 14 days/yr
Wind risk 1/10 · Minimal
- Chance of severe wind over 30 yrs
- —
Air-quality risk 10/10 · Severe
- Unhealthy air days now
- 14 days/yr
- Unhealthy air days in 30 yrs
- 14 days/yr
Risk factors via First Street. Map © Google.
Why this score? — see what drove the C- grade
The composite is a weighted blend of 9 inputs, each scored 0–100. Each bar is that input's sub-score; the figure is the points it added to the 100-point composite (weight × sub-score).
- Cash flow +20.0/30.0
- ARV discount +7.5/15.0
- DSCR +6.4/10.0
- 1% rule +5.3/10.0
- Livability +3.7/5.0
- Rent growth +3.2/5.0
- Schools +2.5/10.0
- Condition / age +2.5/5.0
- Appreciation +0.0/10.0
$154,999
🖨 Deal sheet (PDF) 📄 Offer letter ✓ Due diligence
Listing remarks MLS
Located in Driftwood mobile home park Woodburn, Oregon across the street from golf course. This is a quiet clean 55+ community with a lease land space. Park rent is $595 a month. Clubhouse access for parties and get-togethers. This is a corner lot and it is by far the largest in the park. Beautifully remodeled and has a newer metal roof and furnace. Upgraded electrical panel and copper wiring with all new plugs, switches/dimmers and covers. . All new appliances. Open floor plan. The entire home has been repainted entirely inside and out. Completely remodeled kitchen with Under mount sink, convertible range hood, real quartz countertops with island bar. All new laminate wood flooring, and baseboard/trim throughout. New plumbing on all the sinks and shower. Large master bedroom with private deck access. Completely remodeled bathroom with a big brand new $10,000 walk-in tile shower. Two car driveway with carport and tons of outside shed storage. paver walkways and bbq area. Huge backyard and side yard with lots of garden space. Large covered rear deck.
Key facts
- Copper wiring
- New appliances
- Newer metal roof
Tags
Neighborhood map
What this means for you Summary
Snapshot
- This is a 2-bed/1.0-bath manufactured listed at $155k.
Deal economics
- At list price, monthly cash flow is $191 ($2k/yr) — positive.
- The deal already cash-flows at list — no discount required.
- Meets the 1% rule at list price ($2k rent vs $155k).
- Recommended offer: $146k (6.0% below list) — sets the bar for market timing.
- Cap rate 7.8% vs local median 3.1% in Woodburn — top-decile yield for the area; either an underpriced asset or a hidden risk that comps aren't pricing in. Stress-test before assuming the spread holds.
Location & tenants
- Location reads 74/100 on livability (#91 in OR, #4,490 nationally) — a middle-class / working-renter tenant base. Strengths: housing A+, health & safety A+, cost of living B; Watch: crime D+, commute D, amenities F.
- Woodburn SD 103 (town): math 20% / reading 31% proficiency, ranked #169 of 183 in OR (top 92%) — low school quality limits family demand, transient renter base, plan for 1-2y turnover; 71% free/reduced lunch — lower-income household profile, screen leases tightly.
- Zoned schools: Nellie Muir Elementary School (435 students, 72% FRL); Valor Middle School (630 students, 72% FRL); Woodburn Success (79 students, 68% FRL) — zoned schools at 71% FRL track the district average.
- Market conditions: Rents rising (+2.9%/yr); 310 active listings in the ZIP; 17 comparable units currently listed for rent nearby; rentals at typical pace (median 16d on market — plan ~3-4 weeks tenant-placement turnaround); 1,591 units permitted in Marion County in 2024 (716 in 5+ unit buildings).
Forward outlook
- Local home prices are declining (-3.0%/yr); year-one equity from $1k of loan paydown is wiped out by about $5k of value loss. Plan a longer hold.
- Marion County population projected at +17% by 2050 — long-run rental-demand tailwind backs the buy-and-hold thesis.
Negotiation context
- It's been on market 68 days — a 6% lower offer ($146k) is reasonable based on typical stale-listing flexibility.
Questions for the listing agent
- It's been on market 68 days. Have you received any prior offers? Is the seller open to a 6% concession, seller financing, or rate buy-down credit?
- Built in 1967 — when were the roof, HVAC, electrical panel, plumbing, and water heater last replaced?
- Why hasn't it sold? Are there any deal-killer items the seller is aware of (foundation, flood, title, zoning, code violations)?
- Is there a deadline driving the sale (1031 exchange, divorce, estate, relocation)? That informs how much negotiation room exists.
- Schools are D-rated, which usually means shorter tenancies and higher turnover. Who's the typical renter profile here, and what's been the actual vacancy rate?
- Crime grade is D in this area — have there been break-ins, vandalism, or insurance claims at this property in the last 3 years? What carrier currently insures it and at what premium?
- What's the average days-on-market for RENTAL listings here right now (not sales)? A rising rental-DOM trend means longer vacancies and softer asking-rent achievability than the comps imply.
- What's the recent tenant-quality profile in this submarket — average credit score on applications, eviction rate, late-payment / NSF rate, and stable-employment percentage? A property-management company in the area should have these aggregated.
- How much new for-sale + rental construction is in the pipeline within 1–3 miles? Heavy new supply typically softens prices + rents 12–24 months out; constrained supply supports both.
Investment metrics
- 1% rule
- 1.03% ✓
- Cap rate
- 7.77%
- Cash-on-cash
- 5.29%
- DSCR
- 1.24
- GRM
- 8.1
CMA / ARV
- ARV (median comp)
- $49,312
- List price
- $154,999
- Delta
- 214.32%
- Verdict
- OVERPRICED
- Comps
- 3 within 1.0 mi
Show comp detail 2 sales within ~0.75 mi
| Address | Dist | Beds/Ba | Sqft | Sold | Price | $/sf | Match |
|---|---|---|---|---|---|---|---|
| 612 N Cascade Dr #19 | 0.00mi | 2/1.0 | 800 (-15%) | 1mo | $40,000 | $50 | 74 |
| 16688 OR-99 Hwy #36 | 0.71mi | 2/2.0 | 924 (-2%) | 22mo | $90,000 | $97 | 41 |
Match score weights: distance 35% · size 25% · config 20% · recency 20%. Top-matched comps best support the ARV.
Projected returns pro-forma
-3.0% appreciation · 2.94% rent growth · sell at horizon
- IRR
- -8.1%
- Equity multiple
- 0.70×
- Total profit
- $-13,010
- Equity at exit
- $23,111
- IRR
- 1.3%
- Equity multiple
- 1.09×
- Total profit
- $4,057
- Equity at exit
- $13,401
Cash invested: $43,400 (down + closing). Projections, not guarantees.
Landlord ↔ Tenant lean methodology
- Overall (STATE)
- 28 Tenant-Leaning
- State Oregon
- 28 Tenant-Leaning · D+6
- County
- — inherits STATE
- City
- — inherits STATE
ZIP-level market 97071
- Rents YoY
- 2.9%
- Active inventory
- 310
- Price-to-rent
- 8.1×
Monthly cashflow live
- Estimated rent
- $1,598 high interval (Pro) →
- Mortgage (P&I)
- −$813
- Tax est. 1.5%
- −$194 /mo · $2,325/yr
- Insurance
- −$65
- HOA
- −$0
- Vacancy / Maint / Mgmt
- −$336
- Net cashflow
- $191
Break-even live
Sensitivity live
| Price | -10% $298 | -5% $245 | +0% $191 | +5% $138 | +10% $84 |
|---|---|---|---|---|---|
| Rent | -10% $65 | -5% $128 | +0% $191 | +5% $254 | +10% $317 |
| Rate | -1.0pp $269 | -0.5pp $231 | base $191 | +0.5pp $151 | +1.0pp $110 |
UW: 25.0% down · 7.5% · 30yr · 1.5% tax · 5.0% vac · 8.0% maint · 8.0% mgmt
Financing live
Cash to close
- Down payment
- $38,750
- Closing costs
- $4,650
- Reserves months
- —
- Total cash needed
- —
Loan-product check · same deal, 3 products live
Conventional
25% down · 7.5% · 30yr
- Down + closing
- —
- Monthly P&I
- —
- Monthly cashflow
- —
- DSCR
- —
- Eligible?
- —
Personal DTI + credit; lowest rate.
DSCR
20% down · 8.5% · 30yr
- Down + closing
- —
- Monthly P&I
- —
- Monthly cashflow
- —
- DSCR
- —
- Eligible?
- —
No personal income docs; deal must DSCR.
Hard money
10% down · 12.0% · 12mo
- Down + closing
- —
- Monthly P&I
- —
- Monthly cashflow
- —
- DSCR
- —
- Eligible?
- —
Short-term bridge; refi at stabilization.
Rent comps 17 comps
| Address | Beds | Baths | Sqft | Rent | $/sqft | DOM | Units | Dist |
|---|---|---|---|---|---|---|---|---|
| 1341 W Hayes St Unit 02 Woodburn, OR | 2.0 | 1.0 | 891 | $1,495 | $1.68 | 45d | 1 | 0.20mi |
| 1560 Newberg Hwy Unit 180-29 Woodburn, OR | 2.0 | 1.0 | 930 | $1,350 | $1.45 | 45d | 1 | 0.23mi |
| 1560 Newberg Hwy Unit 180-25 Woodburn, OR | 2.0 | 1.0 | 930 | $1,350 | $1.45 | 15d | 1 | 0.23mi |
| 770 Evergreen Rd Unit 06 Woodburn, OR | 1.0 | 1.0 | 720 | $1,250 | $1.74 | 25d | 1 | 0.34mi |
| 1208 Newberg Hwy Woodburn, OR | 2.0 | 1.0 | 960 | $1,795 | $1.87 | 0d | 1 | 0.34mi |
| 1208 Newberg Hwy Unit 103-A Woodburn, OR | 2.0 | 1.0 | 960 | $1,795 | $1.87 | 45d | 1 | 0.34mi |
| 300 S Evergreen Rd Woodburn, OR | 1.0–2.0 | 1.0–2.0 | 774 | $1,770 | $2.29 | 14d | 1 | 0.55mi |
| 1123 N 3rd St Unit 1125 Woodburn, OR | 2.0 | 1.0 | 777 | $1,595 | $2.05 | 15d | 1 | 0.78mi |
| 311 S Evergreen Rd Woodburn, OR | 1.0–2.0 | 1.0–2.0 | 882 | $1,780 | $2.02 | 0d | 1 | 0.86mi |
| 477 Broadway St Unit 1 Woodburn, OR | 2.0 | 1.0 | 684 | $1,495 | $2.19 | 45d | 1 | 0.88mi |
| 2100 Arney Ln Woodburn, OR | 1.0–2.0 | 1.0–2.0 | 887 | $1,999 | $2.25 | 0d | 10 | 0.94mi |
| 1601 N Front St Woodburn, OR | 2.0 | 1.0 | 828 | $1,280 | $1.55 | 0d | 1 | 1.00mi |
| 398 Stacy Allison Way Woodburn, OR | 1.0–3.0 | 1.0–2.0 | 1008 | $2,087 | $2.07 | 4d | 108 | 1.00mi |
| 1398 E Cleveland St Woodburn, OR | 2.0 | 1.5 | 992 | $1,595 | $1.61 | 0d | 1 | 1.29mi |
| 1430 E Cleveland St Woodburn, OR | 2.0 | 2.0 | 860 | $1,708 | $1.99 | 0d | 3 | 1.32mi |
| 1458 E Cleveland St Woodburn, OR | 1.0 | 1.0 | 608 | $1,295 | $2.13 | 25d | 1 | 1.36mi |
| 8123 McCormick St Woodburn, OR | 3.0 | 1.0 | 1100 | $2,250 | $2.05 | 15d | 1 | 1.45mi |
Listing history 17 events
-
2026-06-21days on market $154,999 Active 68 DOM
-
2026-06-18days on market $154,999 Active 65 DOM
-
2026-06-17days on market $154,999 Active 64 DOM
-
2026-06-16days on market $154,999 Active 63 DOM
-
2026-06-15days on market $154,999 Active 62 DOM
-
2026-06-14days on market $154,999 Active 60 DOM
-
2026-06-10days on market $154,999 Active 57 DOM
-
2026-06-09days on market $154,999 Active 56 DOM
-
2026-06-08days on market $154,999 Active 55 DOM
-
2026-06-07days on market $154,999 Active 54 DOM
-
2026-06-05days on market $154,999 Active 51 DOM
-
2026-06-03days on market $154,999 Active 50 DOM
-
2026-06-02days on market $154,999 Active 49 DOM
-
2026-06-01days on market $154,999 Active 48 DOM
-
2026-05-31days on market $154,999 Active 47 DOM
-
2026-05-30days on market $154,999 Active 46 DOM
-
2026-04-10$154,999 Active 1066-char remark
Show marketing remark (1066 chars)
Located in Driftwood mobile home park Woodburn, Oregon across the street from golf course. This is a quiet clean 55+ community with a lease land space. Park rent is $595 a month. Clubhouse access for parties and get-togethers. This is a corner lot and it is by far the largest in the park. Beautifully remodeled and has a newer metal roof and furnace. Upgraded electrical panel and copper wiring with all new plugs, switches/dimmers and covers. . All new appliances. Open floor plan. The entire home has been repainted entirely inside and out. Completely remodeled kitchen with Under mount sink, convertible range hood, real quartz countertops with island bar. All new laminate wood flooring, and baseboard/trim throughout. New plumbing on all the sinks and shower. Large master bedroom with private deck access. Completely remodeled bathroom with a big brand new $10,000 walk-in tile shower. Two car driveway with carport and tons of outside shed storage. paver walkways and bbq area. Huge backyard and side yard with lots of garden space. Large covered rear deck.
ⓘ Source: listings_history table (triggers on properties + properties_extension) + one-shot
backfill from property_details.listing_events for pre-trigger history.
Climate risk First Street
- Flood 1/10 Low FEMA zone X (unshaded) · 0% chance over 30 yrs
- Wildfire 3/10 Moderate
- Heat 3/10 Moderate 7 d/yr ≥92°F today · 14 d/yr by 30 yrs out
- Wind 1/10 Low
- Air quality 10/10 Extreme 14 unhealthy d/yr today · 14 by 30 yrs out
Nearby sold comps map
Loading sold comps map…
Walkable amenities ~0.75 mi
Loading nearby amenities…
Taxation est. · year 1
- Rental income
- $19,176
- − Mortgage interest
- −$8,682
- − Property taxes
- −$2,325
- − Insurance
- −$775
- − Repairs & maintenance
- −$1,534
- − Management
- −$1,534
- − Depreciation
- −$4,509
- Taxable loss
- −$184
- Est. tax savings @ 24.0%
- +$44
- After-tax cash flow
- $2,339/yr
For passive investors: Depreciation is non-cash, so a rental often shows a tax loss while cash-flowing — sheltering income. Rental losses are passive: they offset passive income freely, and up to $25,000/yr can offset ordinary (W-2) income if you actively participate and your MAGI is under $100k (phasing out to $0 by $150k); unused losses carry forward. On sale, claimed depreciation is recaptured at up to 25%, and gains may owe capital-gains tax (a 1031 exchange can defer both). Figures are a year-1 estimate at your 24.0% rate — not tax advice; consult a CPA.
Schools (NCES district)
- District
- Woodburn SD 103
- NCES district ID
- 4113530
- Math proficiency
- 20% ▬ 0.00%
- Reading proficiency
- 31% ▼ -1.00%
- Median HH income
- $44,033
- Composite
- 24.9/100
- National rank
- #12993
- State rank
- #169 of 183 in OR
Livability — Woodburn
- Score
- 74/100
- State rank
- #91
- US rank
- #4490
Category grades
Schools grade is shown separately in the Schools card above.
Census & demographics
- Census place
- Woodburn, OR
- County
- Marion County · 258,219 people
- City population
- 33,123
- Metro
- Salem, OR
- Population (ZIP)
- 33,123
- Household income
- $70,938
- Rent vs Own
- Severe rent burden
- 1039.0
Population outlook (Marion County) Hauer SSP2
- Today (2025)
- 360,940 people
- By 2030
- 375,178 · +3.9%
- By 2040
- 400,914 · +11.1%
- By 2050
- 422,187 · +17.0%
- By 2075
- 460,305 · +27.5%
- By 2100
- 464,025 · +28.6%
Race, ethnicity, and origin ACS 2023
- Neighborhood character
- Majority Hispanic (61%)
- Race & ethnicity
- Hispanic / Latino 61% White 34% Two or more races 22% Native American 2% Asian 1%
- Hispanic origin (detail)
- Mexican 51%
- Common ancestry
- Scotch-Irish 2% Lithuanian 2% Romanian 2%
- Foreign-born
- 30% · Canada, China
- Languages at home
- 43% English-only · Spanish 53% Russian/Polish/Slavic 2%
Political lean MEDSL · Marion
- 2024 margin
- Toss-up / Even · D 47.5% · R 49.5% · Other 3.0%
- 2008→2024 swing
- -4.2pp toward R · 2008: 2.2pp · 2024: -2.0pp
- All cycles
- 2024: R+2.0 2020: D+1.1 2016: R+5.0 2012: R+3.5 2008: D+2.2
Not yet ingested
- Civics
- —
Market trends
- HPI YoY
- ▼ -353.43%
- Current HPI
- 297.3113
- Rent YoY
- ▲ 2.94%
- Metro
- Salem, OR
- State GDP YoY
- ▲ 2.05%
- F500 in state
- 2
Industry mix (Fortune 500 HQ in OR)
| Industry | F500 HQs | Revenue |
|---|---|---|
| Consumer Goods | 1 | $51B |
|
||
Price history
1 event — show timeline
- 2026-04-10 Listed $154,999 Fizber.com
Property tax history
+1.9%/yrLatest (2017): $228 · +26.2% YoY. Source: county tax records.
Cash-flow waterfall
monthlySold comps — $/sqft
last 12 mo · ≤1 miLoading sold comps…