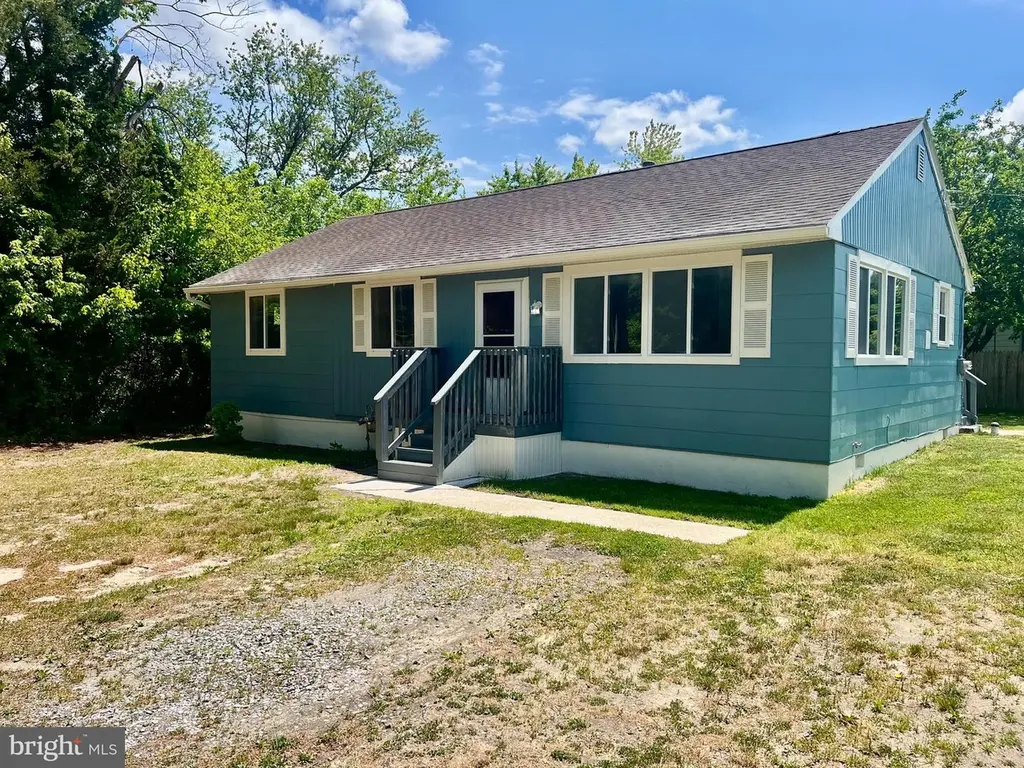
7901 Henry St · Laurel Lake, NJ
Flood risk 1/10 · Minimal
- FEMA flood zone
- X (unshaded)
- Chance of flooding over 30 yrs
- 0.0%
- Est. flood insurance / yr
- $507 – $1,088
Fire risk 3/10 · Minor
- Est. fire insurance / yr
- $526 – $976
Heat risk 7/10 · Major
- Hot days now (above 102°F)
- 7 days/yr
- Hot days in 30 yrs
- 15 days/yr
Wind risk 8/10 · Major
- Chance of severe wind over 30 yrs
- 80.0%
Air-quality risk 3/10 · Minor
- Unhealthy air days now
- 3 days/yr
- Unhealthy air days in 30 yrs
- 5 days/yr
Risk factors via First Street. Map © Google.
Why this score? — see what drove the D+ grade
The composite is a weighted blend of 9 inputs, each scored 0–100. Each bar is that input's sub-score; the figure is the points it added to the 100-point composite (weight × sub-score).
- Cash flow +16.7/30.0
- ARV discount +12.5/15.0
- DSCR +5.2/10.0
- 1% rule +4.3/10.0
- Rent growth +3.0/5.0
- Livability +2.8/5.0
- Condition / age +2.5/5.0
- Schools +1.5/10.0
- Appreciation +0.0/10.0
$199,900
🖨 Deal sheet (PDF) 📄 Offer letter ✓ Due diligence
Listing remarks
Welcome to 7901 Henry Street! This 3 bedroom, 1 bath home is turn- key! On a large, corner lot, this charming, single-story home boasts new heater and central air conditioning systems, new flooring, remodeled kitchen, updated roof, fresh paint and more. When entering the home, you will find a generous living room, with lots of natural light. The kitchen features plenty of room for eat-in dining space and provides access to the back yard. Down the hallway you will find three carpeted bedrooms and an updated bathroom featuring a tub-shower combo. A separate utility room hosts the new gas heater and includes laundry hook-ups. With lots of room for parking, and a large yard, this property als
Key facts
- 0.28 acre lot
- 6 parking spots
- Built 1960
Property features AI
Finance
- Other: Ownership: Fee simple; Property condition: Very good; Accessibility: 2+ access exits
Exterior
- Parking: Driveway parking (6 spaces); Unpaved parking
- Utilities: Private water source; Private septic tank; Hot water: Electric; Heating fuel: Natural gas
- Home design: Detached structure; Frame construction; Shingle roof; Crawl space foundation; Built year per assessor (above-grade finished area reported)
- Construction: Frame construction; Crawl space foundation; Shingle roof; Detached building
- Exterior features: Deck(s); Shed; Property on a corner lot (120 x 100 dimensions)
Interior
- Kitchen: Single oven
- Bedrooms: 3 bedrooms on the main level; Rooms include: Living Room, Bedroom 1, Bedroom 2, Bedroom 3
- Flooring: Carpet; Laminate
- Bathrooms: 1 full bathroom on the main level
- Heating & cooling: Forced air heating; Natural gas cooling fuel
- Interior features: Traditional floor plan; Combination kitchen and dining area; Dining area; Tub with shower; Entry-level bedroom
- Laundry & utility: Main-floor laundry
Neighborhood map
What this means for you Summary
Snapshot
- This is a 3-bed/1.0-bath single-family listed at $200k.
Deal economics
- At list price, monthly cash flow is $126 ($2k/yr) — positive.
- The deal already cash-flows at list — no discount required.
- To meet the 1% rule (rent ≥ 1% of price), the offer needs to be $185k (7.3% below list).
- Recommended offer: $185k (7.3% below list) — sets the bar for 1% rule.
Location & tenants
- Location reads 56/100 on livability (#521 in NJ) — a working-class tenant base; expect higher turnover. Strengths: crime A+, housing A+, cost of living B; Watch: amenities F, commute F, employment F.
- Commercial Township School District (rural): math 5% / reading 29% proficiency, ranked #449 of 472 in NJ (top 95%) — low school quality limits family demand, transient renter base, plan for 1-2y turnover; 65% free/reduced lunch — lower-income household profile, screen leases tightly.
- Zoned schools: Commercial Township School (math 5% / reading 29%, grade F, #1,081 of 1,303 statewide, top 84%, 470 students, 67% FRL) — zoned schools at 67% FRL track the district average.
- Market conditions: Rents rising (+1.9%/yr); 297 active listings in the ZIP; 3 comparable units currently listed for rent nearby; rentals lingering (median 46d on market — plan ~5-8 weeks vacancy on turnover, expect pricing pressure); 100% of comp listings sitting > 30 days — soft ceiling on asking rent; 216 units permitted in Cumberland County in 2024 (73 in 5+ unit buildings).
- This rent runs 33% of the median local income ($67k/yr) — at the standard rent-burdened threshold; future hikes will face affordability resistance.
Forward outlook
- Local home prices are declining (-3.0%/yr); year-one equity from $1k of loan paydown is wiped out by about $6k of value loss. Plan a longer hold.
- Cumberland County population projected to shrink 7% by 2050 — rents likely to lag national; underwrite the cash flow, not the appreciation.
Negotiation context
- Only 6 days on market — expect competitive offers; lowballing is unlikely to land.
Risks & watch-outs
- Climate carrying-cost: severe wind risk, 80% chance of damaging wind over 30y; extreme-heat days projected 7→15/yr by 2055 (HVAC capex compounding) — expect insurance premiums to compound above CPI over the hold.
Questions for the listing agent
- Built in 1960 — when were the roof, HVAC, electrical panel, plumbing, and water heater last replaced?
- Is there a deadline driving the sale (1031 exchange, divorce, estate, relocation)? That informs how much negotiation room exists.
- Schools are F-rated, which usually means shorter tenancies and higher turnover. Who's the typical renter profile here, and what's been the actual vacancy rate?
- The area grade is low — what's the realistic commute time and amenity access for the typical tenant pool here? Any planned neighborhood developments (good or bad) we should know about?
- What's the average days-on-market for RENTAL listings here right now (not sales)? A rising rental-DOM trend means longer vacancies and softer asking-rent achievability than the comps imply.
- What's the recent tenant-quality profile in this submarket — average credit score on applications, eviction rate, late-payment / NSF rate, and stable-employment percentage? A property-management company in the area should have these aggregated.
- How much new for-sale + rental construction is in the pipeline within 1–3 miles? Heavy new supply typically softens prices + rents 12–24 months out; constrained supply supports both.
Investment metrics
- 1% rule
- 0.93% ✗
- Cap rate
- 7.05%
- Cash-on-cash
- 2.69%
- DSCR
- 1.12
- GRM
- 9.0
CMA / ARV
- ARV (on-the-fly)
- $224,928
- Comps found
- 12
Show comp detail 12 sales within ~0.75 mi
| Address | Dist | Beds/Ba | Sqft | Sold | Price | $/sf | Match |
|---|---|---|---|---|---|---|---|
| 7210 Dove Pl | 0.19mi | 3/1.0 | 988 (-6%) | 1mo | $123,000 | $124 | 80 |
| 420 Doe Pl | 0.31mi | 3/1.0 | 1,056 (0%) | 7mo | $225,000 | $213 | 80 |
| 510 Mistle Rd | 0.18mi | 3/2.0 | 1,064 (+1%) | 14mo | $66,000 | $62 | 74 |
| 7178 Keron Dr | 0.17mi | 2/1.0 (-1) | 980 (-7%) | 3mo | $170,000 | $173 | 73 |
| 421 Evergreen Rd | 0.31mi | 2/1.0 (-1) | 1,040 (-2%) | 13mo | $200,000 | $192 | 67 |
| 7305 Samuel Dr | 0.34mi | 2/2.0 (-1) | 1,064 (+1%) | 14mo | $110,000 | $103 | 62 |
| 7241 Keron Dr | 0.21mi | 3/2.0 | 1,214 (+15%) | 2mo | $275,000 | $227 | 60 |
| 7201 Battle Ln | 0.62mi | 3/2.0 | 1,120 (+6%) | 10mo | $225,000 | $201 | 48 |
| 7414 Battle Ln | 0.63mi | 2/2.0 (-1) | 1,128 (+7%) | 8mo | $265,000 | $235 | 44 |
| 428 Quail Rd | 0.40mi | 2/1.5 (-1) | 942 (-11%) | 14mo | $215,000 | $228 | 44 |
| 7798 Battle Ln | 0.65mi | 3/2.0 | 1,152 (+9%) | 8mo | $265,000 | $230 | 44 |
| 7800 Battle Ln | 0.65mi | 3/2.0 | 1,152 (+9%) | 9mo | $273,000 | $237 | 43 |
Match score weights: distance 35% · size 25% · config 20% · recency 20%. Top-matched comps best support the ARV.
Projected returns pro-forma
-3.0% appreciation · 1.94% rent growth · sell at horizon
- IRR
- -13.2%
- Equity multiple
- 0.53×
- Total profit
- $-26,349
- Equity at exit
- $29,806
- IRR
- -5.9%
- Equity multiple
- 0.63×
- Total profit
- $-20,495
- Equity at exit
- $17,284
Cash invested: $55,972 (down + closing). Projections, not guarantees.
Landlord ↔ Tenant lean methodology
- Overall (STATE)
- 21 Tenant-Leaning
- State New Jersey
- 21 Tenant-Leaning · D+6
- County
- — inherits STATE
- City
- — inherits STATE
ZIP-level market 08332
- Home prices YoY
- -28.9%
- Rents YoY
- 1.9%
- Active inventory
- 297
- Price-to-rent
- 9.0×
Monthly cashflow live
- Estimated rent
- $1,853 medium interval (Pro) →
- Mortgage (P&I)
- −$1,048
- Tax from tax record
- −$206 /mo · $2,477/yr
- Insurance
- −$83
- HOA
- −$0
- Vacancy / Maint / Mgmt
- −$389
- Net cashflow
- $126
Break-even live
Sensitivity live
| Price | -10% $239 | -5% $182 | +0% $126 | +5% $69 | +10% $12 |
|---|---|---|---|---|---|
| Rent | -10% $-21 | -5% $52 | +0% $126 | +5% $199 | +10% $272 |
| Rate | -1.0pp $226 | -0.5pp $176 | base $126 | +0.5pp $74 | +1.0pp $21 |
UW: 25.0% down · 7.5% · 30yr · 1.5% tax · 5.0% vac · 8.0% maint · 8.0% mgmt
Financing live
Cash to close
- Down payment
- $49,975
- Closing costs
- $5,997
- Reserves months
- —
- Total cash needed
- —
Loan-product check · same deal, 3 products live
Conventional
25% down · 7.5% · 30yr
- Down + closing
- —
- Monthly P&I
- —
- Monthly cashflow
- —
- DSCR
- —
- Eligible?
- —
Personal DTI + credit; lowest rate.
DSCR
20% down · 8.5% · 30yr
- Down + closing
- —
- Monthly P&I
- —
- Monthly cashflow
- —
- DSCR
- —
- Eligible?
- —
No personal income docs; deal must DSCR.
Hard money
10% down · 12.0% · 12mo
- Down + closing
- —
- Monthly P&I
- —
- Monthly cashflow
- —
- DSCR
- —
- Eligible?
- —
Short-term bridge; refi at stabilization.
Rent comps 3 comps
| Address | Beds | Baths | Sqft | Rent | $/sqft | DOM | Units | Dist |
|---|---|---|---|---|---|---|---|---|
| 7357 William Ave Millville, NJ | 2.0 | 1.0 | 938 | $1,550 | $1.65 | 45d | 1 | 0.24mi |
| 136 Robin Rd Millville, NJ | 4.0 | 1.0 | 1308 | $2,500 | $1.91 | 45d | 1 | 0.74mi |
| 32 Rosewood Rd Millville, NJ | 3.0 | 1.0 | 1340 | $2,200 | $1.64 | 45d | 1 | 1.41mi |
Listing history 7 events
-
2026-06-15status $199,900 Pending 6 DOM
-
2026-06-07statusdays on market $199,900 Active Under Contract 6 DOM
-
2026-06-02days on market $199,900 Active 3 DOM
-
2026-06-01days on market $199,900 Active 2 DOM
-
2026-05-31statusdays on market $199,900 Active 1 DOM
-
2026-05-30days on market $199,900 Coming Soon 2 DOM
-
2026-05-28historical $199,900
ⓘ Source: listings_history table (triggers on properties + properties_extension) + one-shot
backfill from property_details.listing_events for pre-trigger history.
Tax reassessment forecast NJ · Partial reset (capped growth)
- Current annual tax
- $2,477 · $206/mo
- Projected year-2 tax
- $3,727 · $311/mo
- Expected delta
- +$1,250/yr (+$104/mo · 50.5%)
ⓘ Screening estimate from a state-policy table — verify with the county assessor before closing.
Climate risk First Street
- Flood 1/10 Low FEMA zone X (unshaded) · 0% chance over 30 yrs
- Wildfire 3/10 Moderate
- Heat 7/10 Severe 7 d/yr ≥102°F today · 15 d/yr by 30 yrs out
- Wind 8/10 Severe 80% chance of damaging wind over 30 yrs
- Air quality 3/10 Moderate 3 unhealthy d/yr today · 5 by 30 yrs out
Nearby sold comps map
Loading sold comps map…
Walkable amenities ~0.75 mi
Loading nearby amenities…
Taxation est. · year 1
- Rental income
- $22,231
- − Mortgage interest
- −$11,198
- − Property taxes
- −$2,477
- − Insurance
- −$1,000
- − Repairs & maintenance
- −$1,778
- − Management
- −$1,778
- − Depreciation
- −$5,815
- Taxable loss
- −$1,815
- Est. tax savings @ 24.0%
- +$436
- After-tax cash flow
- $1,942/yr
For passive investors: Depreciation is non-cash, so a rental often shows a tax loss while cash-flowing — sheltering income. Rental losses are passive: they offset passive income freely, and up to $25,000/yr can offset ordinary (W-2) income if you actively participate and your MAGI is under $100k (phasing out to $0 by $150k); unused losses carry forward. On sale, claimed depreciation is recaptured at up to 25%, and gains may owe capital-gains tax (a 1031 exchange can defer both). Figures are a year-1 estimate at your 24.0% rate — not tax advice; consult a CPA.
Schools (NCES district)
- District
- Commercial Township School District
- NCES district ID
- 3403480
- Math proficiency
- 5% ▼ -7.00%
- Reading proficiency
- 29% ▲ 10.00%
- Median HH income
- $45,143
- Composite
- 14.86/100
- National rank
- #9378
- State rank
- #449 of 472 in NJ
Livability — Laurel Lake
- Score
- 56/100
- State rank
- #521
- US rank
- #22397
Category grades
Schools grade is shown separately in the Schools card above.
Census & demographics
- Census place
- Laurel Lake, NJ
- County
- Cumberland County · 80,266 people
- Metro
- Vineland-Bridgeton, NJ
- Population (ZIP)
- 35,228
- Household income
- $67,496
- Rent vs Own
- Severe rent burden
- 1761.0
Population outlook (Cumberland County) Hauer SSP2
- Today (2025)
- 152,743 people
- By 2030
- 150,373 · -1.6%
- By 2040
- 146,881 · -3.8%
- By 2050
- 142,653 · -6.6%
- By 2075
- 129,468 · -15.2%
- By 2100
- 107,456 · -29.6%
Race, ethnicity, and origin ACS 2023
- Neighborhood character
- Diverse neighborhood (Simpson 0.60)
- Race & ethnicity
- White 59% Hispanic / Latino 17% Black 15% Two or more races 11% Asian 2%
- Hispanic origin (detail)
- Mexican 4% Puerto Rican 10%
- Common ancestry
- Romanian 4% Lithuanian 2% Slovak 1%
- Foreign-born
- 7% · Canada
- Languages at home
- 85% English-only · Spanish 11% Other Indo-European 1% Other Asian/Pacific 1%
Political lean MEDSL · Cumberland
- 2024 margin
- Toss-up / Even · D 47.6% · R 51.3% · Other 1.1%
- 2008→2024 swing
- -25.4pp toward R · 2008: 21.6pp · 2024: -3.8pp
- All cycles
- 2024: R+3.8 2020: D+6.0 2016: D+5.3 2012: D+23.1 2008: D+21.6
Not yet ingested
- Civics
- —
Market trends
- HPI YoY
- ▼ -111.45%
- Current HPI
- 274.8011
- Rent YoY
- ▲ 1.94%
- Metro
- Vineland-Bridgeton, NJ
- State GDP YoY
- ▲ 2.05%
- F500 in state
- 34
Industry mix (Fortune 500 HQ in NJ)
| Industry | F500 HQs | Revenue |
|---|---|---|
| Consumer Goods | 3 | $31B |
|
||
| Pharmaceuticals | 2 | $153B |
|
||
| Technology | 2 | $21B |
|
||
| Insurance | 2 | $20B |
|
||
| Healthcare | 2 | $19B |
|
||
| Financial Services | 1 | $70B |
|
||
Price history
1 event — show timeline
- 2026-05-28 Coming Soon $199,900 BRIGHT MLS
Property tax history
+2.4%/yrLatest (2025): $2,477 · +4.9% YoY. Source: county tax records.
Cash-flow waterfall
monthlySold comps — $/sqft
last 12 mo · ≤1 miLoading sold comps…