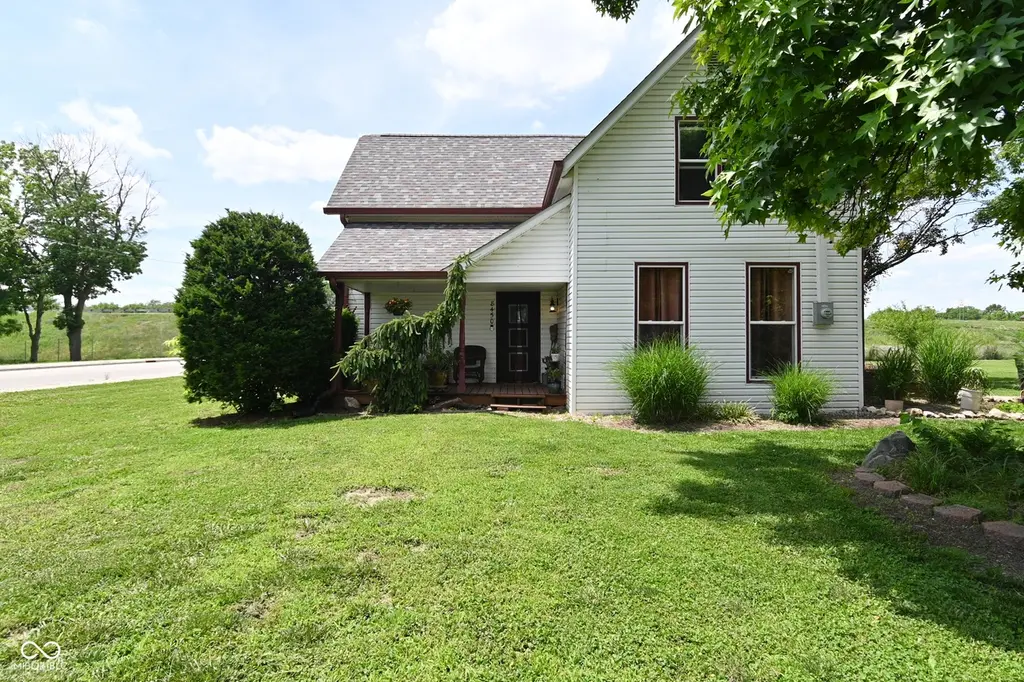
8450 S Belmont Ave · Indianapolis city (balance), IN
Flood risk 1/10 · Minimal
- FEMA flood zone
- X (unshaded)
- Chance of flooding over 30 yrs
- 0.0%
- Est. flood insurance / yr
- $507 – $1,088
Fire risk 1/10 · Minimal
- Est. fire insurance / yr
- $717 – $1,331
Heat risk 4/10 · Minor
- Hot days now (above 101°F)
- 7 days/yr
- Hot days in 30 yrs
- 19 days/yr
Wind risk 2/10 · Minimal
- Chance of severe wind over 30 yrs
- 1.0%
Air-quality risk 2/10 · Minimal
- Unhealthy air days now
- 2 days/yr
- Unhealthy air days in 30 yrs
- 2 days/yr
Risk factors via First Street. Map © Google.
Why this score? — see what drove the C- grade
The composite is a weighted blend of 9 inputs, each scored 0–100. Each bar is that input's sub-score; the figure is the points it added to the 100-point composite (weight × sub-score).
- Cash flow +16.1/30.0
- ARV discount +15.0/15.0
- DSCR +5.0/10.0
- 1% rule +3.6/10.0
- Schools +3.5/10.0
- Rent growth +3.4/5.0
- Livability +2.5/5.0
- Condition / age +2.5/5.0
- Appreciation +0.0/10.0
$215,000
🖨 Deal sheet (PDF) 📄 Offer letter ✓ Due diligence
Listing remarks MLS
3 bedroom 1 1/2 bath home on a corner lot. New flooring in the bathrooms and kitchen areas. Home is being sold AS IS with the right to inspect. Fenced yard. Easy access to US37.
Key facts
- Porch
- Almost 1 full acre
- Many renovations
Tags
Property features AI
Exterior
- Parking: Detached garage (1 car)
- Utilities: Private water source; Septic system; Electricity connected; Natural gas connected; Solid waste service available
- Home design: Single family residence; Updated/remodeled condition; Two levels; Approximately 0.94 acre lot (about 1/2–1 acre); Additional parcel(s) included
- Construction: Vinyl siding; Crawl space foundation
- Exterior features: Covered patio; Patio; Storage shed
Interior
- Kitchen: Gas oven; Microwave with hood; Garbage disposal; Refrigerator
- Bedrooms: Three bedrooms total — one on the main level and two on the upper level
- Bathrooms: One full bathroom and one half bathroom (full bath on upper level, half bath on main level)
- Heating & cooling: Forced air heating (natural gas); Central air conditioning
- Interior features: Attic access; Eat-in kitchen
- Laundry & utility: Washer and dryer; Gas water heater
Neighborhood map
What this means for you Summary
Snapshot
- This is a 3-bed/1.5-bath single-family listed at $215k.
Deal economics
- At list price, monthly cash flow is $109 ($1k/yr) — positive.
- The deal already cash-flows at list — no discount required.
- To meet the 1% rule (rent ≥ 1% of price), the offer needs to be $186k (13.6% below list).
- Recommended offer: $186k (13.6% below list) — sets the bar for 1% rule.
- Cap rate 6.9% vs local median 4.4% in Indianapolis city (balance) — top-decile yield for the area; either an underpriced asset or a hidden risk that comps aren't pricing in. Stress-test before assuming the spread holds.
Location & tenants
- Location reads: area grade C — affects rentability + tenant quality, not the cash-flow math above.
- Perry Township Schools (urban): math 36% / reading 45% proficiency, ranked #138 of 301 in IN (top 46%) — families likely to look elsewhere, expect single-tenant / working-renter base with shorter leases.
- Zoned schools: Glenns Valley Elementary School (math 53% / reading 41%, grade D-, #325 of 994 statewide, top 36%, 726 students, 70% FRL); Perry Meridian Middle School (math 33% / reading 51%, grade D-, #102 of 330 statewide, top 32%, 1,292 students, 66% FRL); Perry Meridian High School (math 34% / reading 64%, grade D, #136 of 369 statewide, top 37%, 2,350 students, 58% FRL).
- Market conditions: Rents rising (+3.5%/yr); 214 active listings in the ZIP; 10 comparable units currently listed for rent nearby; rentals leasing fast (median 7d on market — plan ~1-2 weeks tenant-placement turnaround); solid renter incomes; 1,906 units permitted in Marion County in 2024 (621 in 5+ unit buildings).
Forward outlook
- Local home prices are declining (-3.0%/yr); year-one equity from $1k of loan paydown is wiped out by about $6k of value loss. Plan a longer hold.
- Marion County population projected at +18% by 2050 — long-run rental-demand tailwind backs the buy-and-hold thesis.
Negotiation context
- It's been on market 17 days — a 2% lower offer ($212k) is reasonable based on typical stale-listing flexibility.
- 8 sale attempts since 17y ago with the ask held roughly flat each time — persistent listings suggest the price (not the market) is what's stuck; bring a comps-based counter.
- Current owner paid $26k; list at $215k implies a 732% gain — meaningful room to come down on a strong offer.
Risks & watch-outs
- Watch-outs: built in 1880 — expect roof / HVAC / electrical / plumbing capex.
Questions for the listing agent
- Built in 1880 — when were the roof, HVAC, electrical panel, plumbing, and water heater last replaced?
- Is there a deadline driving the sale (1031 exchange, divorce, estate, relocation)? That informs how much negotiation room exists.
- What's the average days-on-market for RENTAL listings here right now (not sales)? A rising rental-DOM trend means longer vacancies and softer asking-rent achievability than the comps imply.
- What's the recent tenant-quality profile in this submarket — average credit score on applications, eviction rate, late-payment / NSF rate, and stable-employment percentage? A property-management company in the area should have these aggregated.
- How much new for-sale + rental construction is in the pipeline within 1–3 miles? Heavy new supply typically softens prices + rents 12–24 months out; constrained supply supports both.
Investment metrics
- 1% rule
- 0.86% ✗
- Cap rate
- 6.90%
- Cash-on-cash
- 2.18%
- DSCR
- 1.10
- GRM
- 9.6
CMA / ARV
- ARV (on-the-fly)
- $267,264
- Comps found
- 7
Show comp detail 7 sales within ~0.75 mi
| Address | Dist | Beds/Ba | Sqft | Sold | Price | $/sf | Match |
|---|---|---|---|---|---|---|---|
| 8248 S Belmont Ave | 0.21mi | 4/2.0 (+1) | 1,560 (+2%) | 1mo | $249,900 | $160 | 80 |
| 1834 Friendship Dr | 0.46mi | 3/2.0 | 1,441 (-6%) | 0mo | $290,000 | $201 | 66 |
| 1818 Winding Ridge Ave | 0.63mi | 3/2.5 | 1,674 (+9%) | 2mo | $335,000 | $200 | 50 |
| 8054 Painted Pony Dr | 0.60mi | 3/2.0 | 1,378 (-10%) | 12mo | $240,000 | $174 | 43 |
| 7884 Sergi Canyon Dr | 0.70mi | 3/2.5 | 1,698 (+10%) | 3mo | $180,100 | $106 | 43 |
| 8339 Hill Gail Dr | 0.73mi | 3/2.5 | 1,761 (+15%) | 10mo | $361,000 | $205 | 29 |
| 7860 Sergi Canyon Dr | 0.70mi | 3/2.5 | 1,752 (+14%) | 13mo | $285,000 | $163 | 29 |
Match score weights: distance 35% · size 25% · config 20% · recency 20%. Top-matched comps best support the ARV.
Projected returns pro-forma
-3.0% appreciation · 3.46% rent growth · sell at horizon
- IRR
- -12.4%
- Equity multiple
- 0.55×
- Total profit
- $-27,062
- Equity at exit
- $32,057
- IRR
- -2.7%
- Equity multiple
- 0.81×
- Total profit
- $-11,225
- Equity at exit
- $18,589
Cash invested: $60,200 (down + closing). Projections, not guarantees.
Landlord ↔ Tenant lean methodology
- Overall (STATE)
- 90 Strongly Landlord-Friendly
- State Indiana
- 90 Strongly Landlord-Friendly · R+11
- County
- — inherits STATE
- City
- — inherits STATE
ZIP-level market 46217
- Rents YoY
- 3.5%
- Active inventory
- 214
- Price-to-rent
- 9.6×
Monthly cashflow live
- Estimated rent
- $1,858 high interval (Pro) →
- Mortgage (P&I)
- −$1,127
- Tax from tax record
- −$142 /mo · $1,698/yr
- Insurance
- −$90
- HOA
- −$0
- Lot rent
- −$0
- Vacancy / Maint / Mgmt
- −$390
- Net cashflow
- $109
Break-even live
Sensitivity live
| Price | -10% $231 | -5% $170 | +0% $109 | +5% $48 | +10% $-12 |
|---|---|---|---|---|---|
| Rent | -10% $-37 | -5% $36 | +0% $109 | +5% $183 | +10% $256 |
| Rate | -1.0pp $218 | -0.5pp $164 | base $109 | +0.5pp $54 | +1.0pp $-3 |
UW: 25.0% down · 7.5% · 30yr · 1.5% tax · 5.0% vac · 8.0% maint · 8.0% mgmt
Financing live
Cash to close
- Down payment
- $53,750
- Closing costs
- $6,450
- Reserves months
- —
- Total cash needed
- —
Loan-product check · same deal, 3 products live
Conventional
25% down · 7.5% · 30yr
- Down + closing
- —
- Monthly P&I
- —
- Monthly cashflow
- —
- DSCR
- —
- Eligible?
- —
Personal DTI + credit; lowest rate.
DSCR
20% down · 8.5% · 30yr
- Down + closing
- —
- Monthly P&I
- —
- Monthly cashflow
- —
- DSCR
- —
- Eligible?
- —
No personal income docs; deal must DSCR.
Hard money
10% down · 12.0% · 12mo
- Down + closing
- —
- Monthly P&I
- —
- Monthly cashflow
- —
- DSCR
- —
- Eligible?
- —
Short-term bridge; refi at stabilization.
Rent comps 10 comps
| Address | Beds | Baths | Sqft | Rent | $/sqft | DOM | Units | Dist |
|---|---|---|---|---|---|---|---|---|
| 8611 Gandy Ct Indianapolis, IN | 3.0 | 2.0 | 1064 | $1,626 | $1.53 | 20d | 1 | 1.11mi |
| 8145 Maple Stream Ln Indianapolis, IN | 3.0 | 2.5 | 1688 | $1,756 | $1.04 | 26d | 1 | 1.16mi |
| 2808 Dawnlake Dr Indianapolis, IN | 3.0 | 2.5 | 1481 | $1,750 | $1.18 | 5d | 1 | 1.23mi |
| 8705 Zephyr Dr Indianapolis, IN | 3.0 | 1.5 | 1064 | $1,575 | $1.48 | 6d | 1 | 1.24mi |
| 2755 Bloom Dr Greenwood, IN | 1.0–3.0 | 1.0–2.0 | 1172 | $2,000 | $1.71 | 0d | 74 | 1.25mi |
| 7247 Vista Cir Indianapolis, IN | 1.0–3.0 | 1.0–2.0 | 1086 | $2,111 | $1.94 | 0d | 26 | 1.25mi |
| 8020 Lake Tree Cir Indianapolis, IN | 3.0 | 2.5 | 1690 | $1,835 | $1.09 | 10d | 1 | 1.30mi |
| 7150 Parklake Pl Indianapolis, IN | 3.0 | 2.0 | 1288 | $1,895 | $1.47 | 5d | 1 | 1.30mi |
| 8101 Railroad Rd Indianapolis, IN | 4.0 | 1.5 | 1604 | $1,766 | $1.10 | 24d | 1 | 1.33mi |
| 825 Country Ln Indianapolis, IN | 3.0 | 2.0 | 1892 | $1,831 | $0.97 | 0d | 1 | 1.48mi |
Listing history 11 events
-
2026-06-22days on market $215,000 Active 17 DOM
-
2026-06-21days on market $215,000 Active 16 DOM
-
2026-06-18days on market $215,000 Active 13 DOM
-
2026-06-17days on market $215,000 Active 12 DOM
-
2026-06-16days on market $215,000 Active 11 DOM
-
2026-06-15days on market $215,000 Active 10 DOM
-
2026-06-13days on market $215,000 Active 8 DOM
-
2026-06-09days on market $215,000 Active 4 DOM
-
2026-06-08days on market $215,000 Active 3 DOM
-
2026-06-07remarks 695-char remark
-
2026-06-07$215,000 Active 2 DOM
ⓘ Source: listings_history table (triggers on properties + properties_extension) + one-shot
backfill from property_details.listing_events for pre-trigger history.
Tax reassessment forecast IN · Partial reset (capped growth)
- Current annual tax
- $1,698 · $142/mo
- Projected year-2 tax
- $1,763 · $147/mo
- Expected delta
- +$65/yr (+$5/mo · 3.8%)
ⓘ Screening estimate from a state-policy table — verify with the county assessor before closing.
Climate risk First Street
- Flood 1/10 Low FEMA zone X (unshaded) · 0% chance over 30 yrs
- Wildfire 1/10 Low
- Heat 4/10 Moderate 7 d/yr ≥101°F today · 19 d/yr by 30 yrs out
- Wind 2/10 Low 100% chance of damaging wind over 30 yrs
- Air quality 2/10 Low 2 unhealthy d/yr today · 2 by 30 yrs out
Nearby sold comps map
Loading sold comps map…
Walkable amenities ~0.75 mi
Loading nearby amenities…
Taxation est. · year 1
- Rental income
- $22,298
- − Mortgage interest
- −$12,043
- − Property taxes
- −$1,698
- − Insurance
- −$1,075
- − Repairs & maintenance
- −$1,784
- − Management
- −$1,784
- − Depreciation
- −$6,255
- Taxable loss
- −$2,341
- Est. tax savings @ 24.0%
- +$562
- After-tax cash flow
- $1,874/yr
For passive investors: Depreciation is non-cash, so a rental often shows a tax loss while cash-flowing — sheltering income. Rental losses are passive: they offset passive income freely, and up to $25,000/yr can offset ordinary (W-2) income if you actively participate and your MAGI is under $100k (phasing out to $0 by $150k); unused losses carry forward. On sale, claimed depreciation is recaptured at up to 25%, and gains may owe capital-gains tax (a 1031 exchange can defer both). Figures are a year-1 estimate at your 24.0% rate — not tax advice; consult a CPA.
Schools (NCES district)
- District
- Perry Township Schools
- NCES district ID
- 1808820
- Math proficiency
- 36% ▼ -13.00%
- Reading proficiency
- 45% ▼ -6.00%
- Median HH income
- $47,170
- Composite
- 34.61/100
- National rank
- #5153
- State rank
- #138 of 301 in IN
Livability — Indianapolis city (balance)
No livability data for this city. (Only ~50 U.S. cities are tracked.)
Census & demographics
- Census place
- Indianapolis city (balance), IN
- County
- Marion County · 998,460 people
- City population
- 881,119
- Metro
- Indianapolis-Carmel-Anderson, IN
- Population (ZIP)
- 36,917
- Household income
- $92,029
- Rent vs Own
- Severe rent burden
- 472.0
Population outlook (Marion County) Hauer SSP2
- Today (2025)
- 1,025,572 people
- By 2030
- 1,065,727 · +3.9%
- By 2040
- 1,141,577 · +11.3%
- By 2050
- 1,208,920 · +17.9%
- By 2075
- 1,367,288 · +33.3%
- By 2100
- 1,438,201 · +40.2%
Race, ethnicity, and origin ACS 2023
- Neighborhood character
- Diverse neighborhood (Simpson 0.60)
- Race & ethnicity
- White 59% Asian 20% Black 10% Hispanic / Latino 8% Two or more races 6%
- Hispanic origin (detail)
- Mexican 6%
- Common ancestry
- Lithuanian 3% Romanian 2% Iranian 1%
- Foreign-born
- 17% · Philippines, Canada, China
- Languages at home
- 76% English-only · Other Asian/Pacific 15% Spanish 6% Other Indo-European 1%
Political lean MEDSL · Marion
- 2024 margin
- Strong D (+27.7) · D 63.0% · R 35.3% · Other 1.7%
- 2008→2024 swing
- -0.7pp no change · 2008: 28.4pp · 2024: 27.7pp
- All cycles
- 2024: D+27.7 2020: D+29.1 2016: D+22.8 2012: D+22.2 2008: D+28.4
Not yet ingested
- Civics
- —
Market trends
- HPI YoY
- ▼ -221.18%
- Current HPI
- 223.147
- Rent YoY
- ▲ 3.46%
- Metro
- Indianapolis-Carmel-Anderson, IN
- State GDP YoY
- ▲ 2.90%
- F500 in state
- 18
Industry mix (Fortune 500 HQ in IN)
| Industry | F500 HQs | Revenue |
|---|---|---|
| Industrial Machinery | 2 | $37B |
|
||
| Healthcare | 1 | $177B |
|
||
| Pharmaceuticals | 1 | $45B |
|
||
| Metals / Steel | 1 | $18B |
|
||
| Agriculture | 1 | $17B |
|
||
| Packaging | 1 | $12B |
|
||
Price history
+105.0% since first listed26 events — show timeline
- 2026-06-05 Listed $215,000 MIBOR as Distributed by MLS Grid
- 2020-09-14 Sold (Public Records) $25,850 Public Records
- 2016-10-31 Sold (MLS) $81,000 MIBOR as Distributed by MLS Grid
- 2016-09-14 Contingent — MIBOR as Distributed by MLS Grid
- 2016-09-12 Pending — MIBOR as Distributed by MLS Grid
- 2016-07-27 Relisted — MIBOR as Distributed by MLS Grid
- 2016-07-12 Contingent — MIBOR as Distributed by MLS Grid
- 2016-05-19 Pending — MIBOR as Distributed by MLS Grid
- 2016-04-06 Listed $89,900 MIBOR as Distributed by MLS Grid
- 2016-01-26 Listing Removed — MIBOR as Distributed by MLS Grid
- 2016-01-14 Relisted — MIBOR as Distributed by MLS Grid
- 2016-01-09 Listing Removed — MIBOR as Distributed by MLS Grid
- 2015-11-03 Relisted — MIBOR as Distributed by MLS Grid
- 2015-10-21 Pending — MIBOR as Distributed by MLS Grid
- 2015-09-22 Price Changed $89,900 MIBOR as Distributed by MLS Grid
- 2015-09-22 Price Changed $79,899 MIBOR as Distributed by MLS Grid
- 2015-09-22 Price Changed $79,900 MIBOR as Distributed by MLS Grid
- 2015-09-04 Price Changed $79,900 MIBOR as Distributed by MLS Grid
- 2015-06-04 Price Changed $89,900 MIBOR as Distributed by MLS Grid
- 2015-06-04 Price Changed $89,899 MIBOR as Distributed by MLS Grid
- 2015-05-08 Price Changed $89,900 MIBOR as Distributed by MLS Grid
- 2015-04-10 Listed $100,000 MIBOR as Distributed by MLS Grid
- 2012-07-13 Listing Removed — MIBOR as Distributed by MLS Grid
- 2012-04-15 Listing Removed — MIBOR as Distributed by MLS Grid
- 2011-04-14 Listed $104,900 MIBOR as Distributed by MLS Grid
- 2009-07-02 Listed $104,900 MIBOR as Distributed by MLS Grid
Property tax history
+2.0%/yrLatest (2025): $1,698 · +5.0% YoY. Source: county tax records.
Cash-flow waterfall
monthlySold comps — $/sqft
last 12 mo · ≤1 miLoading sold comps…