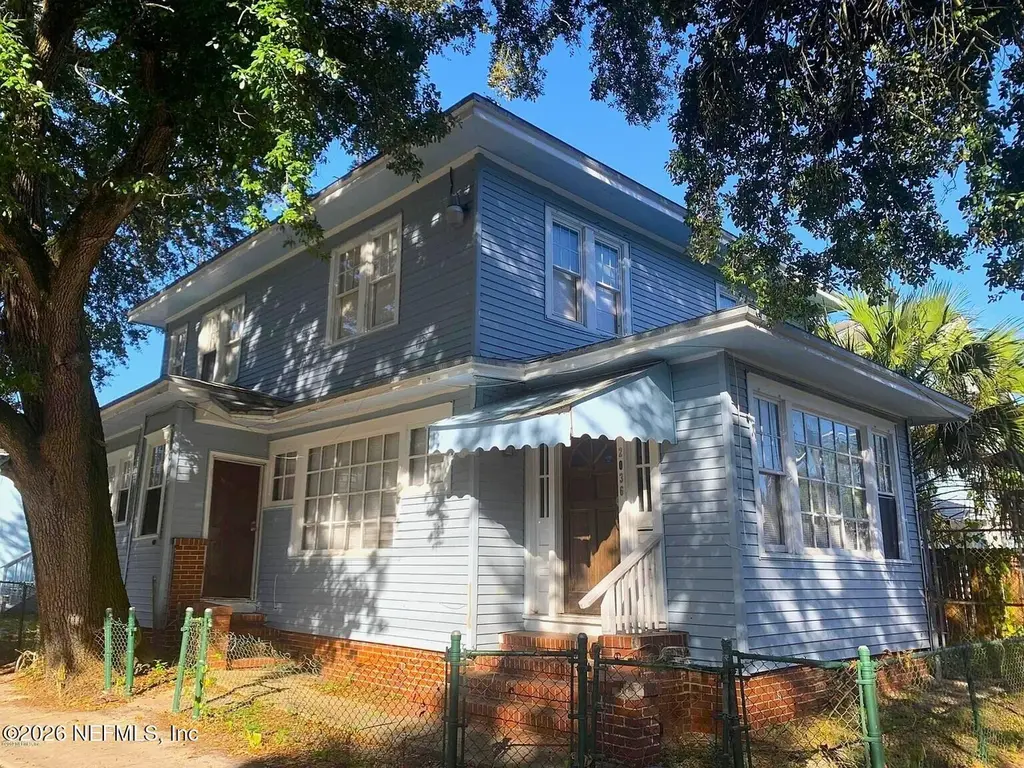
2036 Moncrief Rd · Jacksonville, FL
Flood risk 1/10 · Minimal
- FEMA flood zone
- X (unshaded)
- Chance of flooding over 30 yrs
- 0.0%
- Est. flood insurance / yr
- $507 – $1,088
Fire risk 1/10 · Minimal
- Est. fire insurance / yr
- $947 – $1,759
Heat risk 9/10 · Severe
- Hot days now (above 107°F)
- 7 days/yr
- Hot days in 30 yrs
- 20 days/yr
Wind risk 9/10 · Severe
- Chance of severe wind over 30 yrs
- 99.0%
Air-quality risk 5/10 · Moderate
- Unhealthy air days now
- 7 days/yr
- Unhealthy air days in 30 yrs
- 7 days/yr
Risk factors via First Street. Map © Google.
Why this score? — see what drove the C+ grade
The composite is a weighted blend of 9 inputs, each scored 0–100. Each bar is that input's sub-score; the figure is the points it added to the 100-point composite (weight × sub-score).
- Cash flow +22.7/30.0
- ARV discount +15.0/15.0
- DSCR +7.3/10.0
- 1% rule +5.6/10.0
- Livability +4.2/5.0
- Schools +3.9/10.0
- Rent growth +3.0/5.0
- Condition / age +2.5/5.0
- Appreciation +0.0/10.0
$180,000
🖨 Deal sheet 📄 Offer letter ✓ Due diligence
Listing remarks MLS
Almost 3000sf of living space plus the apartment in the back included for only 50k! Just need a some for to make it your! Sold 'AS IS'
Key facts
- 3,920 sq ft lot
- Built 1937
- Listed 28 days
Property features AI
Finance
- Financial info: Property listed/used as investment and residential (single family)
- HOA & community: Not a senior community
Exterior
- Parking: Off-street parking; Other parking
- Security: Smoke detectors
- Utilities: Public sewer; Electricity connected; Sewer connected; Water connected
- Home design: Single family residence; Two levels; Entry level on main floor; Faces northeast
- Construction: Block, frame, vinyl siding and wood siding construction; Shingle roof
- Exterior features: Courtyard; Fenced backyard (full, chain link); Corner lot; Dead-end street; City street frontage; Guest house; Workshop
Interior
- Kitchen: Electric oven; Electric range; Microwave; Refrigerator; Pantry; Eat-in kitchen
- Bedrooms: 4 bedrooms; Primary: large with 2 walk-in closets (second level); Bedroom 2: medium with walk-in closet (second level); Bedroom 3: small (second level); Bedroom 4: den off the living room (main level)
- Flooring: Tile; Wood
- Bathrooms: 2 full bathrooms
- Heating & cooling: Central heating (electric); Central air; Multiple cooling units; Wall/window unit(s)
- Interior features: Built-in features; Butler pantry; Ceiling fans; Eat-in kitchen; Entrance foyer; Guest suite; Pantry; Walk-in closets; Wine cellar; Mudroom between kitchen and laundry; Fireplace (1)
- Laundry & utility: Washer and dryer included; Laundry in unit on lower level; Electric water heater
Neighborhood map
What this means for you Summary
Snapshot
- This is a 4-bed/2.0-bath single-family listed at $180k.
Deal economics
- At list price, monthly cash flow is $310 ($4k/yr) — positive.
- The deal already cash-flows at list — no discount required.
- Meets the 1% rule at list price ($2k rent vs $180k).
- Recommended offer: $177k (1.5% below list) — sets the bar for market timing.
- Cap rate 8.4% vs local median 4.0% in Jacksonville — top-decile yield for the area; either an underpriced asset or a hidden risk that comps aren't pricing in. Stress-test before assuming the spread holds.
Location & tenants
- Location reads 83/100 on livability (#50 in FL, #911 nationally) — a professional / high-income tenant draw. Strengths: amenities A+, commute A+, housing A+.
- Duval (urban): math 46% / reading 45% proficiency, ranked #48 of 73 in FL (top 66%) — families likely to look elsewhere, expect single-tenant / working-renter base with shorter leases.
- Zoned schools: Northwestern Legends Elementary (math 21% / reading 14%, grade F, #2,117 of 2,144 statewide, top 99%, 528 students, 88% FRL); Matthew W. Gilbert Middle School (math 26% / reading 17%, grade F, #553 of 571 statewide, top 97%, 688 students, 86% FRL); William M. Raines High School (math 14% / reading 13%, grade F, #616 of 667 statewide, top 92%, 1,217 students, 78% FRL) — zoned schools average 84% FRL vs 49% district-wide (35 pts higher); higher-poverty schools than district average — tighter screening recommended.
- Zoned-school proficiency averages 18% at this address vs 46% district-wide (-28 pts) — the specific schools serving this property underperform the Duval average; the district grade overstates school quality for this exact location.
- Market conditions: Rents rising (+1.8%/yr); 394 active listings in the ZIP; 21 comparable units currently listed for rent nearby; rentals at typical pace (median 24d on market — plan ~3-4 weeks tenant-placement turnaround); lower-income renter base — watch delinquency; 6,503 units permitted in Duval County in 2024 (1,131 in 5+ unit buildings).
Forward outlook
- Local home prices are declining (-3.0%/yr); year-one equity from $1k of loan paydown is wiped out by about $5k of value loss. Plan a longer hold.
- Duval County population projected at +19% by 2050 — long-run rental-demand tailwind backs the buy-and-hold thesis.
Negotiation context
- It's been on market 28 days — a 2% lower offer ($177k) is reasonable based on typical stale-listing flexibility.
- 6 sale attempts since 19y ago with the ask held roughly flat each time — persistent listings suggest the price (not the market) is what's stuck; bring a comps-based counter.
- Current owner paid $44k; list at $180k implies a 309% gain — meaningful room to come down on a strong offer.
Risks & watch-outs
- Watch-outs: built in 1937 — expect roof / HVAC / electrical / plumbing capex.
- Climate carrying-cost: severe wind risk, 99% chance of damaging wind over 30y; extreme-heat days projected 7→20/yr by 2055 (HVAC capex compounding) — expect insurance premiums to compound above CPI over the hold.
Questions for the listing agent
- Built in 1937 — when were the roof, HVAC, electrical panel, plumbing, and water heater last replaced?
- Is there a deadline driving the sale (1031 exchange, divorce, estate, relocation)? That informs how much negotiation room exists.
- Schools are B-rated — typically a magnet for longer-tenancy family renters. What's the average tenant stay here, and is there a school-zone premium baked into asking?
- What's the average days-on-market for RENTAL listings here right now (not sales)? A rising rental-DOM trend means longer vacancies and softer asking-rent achievability than the comps imply.
- What's the recent tenant-quality profile in this submarket — average credit score on applications, eviction rate, late-payment / NSF rate, and stable-employment percentage? A property-management company in the area should have these aggregated.
- How much new for-sale + rental construction is in the pipeline within 1–3 miles? Heavy new supply typically softens prices + rents 12–24 months out; constrained supply supports both.
Investment metrics
- 1% rule
- 1.06% ✓
- Cap rate
- 8.36%
- Cash-on-cash
- 7.37%
- DSCR
- 1.33
- GRM
- 7.8
CMA / ARV
- ARV (on-the-fly)
- $315,792
- Comps found
- 9
Show comp detail 9 sales within ~0.75 mi
| Address | Dist | Beds/Ba | Sqft | Sold | Price | $/sf | Match |
|---|---|---|---|---|---|---|---|
| 1021 W 13th St | 0.17mi | 5/2.0 (+1) | 1,974 (-10%) | 15mo | $200,000 | $101 | 58 |
| 338 W 11th St W | 0.58mi | 5/3.0 (+1) | 2,162 (-1%) | 6mo | $225,000 | $104 | 56 |
| 1854 N Pearl St | 0.64mi | 4/2.0 | 2,005 (-9%) | 4mo | $307,000 | $153 | 52 |
| 1532 Louisiana St | 0.50mi | 3/2.0 (-1) | 1,930 (-12%) | 4mo | $134,500 | $70 | 49 |
| 1552 N Pearl St | 0.74mi | 3/2.0 (-1) | 2,128 (-3%) | 19mo | $156,000 | $73 | 40 |
| 354 W 7th St | 0.63mi | 3/2.0 (-1) | 2,016 (-8%) | 16mo | $290,000 | $144 | 38 |
| 1631 Boulevard | 0.60mi | 3/2.5 (-1) | 1,883 (-14%) | 6mo | $385,000 | $204 | 36 |
| 1846 Silver St | 0.73mi | 3/2.5 (-1) | 2,292 (+4%) | 19mo | $375,000 | $164 | 36 |
| 151 W 10th St | 0.75mi | 5/3.0 (+1) | 2,300 (+5%) | 21mo | $440,000 | $191 | 30 |
Match score weights: distance 35% · size 25% · config 20% · recency 20%. Top-matched comps best support the ARV.
Projected returns pro-forma
-3.0% appreciation · 1.81% rent growth · sell at horizon
- IRR
- -6.3%
- Equity multiple
- 0.77×
- Total profit
- $-11,707
- Equity at exit
- $26,839
- IRR
- 1.8%
- Equity multiple
- 1.12×
- Total profit
- $6,142
- Equity at exit
- $15,563
Cash invested: $50,400 (down + closing). Projections, not guarantees.
Landlord ↔ Tenant lean methodology
- Overall (STATE)
- 87 Strongly Landlord-Friendly
- State Florida
- 87 Strongly Landlord-Friendly · R+3
- County
- — inherits STATE
- City
- — inherits STATE
ZIP-level market 32209
- Home prices YoY
- -22.1%
- Rents YoY
- 1.8%
- Active inventory
- 394
- Price-to-rent
- 7.8×
Monthly cashflow live
- Estimated rent
- $1,913 high interval (Pro) →
- Mortgage (P&I)
- −$944
- Tax from tax record
- −$183 /mo · $2,193/yr
- Insurance
- −$75
- HOA
- −$0
- Vacancy / Maint / Mgmt
- −$402
- Net cashflow
- $310
Break-even live
UW: 25.0% down · 7.5% · 30yr · 1.5% tax · 5.0% vac · 8.0% maint · 8.0% mgmt
Financing live
Cash to close
- Down payment
- $45,000
- Closing costs
- $5,400
- Reserves months
- —
- Total cash needed
- —
Loan-product check · same deal, 3 products live
Conventional
25% down · 7.5% · 30yr
- Down + closing
- —
- Monthly P&I
- —
- Monthly cashflow
- —
- DSCR
- —
- Eligible?
- —
Personal DTI + credit; lowest rate.
DSCR
20% down · 8.5% · 30yr
- Down + closing
- —
- Monthly P&I
- —
- Monthly cashflow
- —
- DSCR
- —
- Eligible?
- —
No personal income docs; deal must DSCR.
Hard money
10% down · 12.0% · 12mo
- Down + closing
- —
- Monthly P&I
- —
- Monthly cashflow
- —
- DSCR
- —
- Eligible?
- —
Short-term bridge; refi at stabilization.
Rent comps 21 comps
| Address | Beds | Baths | Sqft | Rent | $/sqft | DOM | Units | Dist |
|---|---|---|---|---|---|---|---|---|
| 1029 W 25th St Unit 1 Jacksonville, FL | 5.0 | 2.0 | 1410 | $2,200 | $1.56 | 23d | 1 | 0.68mi |
| 1025 W 25th St Unit 1 Jacksonville, FL | 5.0 | 2.0 | 1500 | $2,000 | $1.33 | 23d | 1 | 0.68mi |
| 1511 W 15th St Jacksonville, FL | 5.0 | 3.0 | 1720 | $2,100 | $1.22 | 23d | 1 | 0.71mi |
| 1619 Whitner St Jacksonville, FL | 3.0 | 2.0 | 1547 | $1,150 | $0.74 | 1d | 1 | 0.74mi |
| 1931 Silver St Jacksonville, FL | 3.0 | 2.0 | 2132 | $2,600 | $1.22 | 23d | 1 | 0.75mi |
| 1514 Silver St Jacksonville, FL | 3.0 | 2.0 | 1726 | $2,275 | $1.32 | 23d | 1 | 0.85mi |
| 146 W 6th St Jacksonville, FL | 3.0 | 1.0 | 1600 | $1,475 | $0.92 | 19d | 1 | 0.86mi |
| 30 W 12th St Jacksonville, FL | 4.0 | 3.0 | 1792 | $2,580 | $1.44 | 1d | 1 | 0.86mi |
| 1288 W 28th St Jacksonville, FL | 4.0 | 1.5 | 1449 | $1,267 | $0.87 | 14d | 1 | 0.88mi |
| 421 Golfair Blvd Jacksonville, FL | 4.0 | 2.5 | 1761 | $1,381 | $0.78 | 16d | 1 | 1.00mi |
| 1708 W 24th St Jacksonville, FL | 3.0 | 2.0 | 1428 | $1,250 | $0.88 | 7d | 1 | 1.12mi |
| 1827 N Market St Jacksonville, FL | 5.0 | 3.5 | 2750 | $3,100 | $1.13 | 17d | 1 | 1.13mi |
| 26 W 27th St Jacksonville, FL | 3.0 | 2.0 | 1512 | $1,300 | $0.86 | 23d | 1 | 1.15mi |
| 1781 W 3rd St Jacksonville, FL | 4.0 | 2.0 | 1632 | $650 | $0.40 | 23d | 1 | 1.17mi |
| 1744 W 28th St Jacksonville, FL | 3.0 | 2.0 | 1556 | $1,750 | $1.12 | 23d | 1 | 1.27mi |
| 424 Walnut Ct Jacksonville, FL | 3.0 | 2.0 | 1530 | $1,688 | $1.10 | 14d | 1 | 1.35mi |
| 424 Walnut Ct Jacksonville, FL | 3.0 | 2.0 | 1530 | $1,688 | $1.10 | 14d | 1 | 1.35mi |
| 424 E 6th St Jacksonville, FL | 4.0 | 3.0 | 2746 | $2,895 | $1.05 | 23d | 1 | 1.39mi |
| 440 E 6th St Jacksonville, FL | 3.0 | 2.0 | 1968 | $2,100 | $1.07 | 23d | 1 | 1.41mi |
| 1943 Hardee St #1 Jacksonville, FL | 3.0 | 2.0 | 1622 | $1,248 | $0.77 | 4d | 1 | 1.48mi |
| 1445 Ionia St Jacksonville, FL | 4.0 | 2.0 | 1640 | $1,799 | $1.10 | 23d | 1 | 1.49mi |
Listing history 33 events
-
2026-06-18status $180,000 Pending 28 DOM
-
2026-06-18days on market $180,000 Active 28 DOM
-
2026-06-17days on market $180,000 Active 27 DOM
-
2026-06-16days on market $180,000 Active 26 DOM
-
2026-06-15days on market $180,000 Active 25 DOM
-
2026-06-13days on market $180,000 Active 23 DOM
-
2026-06-13days on market $180,000 Active 22 DOM
-
2026-06-10days on market $180,000 Active 19 DOM
-
2026-06-08days on market $180,000 Active 18 DOM
-
2026-06-07days on market $180,000 Active 17 DOM
-
2026-06-05days on market $180,000 Active 14 DOM
-
2026-06-03days on market $180,000 Active 13 DOM
-
2026-06-02days on market $180,000 Active 12 DOM
-
2026-06-01days on market $180,000 Active 11 DOM
-
2026-05-31days on market $180,000 Active 10 DOM
-
2026-05-21$180,000 Active
-
2018-12-10soldstatus $44,000 Sold 136-char remark
Show marketing remark (136 chars)
Almost 3000sf of living space plus the apartment in the back included for only 50k! Just need a some for to make it your! Sold 'AS IS'
-
2018-11-26status Pending 136-char remark
Show marketing remark (136 chars)
Almost 3000sf of living space plus the apartment in the back included for only 50k! Just need a some for to make it your! Sold 'AS IS'
-
2018-11-02price $44,900 136-char remark
Show marketing remark (136 chars)
Almost 3000sf of living space plus the apartment in the back included for only 50k! Just need a some for to make it your! Sold 'AS IS'
-
2018-10-22$49,900 Active 136-char remark
Show marketing remark (182 chars)
Home and the apartment in the back included Sold 'AS IS’ Buyer must verify all info including but not limited to HOA fees and TAXES. Seller will not pay for or provide survey.
-
2018-10-22historical 182-char remark
Show marketing remark (182 chars)
Home and the apartment in the back included Sold 'AS IS’ Buyer must verify all info including but not limited to HOA fees and TAXES. Seller will not pay for or provide survey.
-
2018-09-11status Active 182-char remark
Show marketing remark (182 chars)
Home and the apartment in the back included Sold 'AS IS’ Buyer must verify all info including but not limited to HOA fees and TAXES. Seller will not pay for or provide survey.
-
2018-06-28status Pending 182-char remark
Show marketing remark (182 chars)
Home and the apartment in the back included Sold 'AS IS’ Buyer must verify all info including but not limited to HOA fees and TAXES. Seller will not pay for or provide survey.
-
2018-06-07status Active - Auction 182-char remark
Show marketing remark (182 chars)
Home and the apartment in the back included Sold 'AS IS’ Buyer must verify all info including but not limited to HOA fees and TAXES. Seller will not pay for or provide survey.
-
2018-06-03historical Active - Contingent 182-char remark
Show marketing remark (182 chars)
Home and the apartment in the back included Sold 'AS IS’ Buyer must verify all info including but not limited to HOA fees and TAXES. Seller will not pay for or provide survey.
-
2018-03-13$49,900 Active 182-char remark
Show marketing remark (182 chars)
Home and the apartment in the back included Sold 'AS IS’ Buyer must verify all info including but not limited to HOA fees and TAXES. Seller will not pay for or provide survey.
-
2015-08-12soldstatus $35,000
-
2015-08-07soldstatus $25,000
-
2007-06-08soldstatus $54,000
-
2007-06-01historical
-
2007-05-25soldstatus $54,000
-
2007-01-22$59,900
-
1982-09-01soldstatus $24,500
ⓘ Source: listings_history table (triggers on properties + properties_extension) + one-shot
backfill from property_details.listing_events for pre-trigger history.
Tax reassessment forecast FL · Resets to sale price
- Current annual tax
- $2,193 · $183/mo
- Projected year-2 tax
- $2,193 · $183/mo
- Expected delta
- $0/yr ($0/mo · 0.0%)
ⓘ Screening estimate from a state-policy table — verify with the county assessor before closing.
Climate risk First Street
- Flood 1/10 Low FEMA zone X (unshaded) · 0% chance over 30 yrs
- Wildfire 1/10 Low
- Heat 9/10 Extreme 7 d/yr ≥107°F today · 20 d/yr by 30 yrs out
- Wind 9/10 Extreme 99% chance of damaging wind over 30 yrs
- Air quality 5/10 Major 7 unhealthy d/yr today · 7 by 30 yrs out
Nearby sold comps map
Loading sold comps map…
Walkable amenities ~0.75 mi
Loading nearby amenities…
Taxation est. · year 1
- Rental income
- $22,957
- − Mortgage interest
- −$10,083
- − Property taxes
- −$2,193
- − Insurance
- −$900
- − Repairs & maintenance
- −$1,837
- − Management
- −$1,837
- − Depreciation
- −$5,236
- Taxable income
- $872
- Est. tax owed @ 24.0%
- −$209
- After-tax cash flow
- $3,507/yr
For passive investors: Depreciation is non-cash, so a rental often shows a tax loss while cash-flowing — sheltering income. Rental losses are passive: they offset passive income freely, and up to $25,000/yr can offset ordinary (W-2) income if you actively participate and your MAGI is under $100k (phasing out to $0 by $150k); unused losses carry forward. On sale, claimed depreciation is recaptured at up to 25%, and gains may owe capital-gains tax (a 1031 exchange can defer both). Figures are a year-1 estimate at your 24.0% rate — not tax advice; consult a CPA.
Schools (NCES district)
- District
- Duval
- NCES district ID
- 1200480
- Math proficiency
- 46% ▼ -11.00%
- Reading proficiency
- 45% ▼ -4.00%
- Median HH income
- $48,987
- Composite
- 38.97/100
- National rank
- #4076
- State rank
- #48 of 73 in FL
Livability — Jacksonville
- Score
- 83/100
- State rank
- #50
- US rank
- #911
Category grades
Schools grade is shown separately in the Schools card above.
Census & demographics
- Census place
- Jacksonville, FL
- County
- Duval County · 1,015,274 people
- City population
- 979,034
- Metro
- Jacksonville, FL
- Population (ZIP)
- 34,657
- Household income
- $30,514
- Rent vs Own
- Severe rent burden
- 2921.0
Population outlook (Duval County) Hauer SSP2
- Today (2025)
- 1,013,010 people
- By 2030
- 1,059,228 · +4.6%
- By 2040
- 1,141,439 · +12.7%
- By 2050
- 1,205,258 · +19.0%
- By 2075
- 1,324,282 · +30.7%
- By 2100
- 1,319,620 · +30.3%
Race, ethnicity, and origin ACS 2023
- Neighborhood character
- Predominantly Black (88%)
- Race & ethnicity
- Black 88% White 5% Hispanic / Latino 5% Two or more races 2%
- Hispanic origin (detail)
- Puerto Rican 3%
- Common ancestry
- Hispanic 1% Romanian 1%
- Foreign-born
- 3% · Canada
- Languages at home
- 95% English-only · Spanish 4% French/Haitian/Cajun 1%
Political lean MEDSL · Duval
- 2024 margin
- Toss-up / Even · D 48.7% · R 50.1% · Other 1.2%
- 2008→2024 swing
- +0.4pp no change · 2008: -1.9pp · 2024: -1.5pp
- All cycles
- 2024: R+1.5 2020: D+3.8 2016: R+1.5 2012: R+3.6 2008: R+1.9
Not yet ingested
- Civics
- —
Market trends
- HPI YoY
- ▼ -53.92%
- Current HPI
- 189.5977
- Rent YoY
- ▲ 1.81%
- Metro
- Jacksonville, FL
- State GDP YoY
- ▲ 3.28%
- F500 in state
- 36
Industry mix (Fortune 500 HQ in FL)
| Industry | F500 HQs | Revenue |
|---|---|---|
| Industrial Technology | 2 | $29B |
|
||
| Insurance | 2 | $17B |
|
||
| Retail | 1 | $60B |
|
||
| Technology Distribution | 1 | $58B |
|
||
| Homebuilding | 1 | $35B |
|
||
| Technology Manufacturing | 1 | $35B |
|
||
Price history
+634.7% since first listed18 events — show timeline
- 2026-05-21 Listed $180,000 realMLS
- 2018-12-10 Sold (MLS) $44,000 realMLS
- 2018-11-26 Pending — realMLS
- 2018-11-02 Price Changed $44,900 realMLS
- 2018-10-22 Listing Removed — realMLS
- 2018-10-22 Listed $49,900 realMLS
- 2018-09-11 Relisted — realMLS
- 2018-06-28 Pending — realMLS
- 2018-06-07 Relisted — realMLS
- 2018-06-03 Contingent — realMLS
- 2018-03-13 Listed $49,900 realMLS
- 2015-08-12 Sold (Public Records) $35,000 Public Records
- 2015-08-07 Sold (Public Records) $25,000 Public Records
- 2007-06-08 Sold (Public Records) $54,000 Public Records
- 2007-06-01 Listing Removed — realMLS
- 2007-05-25 Sold (MLS) $54,000 realMLS
- 2007-01-22 Listed $59,900 realMLS
- 1982-09-01 Sold (Public Records) $24,500 Public Records
Property tax history
+5.3%/yrLatest (2025): $2,193 · +27.6% YoY. Source: county tax records.
Cash-flow waterfall
monthlySold comps — $/sqft
last 12 mo · ≤1 miLoading sold comps…