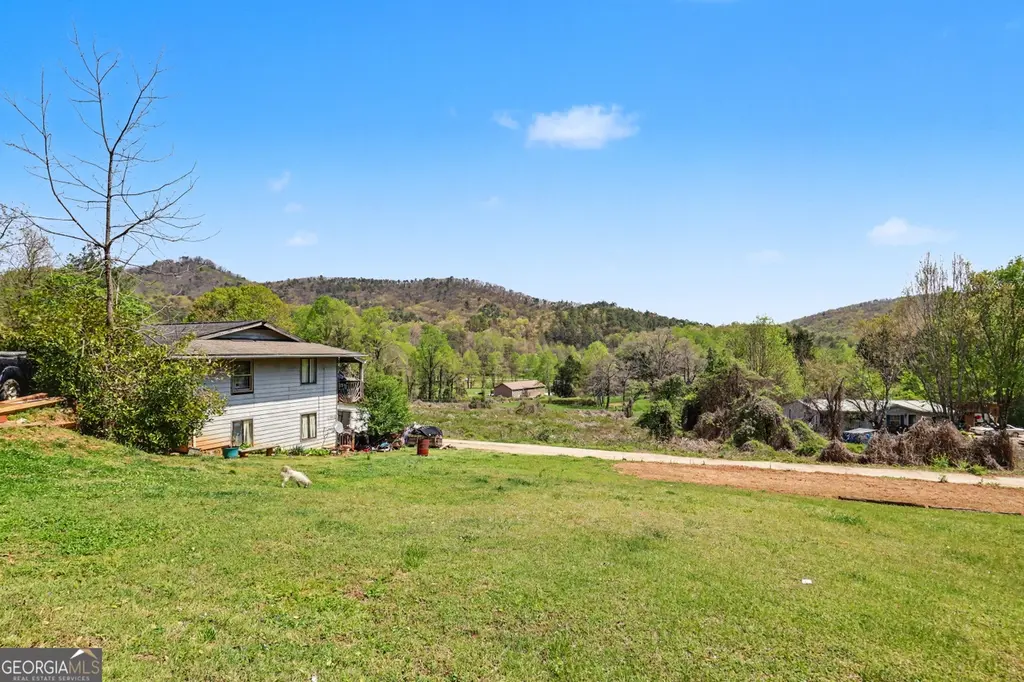
202 Old Screamer St · Clayton, GA
Flood risk 1/10 · Minimal
- FEMA flood zone
- X (unshaded)
- Chance of flooding over 30 yrs
- 0.0%
- Est. flood insurance / yr
- $507 – $1,088
Fire risk 4/10 · Minor
- Est. fire insurance / yr
- $963 – $1,789
Heat risk 4/10 · Minor
- Hot days now (above 99°F)
- 7 days/yr
- Hot days in 30 yrs
- 19 days/yr
Wind risk 2/10 · Minimal
- Chance of severe wind over 30 yrs
- —
Air-quality risk 4/10 · Minor
- Unhealthy air days now
- 6 days/yr
- Unhealthy air days in 30 yrs
- 6 days/yr
Risk factors via First Street. Map © Google.
Why this score? — see what drove the A- grade
The composite is a weighted blend of 9 inputs, each scored 0–100. Each bar is that input's sub-score; the figure is the points it added to the 100-point composite (weight × sub-score).
- Cash flow +30.0/30.0
- ARV discount +15.0/15.0
- 1% rule +10.0/10.0
- DSCR +10.0/10.0
- Appreciation +5.3/10.0
- Schools +3.6/10.0
- Livability +3.3/5.0
- Rent growth +2.5/5.0
- Condition / age +2.5/5.0
$180,900
🖨 Deal sheet (PDF) 📄 Offer letter ✓ Due diligence
Listing remarks MLS
Charming home nestled in this Clayton neighborhood. This property features spacious living areas with natural light, a cozy kitchen, and a delightful backyard appropriate for relaxation. Enjoy the beautiful surroundings. Don't miss this opportunity to own a piece of tranquility. Beautiful mountain view. Some work is needed.
Key facts
- Cozy kitchen
- Delightful backyard
- Mountain view
Tags
Neighborhood map
What this means for you Summary
Snapshot
- This is a 3-bed/2.5-bath single-family listed at $181k.
Deal economics
- At list price, monthly cash flow is $1k ($13k/yr) — positive.
- The deal already cash-flows at list — no discount required.
- Meets the 1% rule at list price ($3k rent vs $181k).
- Recommended offer: $175k (3.0% below list) — sets the bar for market timing.
- Cap rate 13.5% vs local median 3.6% in Clayton — top-decile yield for the area; either an underpriced asset or a hidden risk that comps aren't pricing in. Stress-test before assuming the spread holds.
Location & tenants
- Location reads 66/100 on livability (#197 in GA) — a middle-class / working-renter tenant base. Strengths: cost of living A+, health & safety A+, housing B+; Watch: crime D, amenities F, commute F.
- Rabun County (rural): math 42% / reading 44% proficiency, ranked #37 of 174 in GA (top 21%) — families likely to look elsewhere, expect single-tenant / working-renter base with shorter leases.
- Zoned schools: Rabun County Elementary School (math 37% / reading 42%, grade F, #435 of 1,228 statewide, top 37%, 660 students, 58% FRL); Rabun County Middle School (math 47% / reading 46%, grade D+, #94 of 470 statewide, top 20%, 342 students, 59% FRL); Rabun County High School (math 57% / reading 47%, grade D+, #26 of 424 statewide, top 6%, 653 students, 48% FRL) — zoned schools at 55% FRL track the district average.
- Market conditions: 264 active listings in the ZIP; 3 comparable units currently listed for rent nearby; rentals at typical pace (median 26d on market — plan ~3-4 weeks tenant-placement turnaround); 147 units permitted in Rabun County in 2024 (0 in 5+ unit buildings).
Forward outlook
- In year one you build about $2k of equity ($1k loan paydown + $1k appreciation (0.7% local appreciation)).
- Rabun County population projected at -14% by 2050 — secular population decline; favor cash flow + early exit over multi-decade hold.
- At projected returns (0.7% appreciation + 3.0% rent growth), your $51k cash investment doubles in ~4 years — after that, you're playing with house money.
Negotiation context
- It's been on market 35 days — a 3% lower offer ($175k) is reasonable based on typical stale-listing flexibility.
Questions for the listing agent
- It's been on market 35 days. Have you received any prior offers? Is the seller open to a 3% concession, seller financing, or rate buy-down credit?
- Is there a deadline driving the sale (1031 exchange, divorce, estate, relocation)? That informs how much negotiation room exists.
- Schools are F-rated, which usually means shorter tenancies and higher turnover. Who's the typical renter profile here, and what's been the actual vacancy rate?
- Crime grade is D in this area — have there been break-ins, vandalism, or insurance claims at this property in the last 3 years? What carrier currently insures it and at what premium?
- What's the average days-on-market for RENTAL listings here right now (not sales)? A rising rental-DOM trend means longer vacancies and softer asking-rent achievability than the comps imply.
- What's the recent tenant-quality profile in this submarket — average credit score on applications, eviction rate, late-payment / NSF rate, and stable-employment percentage? A property-management company in the area should have these aggregated.
- How much new for-sale + rental construction is in the pipeline within 1–3 miles? Heavy new supply typically softens prices + rents 12–24 months out; constrained supply supports both.
Investment metrics
- 1% rule
- 1.54% ✓
- Cap rate
- 13.54%
- Cash-on-cash
- 25.90%
- DSCR
- 2.15
- GRM
- 5.4
CMA / ARV
- ARV (median comp)
- $360,258
- List price
- $180,900
- Delta
- -49.79%
- Verdict
- UNDERPRICED
- Comps
- 20 within 1.0 mi
Show comp detail 8 sales within ~0.75 mi
| Address | Dist | Beds/Ba | Sqft | Sold | Price | $/sf | Match |
|---|---|---|---|---|---|---|---|
| 41 Mike Foster Ln | 0.46mi | 4/2.5 (+1) | 1,728 (-2%) | 4mo | $250,000 | $145 | 67 |
| 49 Toole St | 0.61mi | 4/2.0 (+1) | 1,728 (-2%) | 7mo | $397,000 | $230 | 55 |
| 190 Merrydale Ln | 0.39mi | 3/2.5 | 1,672 (-5%) | 22mo | $230,000 | $138 | 55 |
| 331 Duggan Hill Dr | 0.57mi | 3/2.0 | 1,598 (-9%) | 6mo | $250,000 | $156 | 50 |
| 633 Highway 441 | 0.33mi | 3/2.0 | 1,600 (-9%) | 20mo | $410,000 | $256 | 50 |
| 114 Chechero Valley Ln | 0.50mi | 3/2.5 | 1,952 (+11%) | 18mo | $465,000 | $238 | 43 |
| 823 Old 441 S | 0.68mi | 3/3.0 | 1,900 (+8%) | 14mo | $273,500 | $144 | 41 |
| 345 Leaning Chimney Dr | 0.73mi | 3/2.0 | 1,581 (-10%) | 11mo | $440,000 | $278 | 38 |
Match score weights: distance 35% · size 25% · config 20% · recency 20%. Top-matched comps best support the ARV.
Projected returns pro-forma
0.68% appreciation · 3.0% rent growth · sell at horizon
- IRR
- 27.5%
- Equity multiple
- 2.38×
- Total profit
- $70,124
- Equity at exit
- $58,739
- IRR
- 30.5%
- Equity multiple
- 4.57×
- Total profit
- $181,067
- Equity at exit
- $75,777
Cash invested: $50,652 (down + closing). Projections, not guarantees.
Landlord ↔ Tenant lean methodology
- Overall (STATE)
- 90 Strongly Landlord-Friendly
- State Georgia
- 90 Strongly Landlord-Friendly · R+3
- County
- — inherits STATE
- City
- — inherits STATE
ZIP-level market 30525
- Home prices YoY
- 0.2%
- Active inventory
- 264
- Price-to-rent
- 5.4×
Monthly cashflow live
- Estimated rent
- $2,795 medium interval (Pro) →
- Mortgage (P&I)
- −$949
- Tax from tax record
- −$91 /mo · $1,090/yr
- Insurance
- −$75
- HOA
- −$0
- Vacancy / Maint / Mgmt
- −$587
- Net cashflow
- $1,093
Break-even live
Sensitivity live
| Price | -10% $1,195 | -5% $1,144 | +0% $1,093 | +5% $1,042 | +10% $991 |
|---|---|---|---|---|---|
| Rent | -10% $872 | -5% $983 | +0% $1,093 | +5% $1,203 | +10% $1,314 |
| Rate | -1.0pp $1,184 | -0.5pp $1,139 | base $1,093 | +0.5pp $1,046 | +1.0pp $999 |
UW: 25.0% down · 7.5% · 30yr · 1.5% tax · 5.0% vac · 8.0% maint · 8.0% mgmt
Financing live
Cash to close
- Down payment
- $45,225
- Closing costs
- $5,427
- Reserves months
- —
- Total cash needed
- —
Loan-product check · same deal, 3 products live
Conventional
25% down · 7.5% · 30yr
- Down + closing
- —
- Monthly P&I
- —
- Monthly cashflow
- —
- DSCR
- —
- Eligible?
- —
Personal DTI + credit; lowest rate.
DSCR
20% down · 8.5% · 30yr
- Down + closing
- —
- Monthly P&I
- —
- Monthly cashflow
- —
- DSCR
- —
- Eligible?
- —
No personal income docs; deal must DSCR.
Hard money
10% down · 12.0% · 12mo
- Down + closing
- —
- Monthly P&I
- —
- Monthly cashflow
- —
- DSCR
- —
- Eligible?
- —
Short-term bridge; refi at stabilization.
Rent comps 3 comps
| Address | Beds | Baths | Sqft | Rent | $/sqft | DOM | Units | Dist |
|---|---|---|---|---|---|---|---|---|
| 38 Bulldog Ln Clayton, GA | 2.0 | 2.0 | 2030 | $2,500 | $1.23 | 25d | 1 | 0.29mi |
| 122 Cannon St Clayton, GA | 3.0 | 2.0 | 1650 | $3,250 | $1.97 | 16d | 1 | 1.18mi |
| 233 Orchid Trl Clayton, GA | 3.0 | 2.0 | 1920 | $3,500 | $1.82 | 25d | 1 | 1.25mi |
Listing history 4 events
-
2026-05-18status Under Contract 325-char remark
Show marketing remark (325 chars)
Charming home nestled in this Clayton neighborhood. This property features spacious living areas with natural light, a cozy kitchen, and a delightful backyard appropriate for relaxation. Enjoy the beautiful surroundings. Don't miss this opportunity to own a piece of tranquility. Beautiful mountain view. Some work is needed.
-
2026-04-17price $180,900 325-char remark
Show marketing remark (325 chars)
Charming home nestled in this Clayton neighborhood. This property features spacious living areas with natural light, a cozy kitchen, and a delightful backyard appropriate for relaxation. Enjoy the beautiful surroundings. Don't miss this opportunity to own a piece of tranquility. Beautiful mountain view. Some work is needed.
-
2026-04-13price $199,900 325-char remark
Show marketing remark (325 chars)
Charming home nestled in this Clayton neighborhood. This property features spacious living areas with natural light, a cozy kitchen, and a delightful backyard appropriate for relaxation. Enjoy the beautiful surroundings. Don't miss this opportunity to own a piece of tranquility. Beautiful mountain view. Some work is needed.
-
2026-04-13$249,900 New 325-char remark
Show marketing remark (325 chars)
Charming home nestled in this Clayton neighborhood. This property features spacious living areas with natural light, a cozy kitchen, and a delightful backyard appropriate for relaxation. Enjoy the beautiful surroundings. Don't miss this opportunity to own a piece of tranquility. Beautiful mountain view. Some work is needed.
ⓘ Source: listings_history table (triggers on properties + properties_extension) + one-shot
backfill from property_details.listing_events for pre-trigger history.
Tax reassessment forecast GA · Resets to sale price
- Current annual tax
- $1,090 · $91/mo
- Projected year-2 tax
- $1,664 · $139/mo
- Expected delta
- +$575/yr (+$48/mo · 52.7%)
ⓘ Screening estimate from a state-policy table — verify with the county assessor before closing.
Climate risk First Street
- Flood 1/10 Low FEMA zone X (unshaded) · 0% chance over 30 yrs
- Wildfire 4/10 Moderate
- Heat 4/10 Moderate 7 d/yr ≥99°F today · 19 d/yr by 30 yrs out
- Wind 2/10 Low
- Air quality 4/10 Moderate 6 unhealthy d/yr today · 6 by 30 yrs out
Nearby sold comps map
Loading sold comps map…
Walkable amenities ~0.75 mi
Loading nearby amenities…
Taxation est. · year 1
- Rental income
- $33,538
- − Mortgage interest
- −$10,133
- − Property taxes
- −$1,090
- − Insurance
- −$904
- − Repairs & maintenance
- −$2,683
- − Management
- −$2,683
- − Depreciation
- −$5,263
- Taxable income
- $10,782
- Est. tax owed @ 24.0%
- −$2,588
- After-tax cash flow
- $10,529/yr
For passive investors: Depreciation is non-cash, so a rental often shows a tax loss while cash-flowing — sheltering income. Rental losses are passive: they offset passive income freely, and up to $25,000/yr can offset ordinary (W-2) income if you actively participate and your MAGI is under $100k (phasing out to $0 by $150k); unused losses carry forward. On sale, claimed depreciation is recaptured at up to 25%, and gains may owe capital-gains tax (a 1031 exchange can defer both). Figures are a year-1 estimate at your 24.0% rate — not tax advice; consult a CPA.
Schools (NCES district)
- District
- Rabun County
- NCES district ID
- 1304320
- Math proficiency
- 42% ▼ -17.00%
- Reading proficiency
- 44% ▼ -4.00%
- Median HH income
- $35,980
- Composite
- 35.64/100
- National rank
- #4882
- State rank
- #37 of 174 in GA
Livability — Clayton
- Score
- 66/100
- State rank
- #197
- US rank
- #12208
Category grades
Schools grade is shown separately in the Schools card above.
Census & demographics
- Census place
- Clayton, GA
- Population (ZIP)
- 7,265
Population outlook (Rabun County) Hauer SSP2
- Today (2025)
- 16,227 people
- By 2030
- 16,000 · -1.4%
- By 2040
- 15,213 · -6.2%
- By 2050
- 13,974 · -13.9%
- By 2075
- 10,717 · -34.0%
- By 2100
- 7,824 · -51.8%
Race, ethnicity, and origin ACS 2023
- Neighborhood character
- Predominantly White (88%)
- Race & ethnicity
- White 88% Hispanic / Latino 8% Two or more races 8%
- Hispanic origin (detail)
- Mexican 7%
- Common ancestry
- Serbian 4% Slovak 3% Romanian 2%
- Foreign-born
- 5% · Canada
- Languages at home
- 91% English-only · Spanish 8% Other Indo-European 1%
Political lean MEDSL · Rabun
- 2024 margin
- Solid R (+56.9) · D 21.3% · R 78.2%
- 2008→2024 swing
- -11.0pp toward R · 2008: -45.9pp · 2024: -56.9pp
- All cycles
- 2024: R+56.9 2020: R+57.4 2016: R+60.9 2012: R+56.4 2008: R+45.9
Not yet ingested
- Civics
- —
Market trends
- HPI YoY
- ▲ 0.68%
- Current HPI
- 310.5456
- Rent YoY
- —
- Metro
- —
- State GDP YoY
- ▲ 2.66%
- F500 in state
- 28
Industry mix (Fortune 500 HQ in GA)
| Industry | F500 HQs | Revenue |
|---|---|---|
| Paper / Packaging | 2 | $29B |
|
||
| Retail | 1 | $160B |
|
||
| Transportation / Logistics | 1 | $91B |
|
||
| Airlines | 1 | $62B |
|
||
| Consumer Goods | 1 | $47B |
|
||
| Utilities | 1 | $25B |
|
||
Price history
-27.6% since first listed4 events — show timeline
- 2026-05-18 Pending — GAMLS
- 2026-04-17 Price Changed $180,900 GAMLS
- 2026-04-13 Price Changed $199,900 GAMLS
- 2026-04-13 Listed $249,900 GAMLS
Property tax history
+0.8%/yrLatest (2025): $1,090 · +1.3% YoY. Source: county tax records.
Cash-flow waterfall
monthlySold comps — $/sqft
last 12 mo · ≤1 miLoading sold comps…