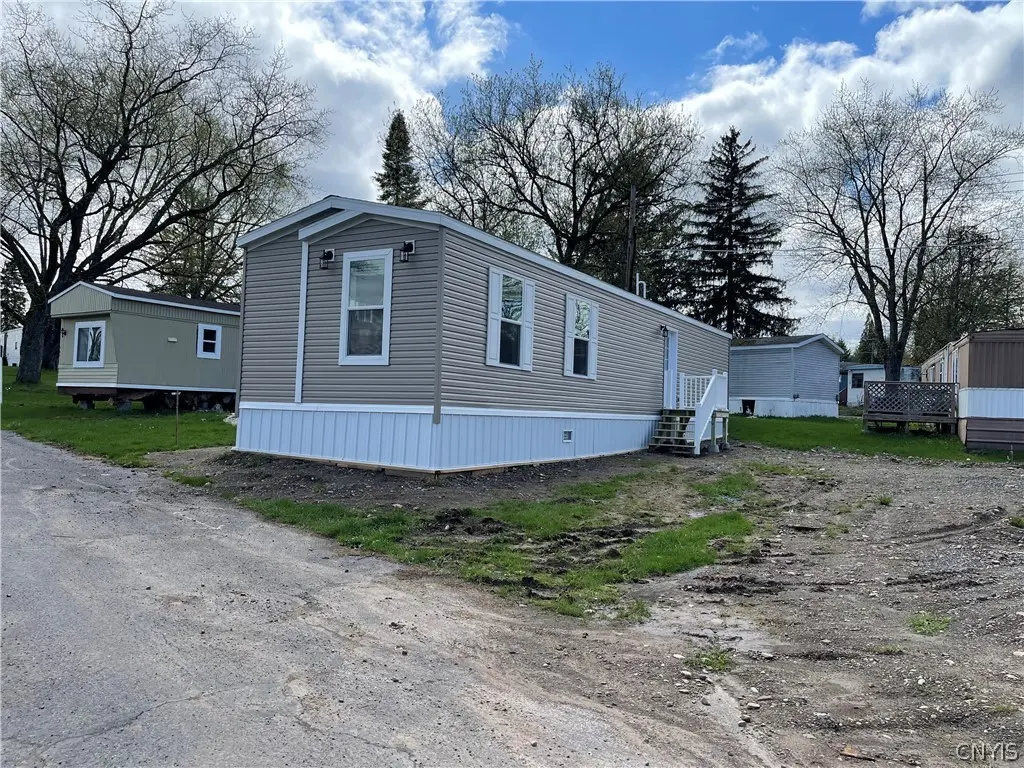
lot 310 Rolling Hill Mobile Home Park Ny-5 · Jordan, NY
Flood risk 1/10 · Minimal
- FEMA flood zone
- X (unshaded)
- Chance of flooding over 30 yrs
- 0.0%
- Est. flood insurance / yr
- $473 – $860
Fire risk 3/10 · Minor
- Est. fire insurance / yr
- $691 – $1,283
Heat risk 2/10 · Minimal
- Hot days now (above 96°F)
- 7 days/yr
- Hot days in 30 yrs
- 15 days/yr
Wind risk 1/10 · Minimal
- Chance of severe wind over 30 yrs
- 1.0%
Air-quality risk 2/10 · Minimal
- Unhealthy air days now
- 1 days/yr
- Unhealthy air days in 30 yrs
- 1 days/yr
Risk factors via First Street. Map © Google.
Why this score? — see what drove the B grade
The composite is a weighted blend of 9 inputs, each scored 0–100. Each bar is that input's sub-score; the figure is the points it added to the 100-point composite (weight × sub-score).
- Cash flow +25.0/30.0
- Appreciation +8.4/10.0
- DSCR +8.2/10.0
- ARV discount +7.5/15.0
- 1% rule +6.5/10.0
- Condition / age +5.0/5.0
- Schools +4.9/10.0
- Livability +3.4/5.0
- Rent growth +2.5/5.0
$85,000
🖨 Deal sheet 📄 Offer letter ✓ Due diligence
Listing remarks
Welcome to easy, modern living in this brand-new 2025 single-wide mobile home, perfectly situated in a well-maintained community setting. This thoughtfully designed two-bedroom, one-bath home offers the ideal combination of comfort, efficiency, and contemporary style—perfect for anyone seeking low-maintenance living without sacrificing quality. Step inside and immediately appreciate the fresh, bright interior featuring a clean, modern aesthetic. Every detail is brand new—from the flooring and fixtures to the appliances and mechanical systems—giving you peace of mind and a truly move-in-ready experience. The open-concept layout seamlessly connects the living room and kitche
Key facts
- Ample cabinetry
- Brand-new appliances
- Open-concept layout
Tags
Property features AI
Finance
- Financial info: Land lease payment $530
- HOA & community: Has land lease
Exterior
- Parking: No garage (1 garage space indicated)
- Utilities: Water connected (public); Septic tank
- Home design: Single-wide mobile home; Single-story
- Construction: Vinyl siding; Block foundation; Attic/crawl hatchway(s) insulated; Existing construction
- Exterior features: Gravel driveway; Rectangular lot
Interior
- Kitchen: Dishwasher; Gas cooktop; Refrigerator
- Bedrooms: 2 main-level bedrooms
- Flooring: Laminate; Vinyl; Varies
- Bathrooms: 1 full bathroom (main level)
- Heating & cooling: Gas forced-air heating
- Interior features: Great room; Kitchen/family room combo; Living/dining room; Main-level primary
- Laundry & utility: Laundry on main level
Neighborhood map
What this means for you Summary
Snapshot
- This is a 2-bed/1.0-bath manufactured listed at $85k. Condition is rated excellent.
Deal economics
- At list price, monthly cash flow is $186 ($2k/yr) — positive.
- The deal already cash-flows at list — no discount required.
- Meets the 1% rule at list price ($979 rent vs $85k).
- Recommended offer: $84k (1.5% below list) — sets the bar for market timing.
- Cap rate 8.9% vs local median 1.1% in Jordan — top-decile yield for the area; either an underpriced asset or a hidden risk that comps aren't pricing in. Stress-test before assuming the spread holds.
Location & tenants
- Location reads 67/100 on livability (#581 in NY) — a middle-class / working-renter tenant base. Strengths: cost of living A+, housing A+, crime A-; Watch: amenities F, commute F, health & safety D-.
- Jordan-Elbridge Central School District (rural): math 57% / reading 57% proficiency, ranked #277 of 590 in NY (top 47%) — acceptable for families but not a draw, mixed tenant base, ~2y average lease.
- Market conditions: 9 active listings in the ZIP; 616 units permitted in Onondaga County in 2024 (256 in 5+ unit buildings).
Forward outlook
- In year one you build about $6k of equity ($588 loan paydown + $6k appreciation (6.8% local appreciation)).
- Onondaga County population projected to shrink 9% by 2050 — rents likely to lag national; underwrite the cash flow, not the appreciation.
- At projected returns (6.8% appreciation + 3.0% rent growth), your $24k cash investment doubles in ~3 years — after that, you're playing with house money.
- By year 6, paydown + projected appreciation supports a ~$35k cash-out refi (75% LTV) — recoverable capital for the next deal without selling this one.
Negotiation context
- It's been on market 22 days — a 2% lower offer ($84k) is reasonable based on typical stale-listing flexibility.
- 2 sale attempts with the ask held roughly flat each time — persistent listings suggest the price (not the market) is what's stuck; bring a comps-based counter.
Questions for the listing agent
- Is there a deadline driving the sale (1031 exchange, divorce, estate, relocation)? That informs how much negotiation room exists.
- Schools are B-rated — typically a magnet for longer-tenancy family renters. What's the average tenant stay here, and is there a school-zone premium baked into asking?
- What's the average days-on-market for RENTAL listings here right now (not sales)? A rising rental-DOM trend means longer vacancies and softer asking-rent achievability than the comps imply.
- What's the recent tenant-quality profile in this submarket — average credit score on applications, eviction rate, late-payment / NSF rate, and stable-employment percentage? A property-management company in the area should have these aggregated.
- How much new for-sale + rental construction is in the pipeline within 1–3 miles? Heavy new supply typically softens prices + rents 12–24 months out; constrained supply supports both.
Investment metrics
- 1% rule
- 1.15% ✓
- Cap rate
- 8.92%
- Cash-on-cash
- 9.37%
- DSCR
- 1.42
- GRM
- 7.2
CMA / ARV
No comps found within radius.
Projected returns pro-forma
6.81% appreciation · 3.0% rent growth · sell at horizon
- IRR
- 24.8%
- Equity multiple
- 2.70×
- Total profit
- $40,549
- Equity at exit
- $57,855
- IRR
- 23.0%
- Equity multiple
- 5.59×
- Total profit
- $109,145
- Equity at exit
- $108,961
Cash invested: $23,800 (down + closing). Projections, not guarantees.
Landlord ↔ Tenant lean methodology
- Overall (STATE)
- 15 Strongly Tenant-Friendly
- State New York
- 15 Strongly Tenant-Friendly · D+10
- County
- — inherits STATE
- City
- — inherits STATE
ZIP-level market 13060
- Home prices YoY
- 2.4%
- Active inventory
- 9
- Price-to-rent
- 7.2×
Monthly cashflow live
- Estimated rent
- $979 medium interval (Pro) →
- Mortgage (P&I)
- −$446
- Tax est. 1.5%
- −$106 /mo · $1,275/yr
- Insurance
- −$35
- HOA
- −$0
- Vacancy / Maint / Mgmt
- −$206
- Net cashflow
- $186
Break-even live
UW: 25.0% down · 7.5% · 30yr · 1.5% tax · 5.0% vac · 8.0% maint · 8.0% mgmt
Financing live
Cash to close
- Down payment
- $21,250
- Closing costs
- $2,550
- Reserves months
- —
- Total cash needed
- —
Loan-product check · same deal, 3 products live
Conventional
25% down · 7.5% · 30yr
- Down + closing
- —
- Monthly P&I
- —
- Monthly cashflow
- —
- DSCR
- —
- Eligible?
- —
Personal DTI + credit; lowest rate.
DSCR
20% down · 8.5% · 30yr
- Down + closing
- —
- Monthly P&I
- —
- Monthly cashflow
- —
- DSCR
- —
- Eligible?
- —
No personal income docs; deal must DSCR.
Hard money
10% down · 12.0% · 12mo
- Down + closing
- —
- Monthly P&I
- —
- Monthly cashflow
- —
- DSCR
- —
- Eligible?
- —
Short-term bridge; refi at stabilization.
Listing history 13 events
-
2026-06-18days on market $85,000 Active 22 DOM
-
2026-06-17days on market $85,000 Active 21 DOM
-
2026-06-16days on market $85,000 Active 20 DOM
-
2026-06-15days on market $85,000 Active 19 DOM
-
2026-06-14days on market $85,000 Active 17 DOM
-
2026-06-13days on market $85,000 Active 16 DOM
-
2026-06-10days on market $85,000 Active 14 DOM
-
2026-06-09days on market $85,000 Active 13 DOM
-
2026-06-08days on market $85,000 Active 12 DOM
-
2026-06-07days on market $85,000 Active 11 DOM
-
2026-06-05days on market $85,000 Active 8 DOM
-
2026-06-03remarks 681-char remark
-
2026-06-03$85,000 Active 7 DOM
ⓘ Source: listings_history table (triggers on properties + properties_extension) + one-shot
backfill from property_details.listing_events for pre-trigger history.
Climate risk First Street
- Flood 1/10 Low FEMA zone X (unshaded) · 0% chance over 30 yrs
- Wildfire 3/10 Moderate
- Heat 2/10 Low 7 d/yr ≥96°F today · 15 d/yr by 30 yrs out
- Wind 1/10 Low 100% chance of damaging wind over 30 yrs
- Air quality 2/10 Low 1 unhealthy d/yr today · 1 by 30 yrs out
Nearby sold comps map
Loading sold comps map…
Walkable amenities ~0.75 mi
Loading nearby amenities…
Taxation est. · year 1
- Rental income
- $11,746
- − Mortgage interest
- −$4,761
- − Property taxes
- −$1,275
- − Insurance
- −$425
- − Repairs & maintenance
- −$940
- − Management
- −$940
- − Depreciation
- −$2,473
- Taxable income
- $933
- Est. tax owed @ 24.0%
- −$224
- After-tax cash flow
- $2,007/yr
For passive investors: Depreciation is non-cash, so a rental often shows a tax loss while cash-flowing — sheltering income. Rental losses are passive: they offset passive income freely, and up to $25,000/yr can offset ordinary (W-2) income if you actively participate and your MAGI is under $100k (phasing out to $0 by $150k); unused losses carry forward. On sale, claimed depreciation is recaptured at up to 25%, and gains may owe capital-gains tax (a 1031 exchange can defer both). Figures are a year-1 estimate at your 24.0% rate — not tax advice; consult a CPA.
Condition & rehab AI · 2 photos
This brand-new 2025 single-wide mobile home is move-in ready with no visible wear or damage, making it an excellent investment.
Schools (NCES district)
- District
- Jordan-Elbridge Central School District
- NCES district ID
- 3615990
- Math proficiency
- 57% ▲ 4.00%
- Reading proficiency
- 57% ▲ 8.00%
- Median HH income
- $55,408
- Composite
- 49.11/100
- National rank
- #2049
- State rank
- #277 of 590 in NY
Livability — Jordan
- Score
- 67/100
- State rank
- #581
- US rank
- #10506
Category grades
Schools grade is shown separately in the Schools card above.
Census & demographics
- Population (ZIP)
- 2,845
Population outlook (Onondaga County) Hauer SSP2
- Today (2025)
- 467,894 people
- By 2030
- 463,381 · -1.0%
- By 2040
- 447,697 · -4.3%
- By 2050
- 426,399 · -8.9%
- By 2075
- 373,661 · -20.1%
- By 2100
- 307,967 · -34.2%
Race, ethnicity, and origin ACS 2023
- Neighborhood character
- Predominantly White (90%)
- Race & ethnicity
- White 90% Two or more races 8% Hispanic / Latino 2%
- Common ancestry
- Romanian 8% Slovak 5% Lithuanian 3%
- Foreign-born
- 1% · Canada
- Languages at home
- 99% English-only · Spanish 1%
Political lean MEDSL · Onondaga
- 2024 margin
- D (+17.3) · D 58.6% · R 41.4%
- 2008→2024 swing
- -3.0pp toward R · 2008: 20.3pp · 2024: 17.3pp
- All cycles
- 2024: D+17.3 2020: D+20.6 2016: D+12.8 2012: D+21.1 2008: D+20.3
Not yet ingested
- Civics
- —
Market trends
- HPI YoY
- ▲ 6.81%
- Current HPI
- 296.1607
- Rent YoY
- —
- Metro
- —
- State GDP YoY
- ▲ 2.60%
- F500 in state
- 92
Industry mix (Fortune 500 HQ in NY)
| Industry | F500 HQs | Revenue |
|---|---|---|
| Financial Services | 10 | $950B |
|
||
| Consumer Goods | 9 | $162B |
|
||
| Insurance | 4 | $225B |
|
||
| Telecommunications | 2 | $144B |
|
||
| Pharmaceuticals | 2 | $112B |
|
||
| Media / Entertainment | 2 | $69B |
|
||
Price history
2 events — show timeline
- 2026-06-03 Relisted — CNYIS
- 2026-04-24 Listed $85,000 CNYIS
Cash-flow waterfall
monthlySold comps — $/sqft
last 12 mo · ≤1 miLoading sold comps…