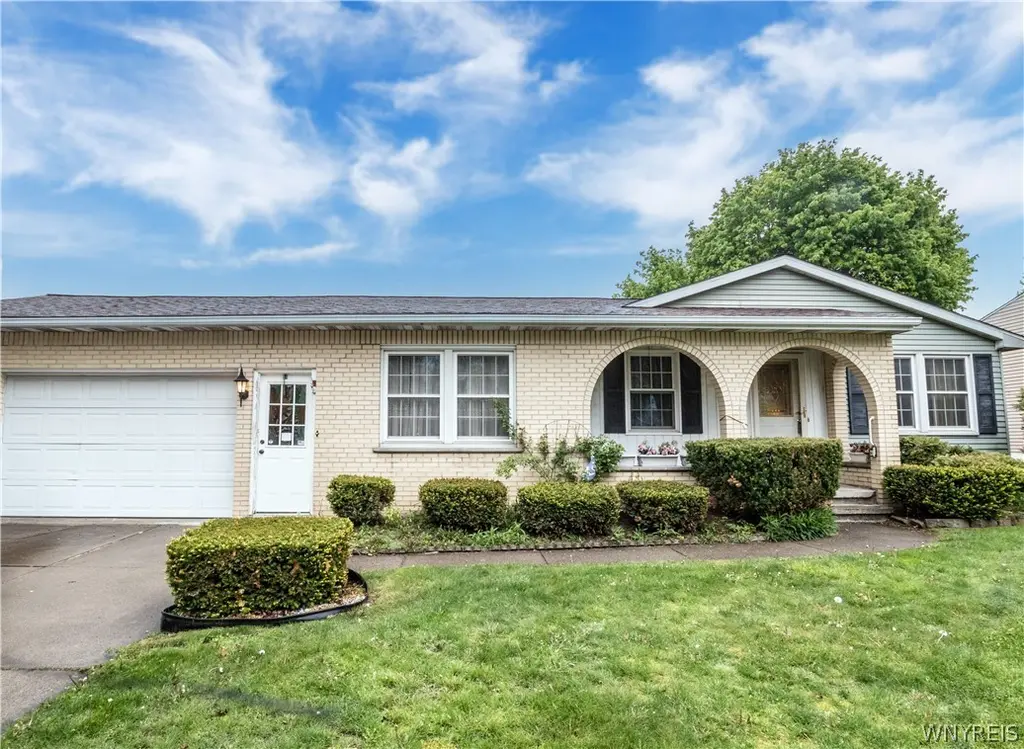
1367 Vanderbilt Ave · North Tonawanda, NY
Flood risk 3/10 · Minor
- FEMA flood zone
- X (unshaded)
- Chance of flooding over 30 yrs
- 0.2%
- Est. flood insurance / yr
- $473 – $860
Fire risk 1/10 · Minimal
- Est. fire insurance / yr
- $691 – $1,283
Heat risk 2/10 · Minimal
- Hot days now (above 94°F)
- 7 days/yr
- Hot days in 30 yrs
- 15 days/yr
Wind risk 1/10 · Minimal
- Chance of severe wind over 30 yrs
- —
Air-quality risk 3/10 · Minor
- Unhealthy air days now
- 2 days/yr
- Unhealthy air days in 30 yrs
- 4 days/yr
Risk factors via First Street. Map © Google.
Why this score? — see what drove the D grade
The composite is a weighted blend of 9 inputs, each scored 0–100. Each bar is that input's sub-score; the figure is the points it added to the 100-point composite (weight × sub-score).
- ARV discount +15.0/15.0
- Cash flow +8.1/30.0
- Schools +4.2/10.0
- Livability +4.2/5.0
- Rent growth +4.0/5.0
- 1% rule +2.7/10.0
- Condition / age +2.5/5.0
- DSCR +2.1/10.0
- Appreciation +0.0/10.0
$223,900
🖨 Deal sheet (PDF) 📄 Offer letter ✓ Due diligence
Listing remarks
Welcome home to this spacious three-bedroom, two full bath ranch offering the perfect blend of comfort, functionality, and outdoor entertaining! Enjoy summer days in the beautiful inground pool featuring resurfacing and updated pool mechanics all completed within the last five years. Pool has been professional opened and closed. Relax under the covered outdoor porch overlooking the backyard oasis, creating the perfect space for gatherings or quiet evenings at home. Inside, you’ll find a large eat-in kitchen with plenty of room for cooking and entertaining, along with both a welcoming family room and separate living room offering flexible living space for everyone. Three generously siz
Key facts
- Large eat-in kitchen
- Full basement
- Inground pool
Tags
Property features AI
Exterior
- Parking: Attached garage with electricity; Approximately 2 to 3 garage spaces (listed as 2.5)
- Utilities: Electricity connected with circuit breakers; High-speed internet available; Public water connected; Sewer connected
- Home design: Single-story home; Resale property; Asphalt roof; Brick and vinyl siding exterior; City street frontage; Rectangular residential lot near public transit (70 x 120)
- Construction: Built existing (year built not specified); Poured foundation
- Exterior features: Concrete driveway; Shed(s) / storage
Interior
- Kitchen: Dishwasher; Free-standing range; Microwave; Oven; Refrigerator
- Bedrooms: Three main-level bedrooms; Primary and additional bedrooms located on the first level
- Flooring: Carpet; Vinyl; Varied flooring
- Bathrooms: Two full bathrooms; One main-level bathroom
- Heating & cooling: Gas forced air heating; Central air conditioning
- Interior features: Eat-in kitchen; Pantry; Window treatments; Drapes; Main level primary bedroom
- Laundry & utility: Laundry in basement; Gas water heater
Neighborhood map
What this means for you Summary
Snapshot
- This is a 3-bed/1.0-bath single-family listed at $224k.
Deal economics
- At list price, monthly cash flow is $-222 ($-3k/yr) — negative.
- To cash-flow at today's rent, offer at most $185k (17.5% below list).
- To meet the 1% rule (rent ≥ 1% of price), the offer needs to be $172k (23.0% below list).
- Recommended offer: $172k (23.0% below list) — sets the bar for 1% rule.
- Cap rate 5.1% vs local median 4.0% in North Tonawanda — meaningfully above typical; check what's discounted (condition, days-on-market, listing class) to confirm the premium yield is real.
Location & tenants
- Location reads 85/100 on livability (#30 in NY, #518 nationally) — a professional / high-income tenant draw. Strengths: commute A+, housing A+, health & safety A+.
- North Tonawanda City School District (suburban): math 42% / reading 57% proficiency, ranked #398 of 590 in NY (top 68%) — families likely to look elsewhere, expect single-tenant / working-renter base with shorter leases.
- Zoned schools: Ohio Elementary School (math 34% / reading 64%, grade D, #1,085 of 2,108 statewide, top 56%, 371 students, 0% FRL); North Tonawanda Middle School (math 27% / reading 52%, grade F, #418 of 729 statewide, top 59%, 447 students, 50% FRL); North Tonawanda High School (math 93% / reading 64%, grade A-, #562 of 1,100 statewide, top 51%, 1,001 students, 46% FRL) — zoned schools at 32% FRL track the district average.
- Market conditions: Rents rising fast (+6.0%/yr); 180 active listings in the ZIP; 3 comparable units currently listed for rent nearby; rentals leasing fast (median 12d on market — plan ~1-2 weeks tenant-placement turnaround); 167 units permitted in Niagara County in 2024 (0 in 5+ unit buildings).
Forward outlook
- Local home prices are declining (-3.0%/yr); year-one equity from $2k of loan paydown is wiped out by about $7k of value loss. Plan a longer hold.
- Niagara County population projected at -19% by 2050 — secular population decline; favor cash flow + early exit over multi-decade hold.
Negotiation context
- Only 8 days on market — expect competitive offers; lowballing is unlikely to land.
- Current owner paid $92k; list at $224k implies a 143% gain — meaningful room to come down on a strong offer.
Questions for the listing agent
- What do current leases actually rent for vs. the listed asking? Can we see a recent rent roll and the last 12 months of T-12 income?
- Built in 1978 — when were the roof, HVAC, electrical panel, plumbing, and water heater last replaced?
- Is there a deadline driving the sale (1031 exchange, divorce, estate, relocation)? That informs how much negotiation room exists.
- Schools are B-rated — typically a magnet for longer-tenancy family renters. What's the average tenant stay here, and is there a school-zone premium baked into asking?
- The area grade is low — what's the realistic commute time and amenity access for the typical tenant pool here? Any planned neighborhood developments (good or bad) we should know about?
- What's the average days-on-market for RENTAL listings here right now (not sales)? A rising rental-DOM trend means longer vacancies and softer asking-rent achievability than the comps imply.
- What's the recent tenant-quality profile in this submarket — average credit score on applications, eviction rate, late-payment / NSF rate, and stable-employment percentage? A property-management company in the area should have these aggregated.
- How much new for-sale + rental construction is in the pipeline within 1–3 miles? Heavy new supply typically softens prices + rents 12–24 months out; constrained supply supports both.
Investment metrics
- 1% rule
- 0.77% ✗
- Cap rate
- 5.10%
- Cash-on-cash
- -4.24%
- DSCR
- 0.81
- GRM
- 10.8
CMA / ARV
- ARV (median comp)
- $369,232
- List price
- $223,900
- Delta
- -39.36%
- Verdict
- UNDERPRICED
- Comps
- 20 within 1.0 mi
Show comp detail 12 sales within ~0.75 mi
| Address | Dist | Beds/Ba | Sqft | Sold | Price | $/sf | Match |
|---|---|---|---|---|---|---|---|
| 1533 Jamaica | 0.28mi | 3/1.5 | 1,430 (+8%) | 8mo | $335,000 | $234 | 66 |
| 1317 Master St | 0.39mi | 4/2.0 (+1) | 1,382 (+4%) | 6mo | $245,000 | $177 | 61 |
| 1416 Forbes St | 0.51mi | 3/2.0 | 1,280 (-4%) | 10mo | $236,000 | $184 | 58 |
| 1000 Pioneer Dr | 0.38mi | 3/2.0 | 1,440 (+8%) | 9mo | $335,000 | $233 | 56 |
| 1023 Remington Dr | 0.56mi | 3/2.0 | 1,386 (+4%) | 8mo | $275,000 | $198 | 56 |
| 763 Fairmont Ave | 0.64mi | 4/2.0 (+1) | 1,328 (0%) | 7mo | $280,000 | $211 | 56 |
| 1325 Brookfield Dr | 0.58mi | 3/1.5 | 1,439 (+8%) | 3mo | $249,000 | $173 | 54 |
| 1296 Greenbrier Ln | 0.51mi | 3/2.0 | 1,473 (+11%) | 5mo | $285,000 | $193 | 50 |
| 1058 Ruie Rd | 0.68mi | 3/2.0 | 1,396 (+5%) | 7mo | $339,900 | $243 | 50 |
| 1362 Nash Rd | 0.27mi | 4/2.0 (+1) | 1,512 (+14%) | 9mo | $215,000 | $142 | 48 |
| 1312 Doebler Dr | 0.49mi | 3/1.5 | 1,500 (+13%) | 8mo | $275,000 | $183 | 47 |
| 728 Westbrook Dr | 0.53mi | 3/1.0 | 1,136 (-14%) | 6mo | $222,000 | $195 | 46 |
Match score weights: distance 35% · size 25% · config 20% · recency 20%. Top-matched comps best support the ARV.
Projected returns pro-forma
-3.0% appreciation · 5.96% rent growth · sell at horizon
- IRR
- -20.1%
- Equity multiple
- 0.28×
- Total profit
- $-45,069
- Equity at exit
- $33,384
- IRR
- -7.6%
- Equity multiple
- 0.45×
- Total profit
- $-34,176
- Equity at exit
- $19,359
Cash invested: $62,692 (down + closing). Projections, not guarantees.
Landlord ↔ Tenant lean methodology
- Overall (STATE)
- 15 Strongly Tenant-Friendly
- State New York
- 15 Strongly Tenant-Friendly · D+10
- County
- — inherits STATE
- City
- — inherits STATE
ZIP-level market 14120
- Rents YoY
- 6.0%
- Active inventory
- 180
- Price-to-rent
- 10.8×
Monthly cashflow live
- Estimated rent
- $1,724 medium interval (Pro) →
- Mortgage (P&I)
- −$1,174
- Tax from tax record
- −$317 /mo · $3,800/yr
- Insurance
- −$93
- HOA
- −$0
- Vacancy / Maint / Mgmt
- −$362
- Net cashflow
- $-222
Break-even live
Sensitivity live
| Price | -10% $-95 | -5% $-158 | +0% $-222 | +5% $-285 | +10% $-349 |
|---|---|---|---|---|---|
| Rent | -10% $-358 | -5% $-290 | +0% $-222 | +5% $-154 | +10% $-86 |
| Rate | -1.0pp $-109 | -0.5pp $-165 | base $-222 | +0.5pp $-280 | +1.0pp $-339 |
UW: 25.0% down · 7.5% · 30yr · 1.5% tax · 5.0% vac · 8.0% maint · 8.0% mgmt
Financing live
Cash to close
- Down payment
- $55,975
- Closing costs
- $6,717
- Reserves months
- —
- Total cash needed
- —
Loan-product check · same deal, 3 products live
Conventional
25% down · 7.5% · 30yr
- Down + closing
- —
- Monthly P&I
- —
- Monthly cashflow
- —
- DSCR
- —
- Eligible?
- —
Personal DTI + credit; lowest rate.
DSCR
20% down · 8.5% · 30yr
- Down + closing
- —
- Monthly P&I
- —
- Monthly cashflow
- —
- DSCR
- —
- Eligible?
- —
No personal income docs; deal must DSCR.
Hard money
10% down · 12.0% · 12mo
- Down + closing
- —
- Monthly P&I
- —
- Monthly cashflow
- —
- DSCR
- —
- Eligible?
- —
Short-term bridge; refi at stabilization.
Rent comps 3 comps
| Address | Beds | Baths | Sqft | Rent | $/sqft | DOM | Units | Dist |
|---|---|---|---|---|---|---|---|---|
| 757 Remington Dr Unit 1 North Tonawanda, NY | 3.0 | 1.5 | 1100 | $1,750 | $1.59 | 12d | 1 | 0.48mi |
| 175 12th Ave North Tonawanda, NY | 3.0 | 1.0 | 1000 | $1,600 | $1.60 | 45d | 1 | 1.40mi |
| 528 Ward Rd North Tonawanda, NY | 3.0 | 1.0 | 916 | $2,250 | $2.46 | 3d | 1 | 1.50mi |
Listing history 2 events
-
2026-05-15$223,900 Active 1137-char remark
-
2002-05-22soldstatus $92,000
ⓘ Source: listings_history table (triggers on properties + properties_extension) + one-shot
backfill from property_details.listing_events for pre-trigger history.
Tax reassessment forecast NY · Partial reset (capped growth)
- Current annual tax
- $3,800 · $317/mo
- Projected year-2 tax
- $3,800 · $317/mo
- Expected delta
- $0/yr ($0/mo · 0.0%)
ⓘ Screening estimate from a state-policy table — verify with the county assessor before closing.
Climate risk First Street
- Flood 3/10 Moderate FEMA zone X (unshaded) · 20% chance over 30 yrs
- Wildfire 1/10 Low
- Heat 2/10 Low 7 d/yr ≥94°F today · 15 d/yr by 30 yrs out
- Wind 1/10 Low
- Air quality 3/10 Moderate 2 unhealthy d/yr today · 4 by 30 yrs out
Nearby sold comps map
Loading sold comps map…
Walkable amenities ~0.75 mi
Loading nearby amenities…
Taxation est. · year 1
- Rental income
- $20,694
- − Mortgage interest
- −$12,542
- − Property taxes
- −$3,800
- − Insurance
- −$1,120
- − Repairs & maintenance
- −$1,655
- − Management
- −$1,655
- − Depreciation
- −$6,513
- Taxable loss
- −$6,592
- Est. tax savings @ 24.0%
- +$1,582
- After-tax cash flow
- $-1,079/yr
For passive investors: Depreciation is non-cash, so a rental often shows a tax loss while cash-flowing — sheltering income. Rental losses are passive: they offset passive income freely, and up to $25,000/yr can offset ordinary (W-2) income if you actively participate and your MAGI is under $100k (phasing out to $0 by $150k); unused losses carry forward. On sale, claimed depreciation is recaptured at up to 25%, and gains may owe capital-gains tax (a 1031 exchange can defer both). Figures are a year-1 estimate at your 24.0% rate — not tax advice; consult a CPA.
Schools (NCES district)
- District
- North Tonawanda City School District
- NCES district ID
- 3621240
- Math proficiency
- 42% ▼ -16.00%
- Reading proficiency
- 57% ▲ 4.00%
- Median HH income
- $48,348
- Composite
- 42.15/100
- National rank
- #3301
- State rank
- #398 of 590 in NY
Livability — North Tonawanda
- Score
- 85/100
- State rank
- #30
- US rank
- #518
Category grades
Schools grade is shown separately in the Schools card above.
Census & demographics
- Census place
- North Tonawanda, NY
- County
- Niagara County · 157,377 people
- City population
- 44,241
- Metro
- Buffalo-Cheektowaga, NY
- Population (ZIP)
- 44,241
- Household income
- $74,871
- Rent vs Own
- Severe rent burden
- 1303.0
Population outlook (Niagara County) Hauer SSP2
- Today (2025)
- 204,149 people
- By 2030
- 197,900 · -3.1%
- By 2040
- 182,239 · -10.7%
- By 2050
- 165,198 · -19.1%
- By 2075
- 129,416 · -36.6%
- By 2100
- 96,222 · -52.9%
Race, ethnicity, and origin ACS 2023
- Neighborhood character
- Predominantly White (91%)
- Race & ethnicity
- White 91% Two or more races 4% Hispanic / Latino 3% Black 2%
- Common ancestry
- Romanian 15% Lithuanian 2% Slovak 2%
- Foreign-born
- 4% · Canada, China
- Languages at home
- 95% English-only · Russian/Polish/Slavic 2% Spanish 1% Other Indo-European 1%
Political lean MEDSL · Niagara
- 2024 margin
- R (+14.9) · D 42.5% · R 57.5%
- 2008→2024 swing
- -15.9pp toward R · 2008: 1.0pp · 2024: -14.9pp
- All cycles
- 2024: R+14.9 2020: R+9.7 2016: R+19.0 2012: D+0.6 2008: D+1.0
Not yet ingested
- Civics
- —
Market trends
- HPI YoY
- ▼ -260.39%
- Current HPI
- 303.1744
- Rent YoY
- ▲ 5.96%
- Metro
- Buffalo-Cheektowaga, NY
- State GDP YoY
- ▲ 2.60%
- F500 in state
- 92
Industry mix (Fortune 500 HQ in NY)
| Industry | F500 HQs | Revenue |
|---|---|---|
| Financial Services | 10 | $950B |
|
||
| Consumer Goods | 9 | $162B |
|
||
| Insurance | 4 | $225B |
|
||
| Telecommunications | 2 | $144B |
|
||
| Pharmaceuticals | 2 | $112B |
|
||
| Media / Entertainment | 2 | $69B |
|
||
Price history
+143.4% since first listed3 events — show timeline
- 2026-05-23 Pending — WNYREIS
- 2026-05-15 Listed $223,900 WNYREIS
- 2002-05-22 Sold (Public Records) $92,000 Public Records
Property tax history
+5.2%/yrLatest (2025): $3,800 · +4.5% YoY. Source: county tax records.
Cash-flow waterfall
monthlySold comps — $/sqft
last 12 mo · ≤1 miLoading sold comps…